SOM cluster: 2179
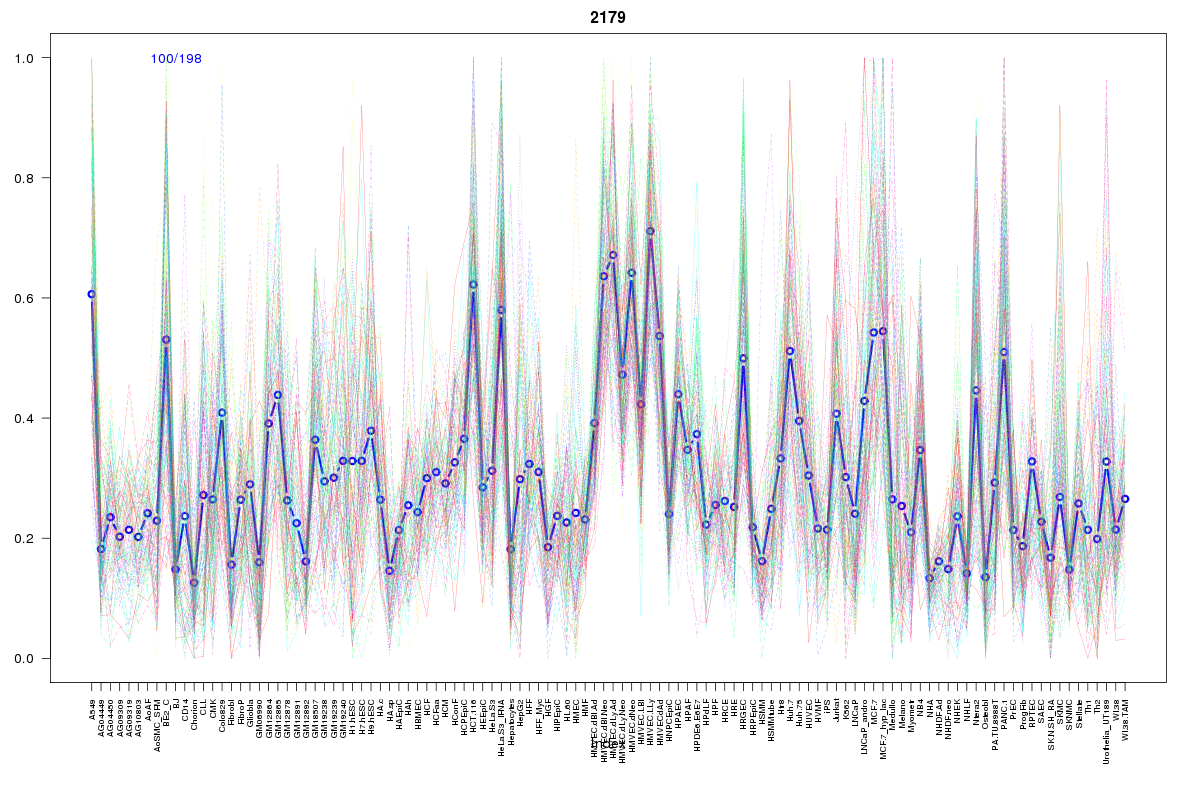
Cluster Hypersensitivity Profile

Genomic Location Trend
These plots show the distribution of the DHS sites surrounding the Transcript Start Site of the nearest gene.
Stats
Number of sites: 198Promoter: 2%
CpG-Island: 0%
Conserved: 51%
Enriched Motifs & Matches
Match Detail: [Jaspar]
|
| ||
|---|---|---|
| Sites: 70/100 | e-val: 0 | ||
| Factor | e-val(match) | DB |
| CTCF | 0.0000000000020531 | JASPAR |
| INSM1 | 0.00084876 | JASPAR |
| Zfp423 | 0.0010189 | JASPAR |
| T | 0.0031537 | JASPAR |
| PLAG1 | 0.0080231 | JASPAR |
|
| ||
| Sites: 21/100 | e-val: 0.00073 | ||
| Factor | e-val(match) | DB |
| Foxd3 | 0.0019754 | JASPAR |
| FEV | 0.0064979 | JASPAR |
| MEF2A | 0.0077558 | JASPAR |
| Foxq1 | 0.015194 | JASPAR |
| Evi1 | 0.015921 | JASPAR |
BED file downloads
Top 10 Example Regions
| Location | Gene Link | Dist. |
|---|---|---|
| chr7: 152033980-152034130 | KMT2C | 49.51 |
| chr20: 8740360-8740510 | PLCB1 | 49.8 |
| chr17: 77061300-77061450 | ENGASE | 51.85 |
| chr17: 77061300-77061450 | LGALS3BP | 51.85 |
| chr7: 75986180-75986330 | ZP3 | 53.45 |
| chr7: 75986180-75986330 | HSPB1 | 53.45 |
| chr7: 75986180-75986330 | YWHAG | 53.45 |
| chr4: 88976160-88976310 | ABCG2 | 58.56 |
| chr3: 170905600-170905750 | TNIK | 66.53 |
| chr2: 105904320-105904470 | TGFBRAP1 | 69.49 |