Gene: B3GAT1
chr11: 134248397-134257091Expression Profile
(log scale)
Graphical Connections
Distribution of linked clusters:
You may find it interesting if many of the connected DHS sites belong to the same cluster.| Cluster Profile | Cluster ID | Number of DHS sites in this cluster |
|---|---|---|
 | 10 | 5 |
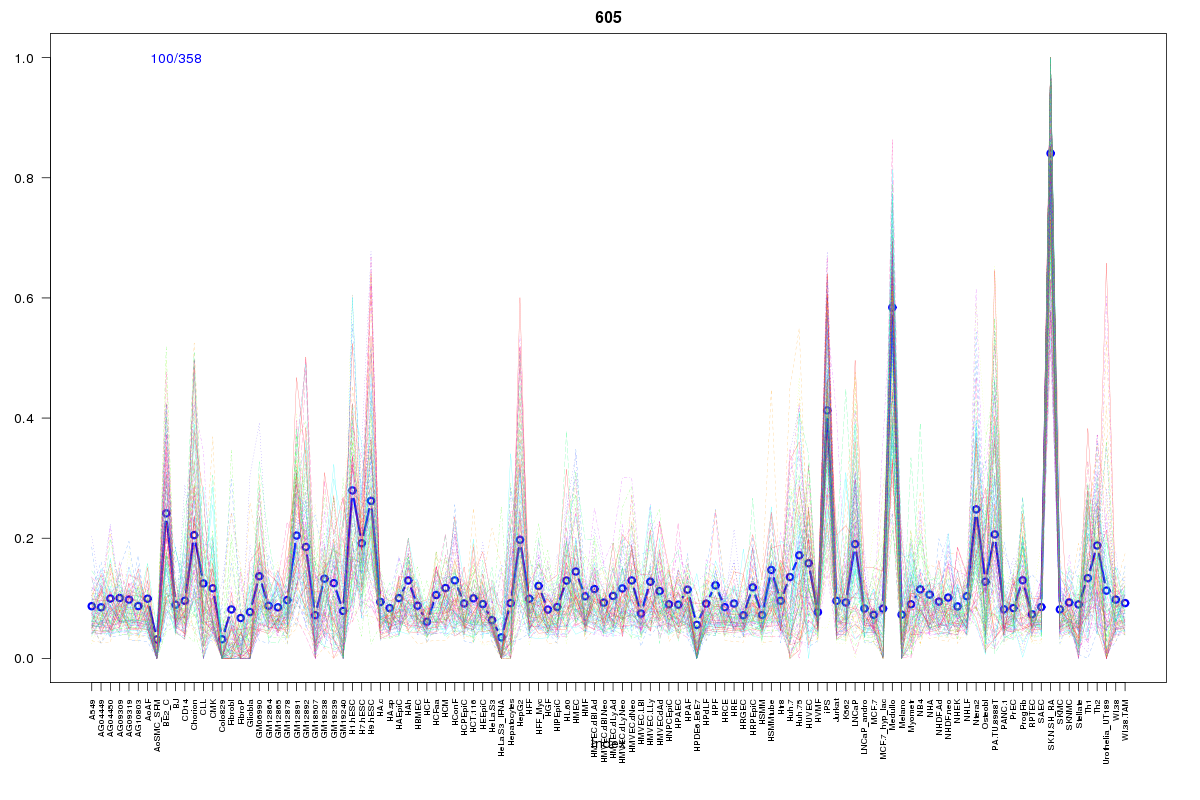 | 605 | 2 |
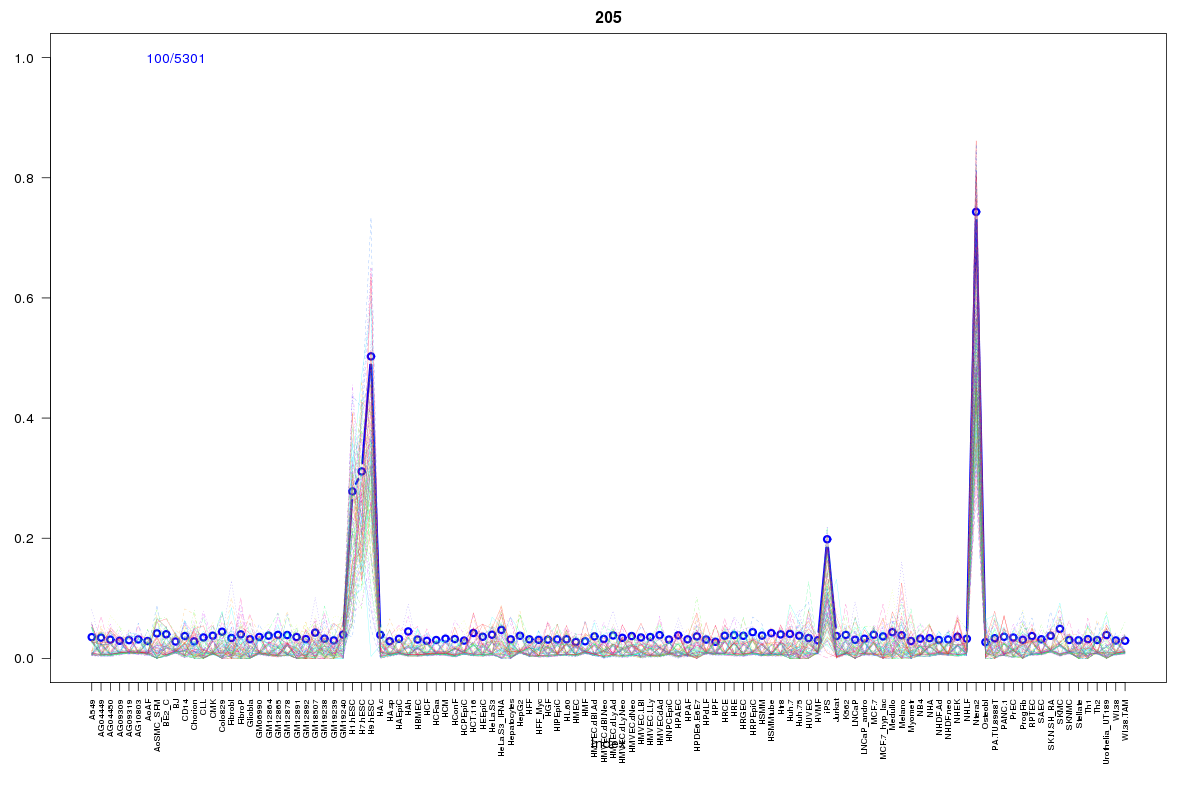 | 205 | 2 |
 | 927 | 1 |
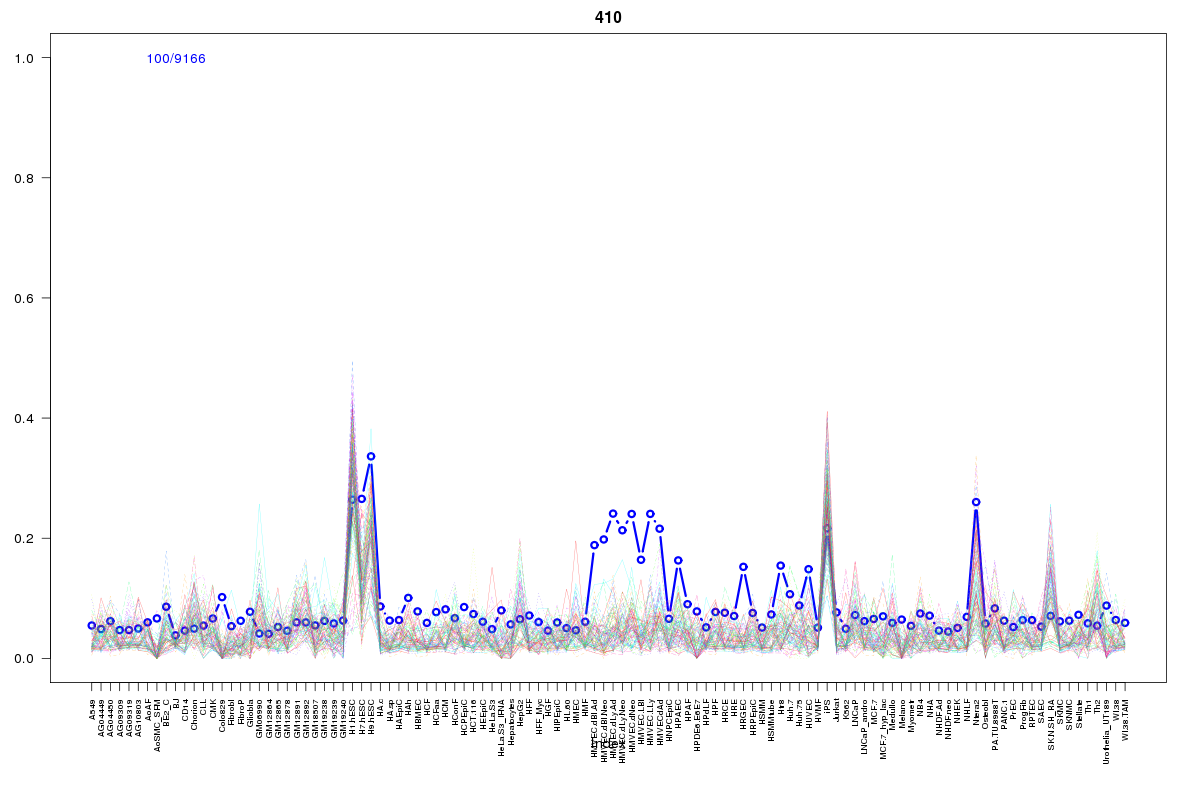 | 410 | 1 |
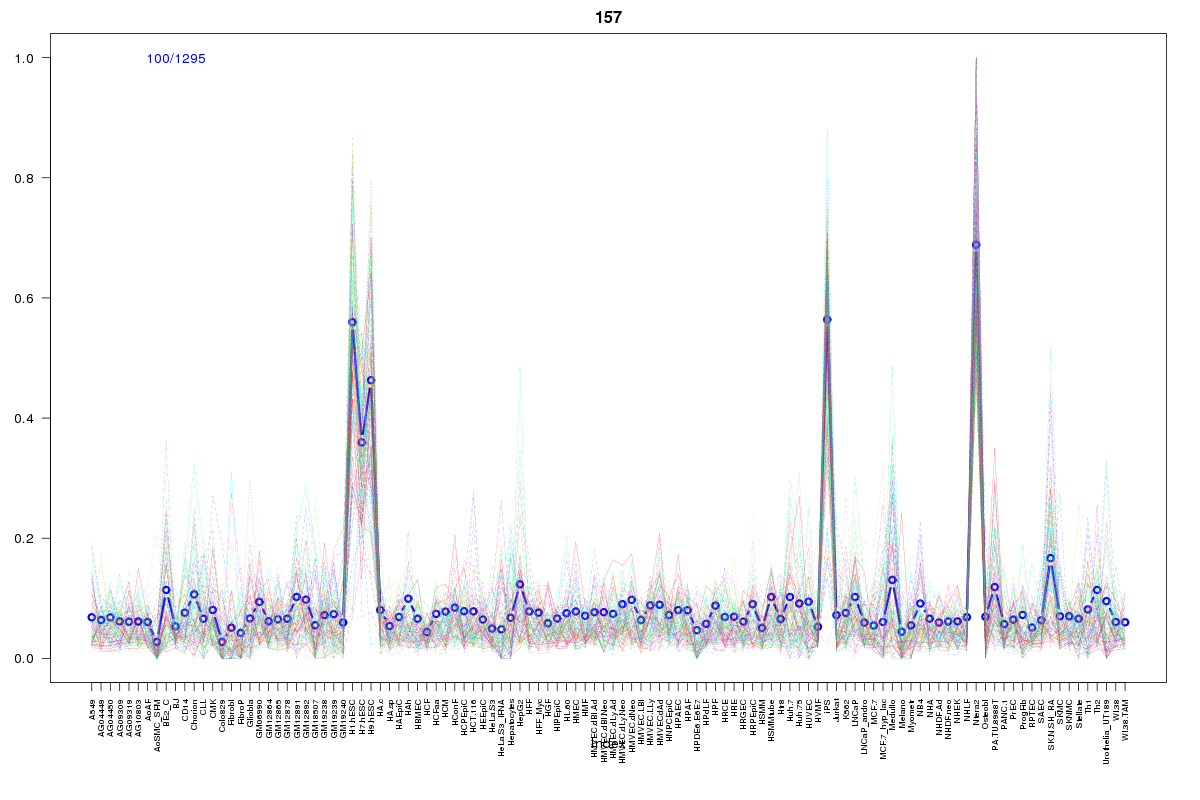 | 157 | 1 |
 | 1401 | 1 |
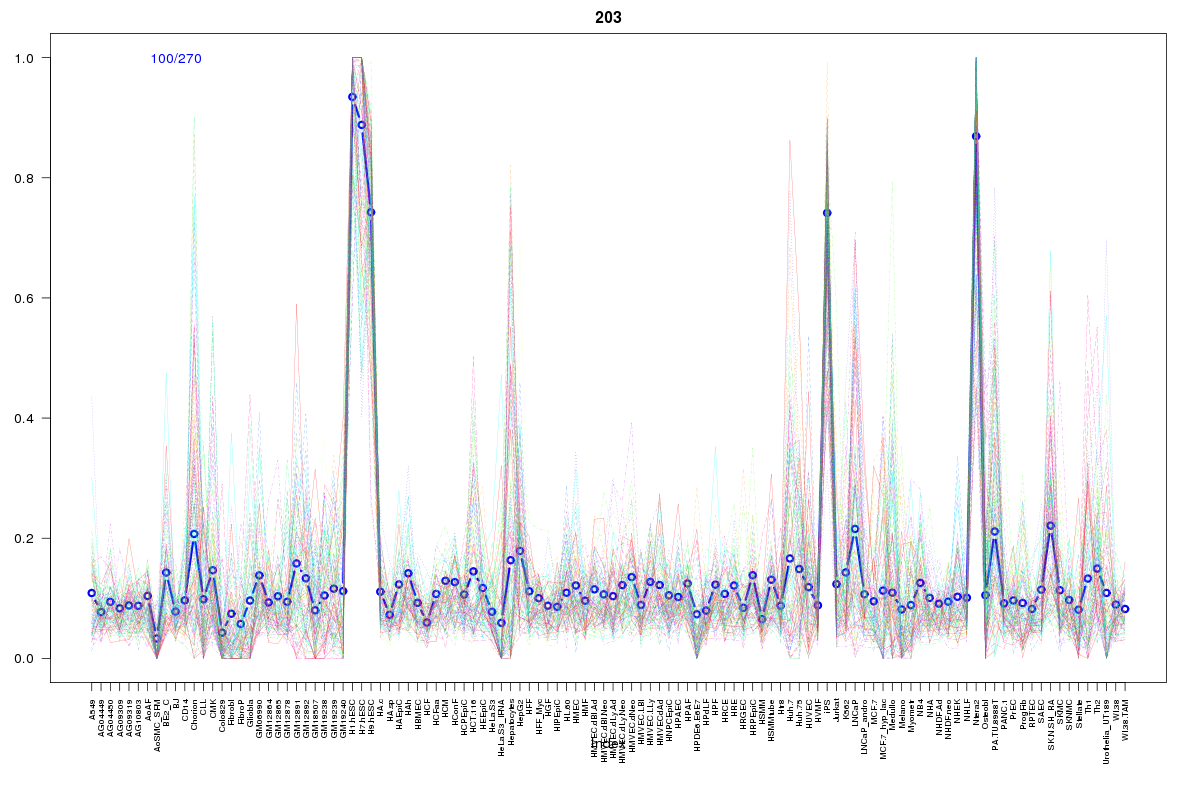 | 203 | 1 |
Resources
BED file downloads
Connects to 14 DHS sitesTop 10 Correlated DHS Sites
p-values indiciate significant higher or lower correlation| Location | Cluster | P-value |
|---|---|---|
| chr11:134348660-134348810 | 10 | 0 |
| chr11:134347520-134347670 | 205 | 0.002 |
| chr11:134157925-134158075 | 10 | 0.007 |
| chr11:134347745-134347895 | 10 | 0.008 |
| chr11:134282505-134282655 | 605 | 0.011 |
| chr11:134334245-134334395 | 10 | 0.012 |
| chr11:134283480-134283630 | 157 | 0.012 |
| chr11:134346445-134346595 | 203 | 0.015 |
| chr11:134349580-134349730 | 205 | 0.015 |
| chr11:134309205-134309355 | 1401 | 0.019 |
| chr11:134281405-134281555 | 605 | 0.021 |
External Databases
UCSCEnsembl (ENSG00000109956)