SOM cluster: 605
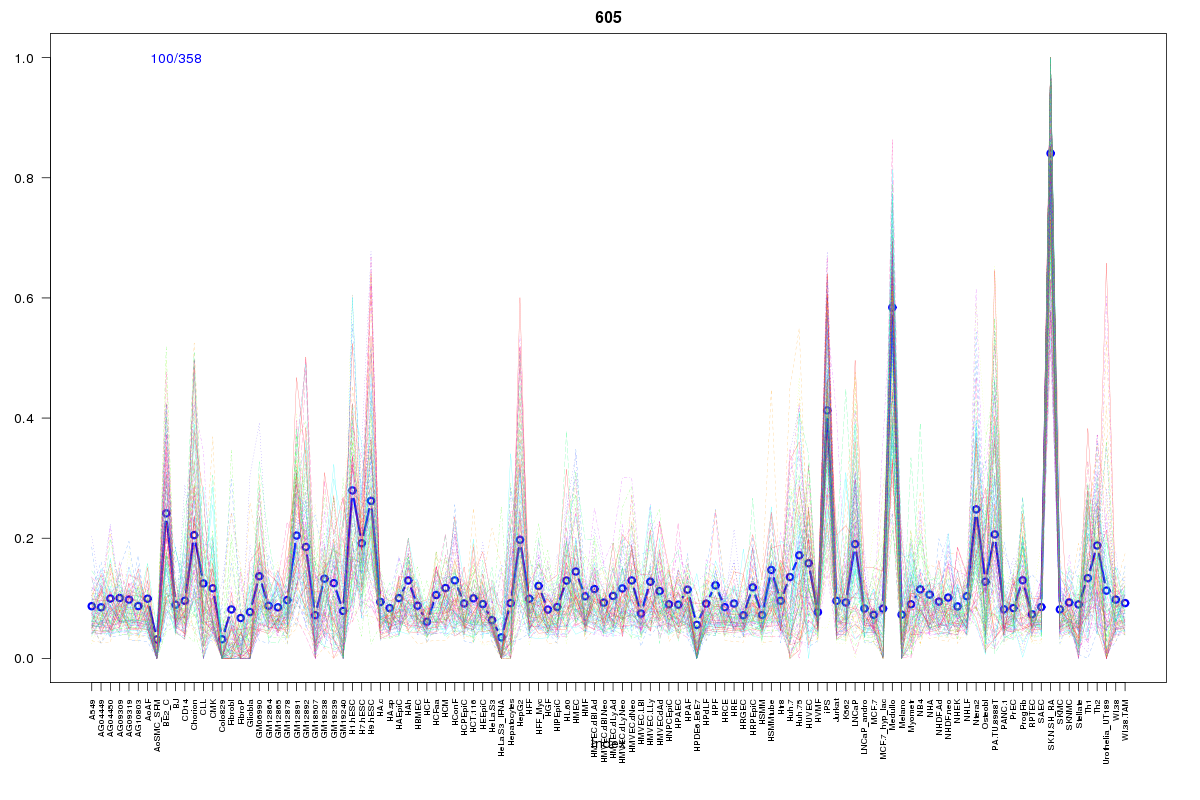
Cluster Hypersensitivity Profile

Genomic Location Trend
These plots show the distribution of the DHS sites surrounding the Transcript Start Site of the nearest gene.
Stats
Number of sites: 358Promoter: 33%
CpG-Island: 80%
Conserved: 67%
Enriched Motifs & Matches
Match Detail: [Jaspar]
|
| ||
|---|---|---|
| Sites: 92/100 | e-val: 0 | ||
| Factor | e-val(match) | DB |
| SP1 | 0.000039693 | JASPAR |
| TFAP2A | 0.00011441 | JASPAR |
| PLAG1 | 0.00039861 | JASPAR |
| Egr1 | 0.026335 | JASPAR |
| Zfx | 0.075086 | JASPAR |
|
| ||
| Sites: 72/100 | e-val: 1.4e-33 | ||
| Factor | e-val(match) | DB |
| SP1 | 0.00000078221 | JASPAR |
| RREB1 | 0.00032842 | JASPAR |
| TFAP2A | 0.0020745 | JASPAR |
| Tal1::Gata1 | 0.0087739 | JASPAR |
| Klf4 | 0.0092608 | JASPAR |
BED file downloads
Top 10 Example Regions
| Location | Gene Link | Dist. |
|---|---|---|
| chr19: 34112445-34112595 | CHST8 | 38.15 |
| chrX: 101906200-101906350 | GPRASP1 | 48.76 |
| chr11: 17757225-17757375 | KCNC1 | 51.47 |
| chr8: 6692965-6693115 | XKR5 | 52.61 |
| chr11: 22214685-22214835 | ANO5 | 56.24 |
| chr17: 77903865-77904015 | CBX4 | 60.49 |
| chr18: 56531425-56531575 | ZNF532 | 60.53 |
| chr4: 90758560-90758710 | SNCA | 61.07 |
| chr17: 2652865-2653015 | RAP1GAP2 | 61.08 |
| chr7: 31092120-31092270 | ADCYAP1R1 | 63.34 |