Gene: PLOD1
chr1: 11994261-12018677Expression Profile
(log scale)
Graphical Connections
Distribution of linked clusters:
You may find it interesting if many of the connected DHS sites belong to the same cluster.| Cluster Profile | Cluster ID | Number of DHS sites in this cluster |
|---|---|---|
 | 251 | 2 |
 | 655 | 1 |
 | 2114 | 1 |
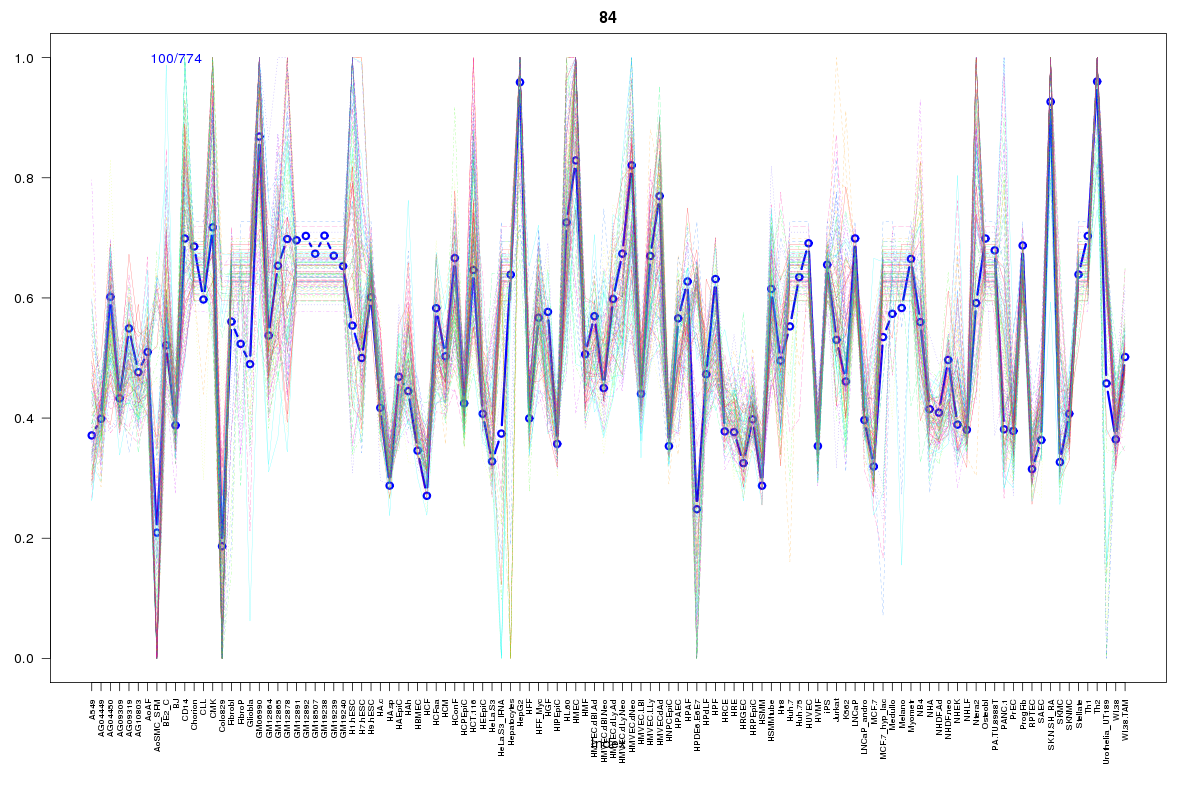 | 84 | 1 |
 | 1980 | 1 |
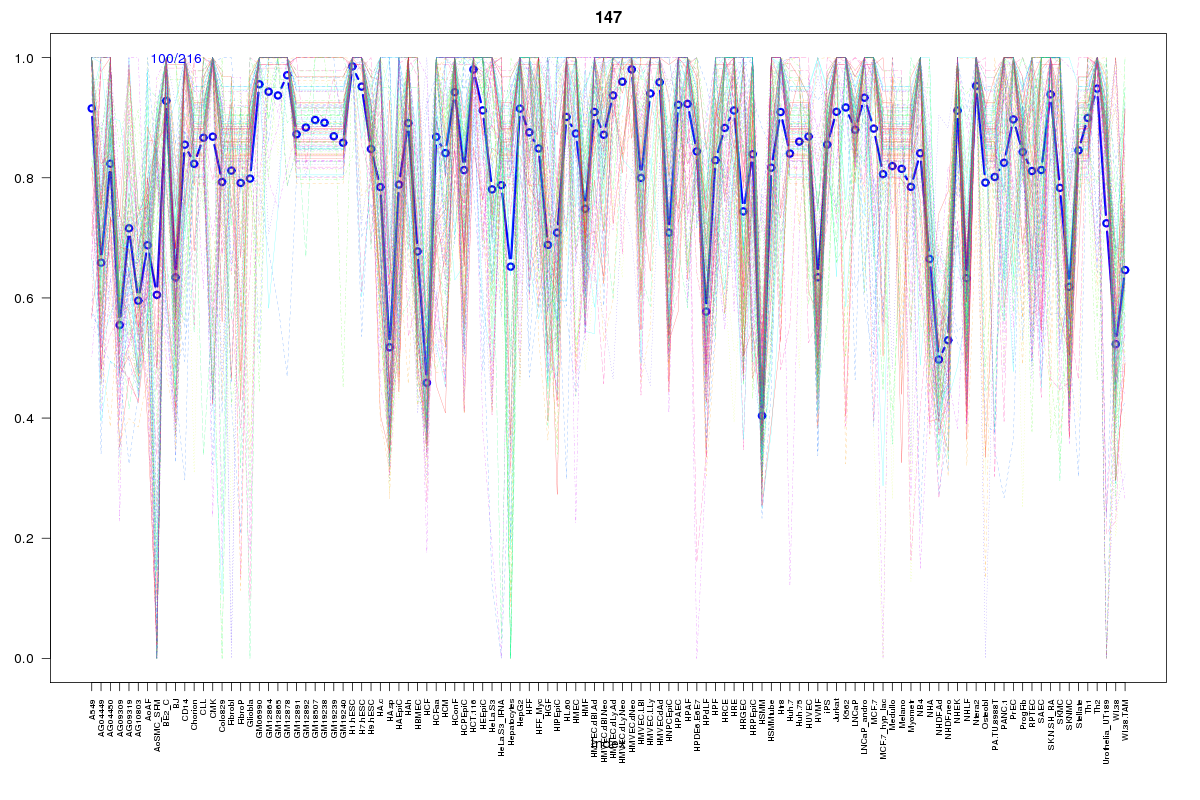 | 147 | 1 |
 | 948 | 1 |
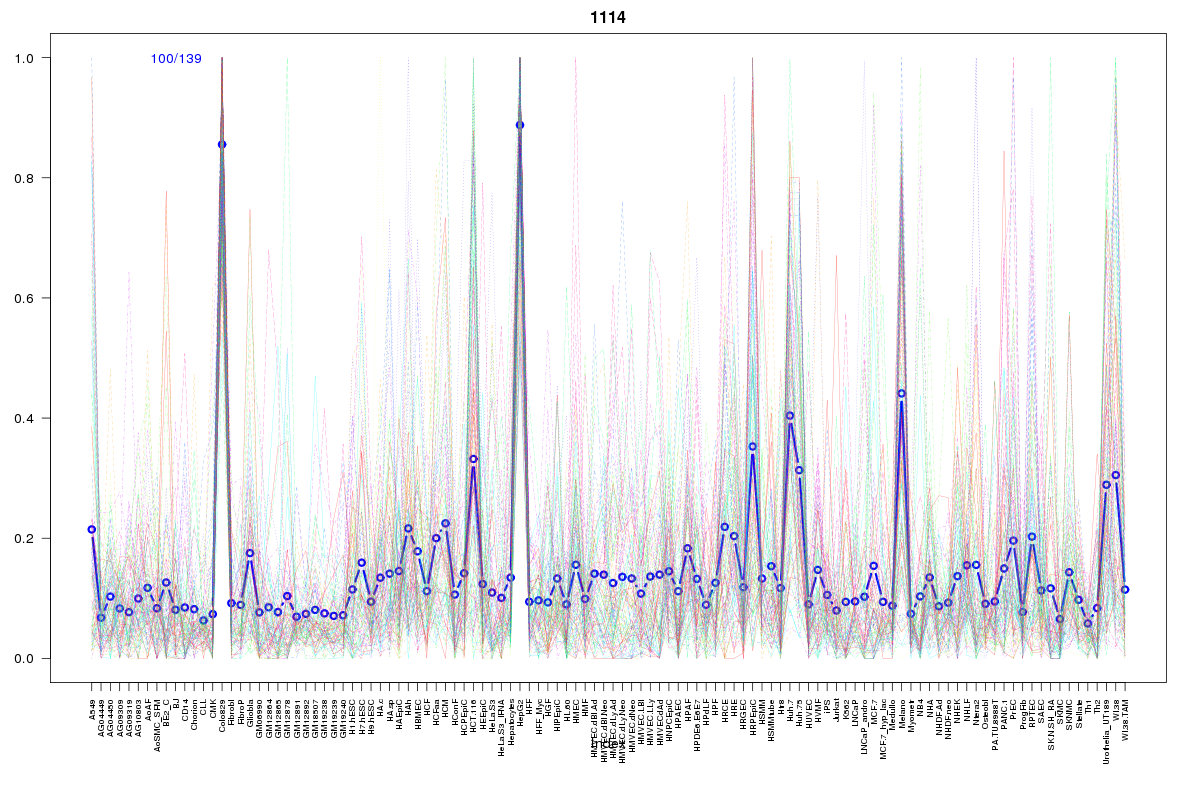 | 1114 | 1 |
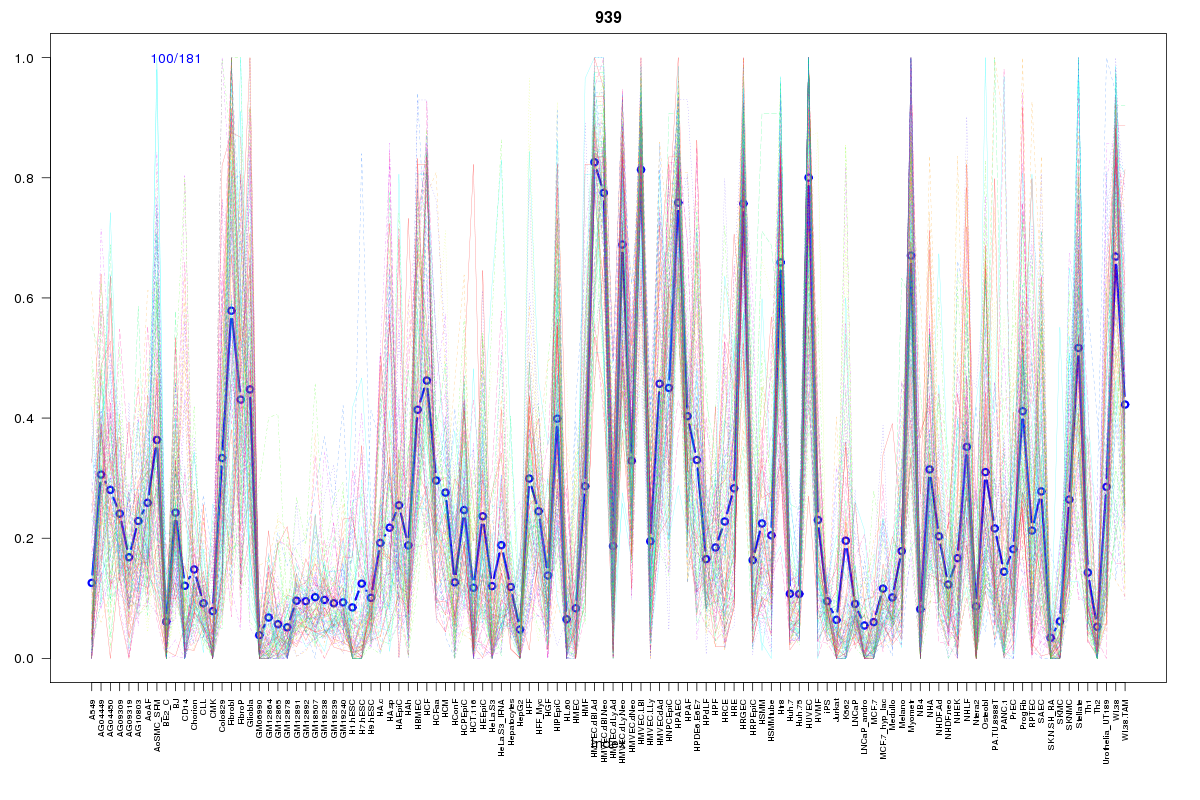 | 939 | 1 |
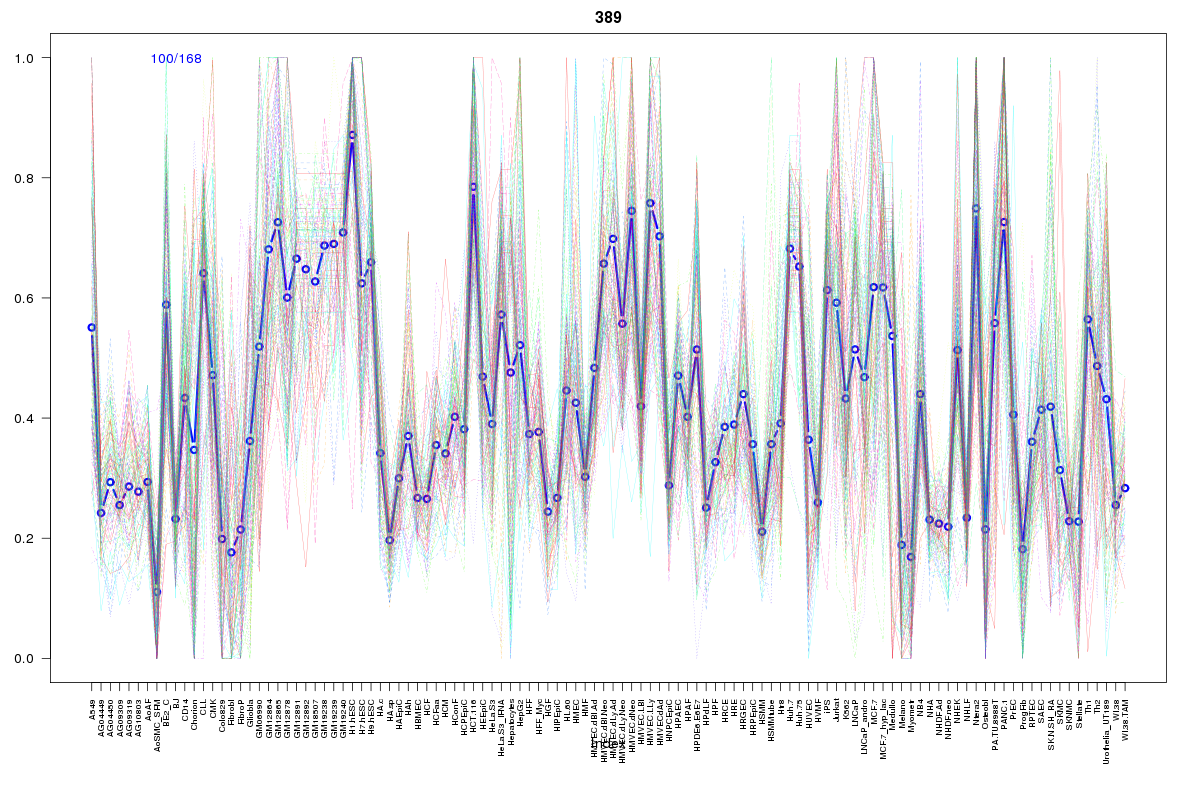 | 389 | 1 |
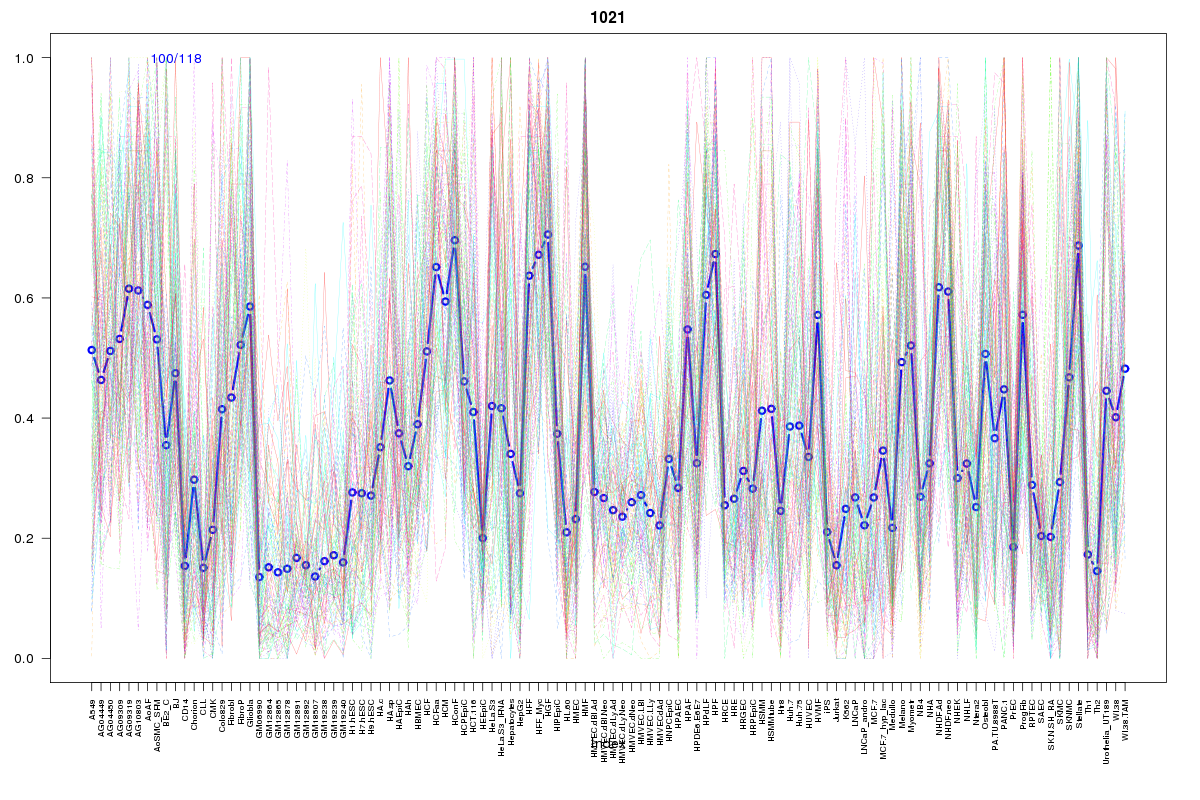 | 1021 | 1 |
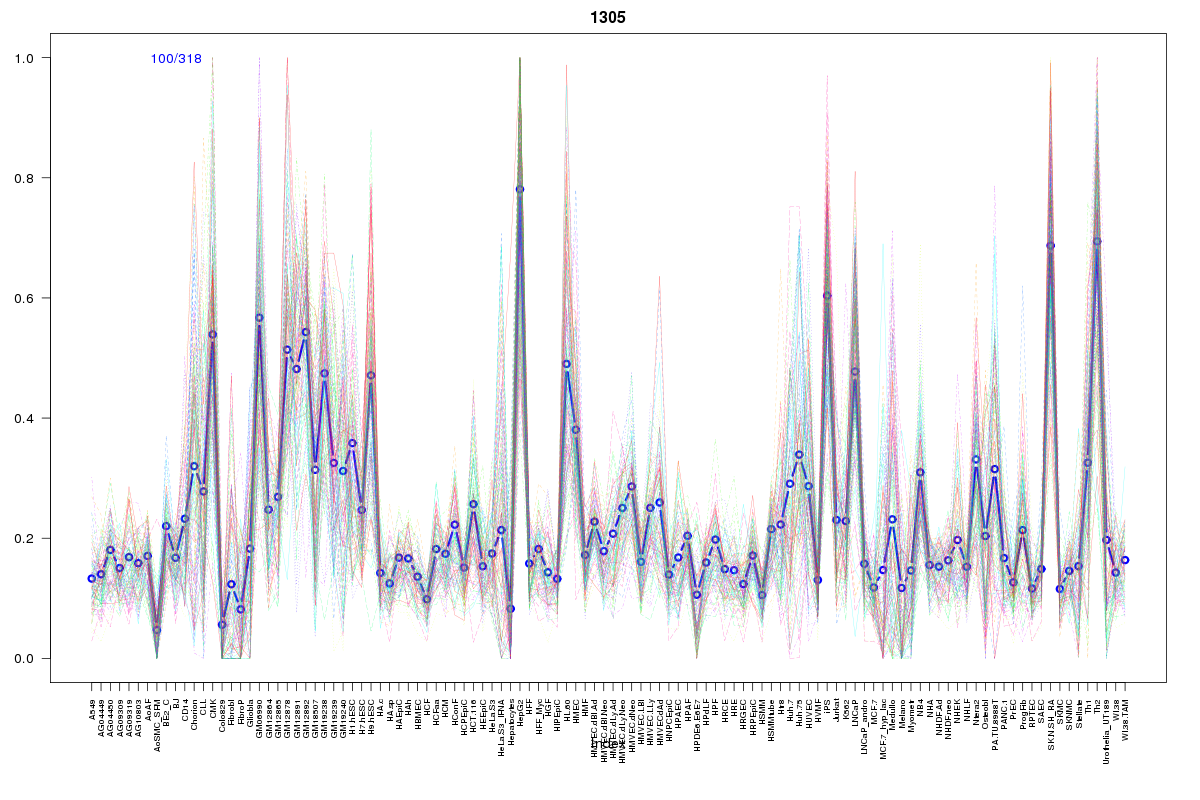 | 1305 | 1 |
 | 2452 | 1 |
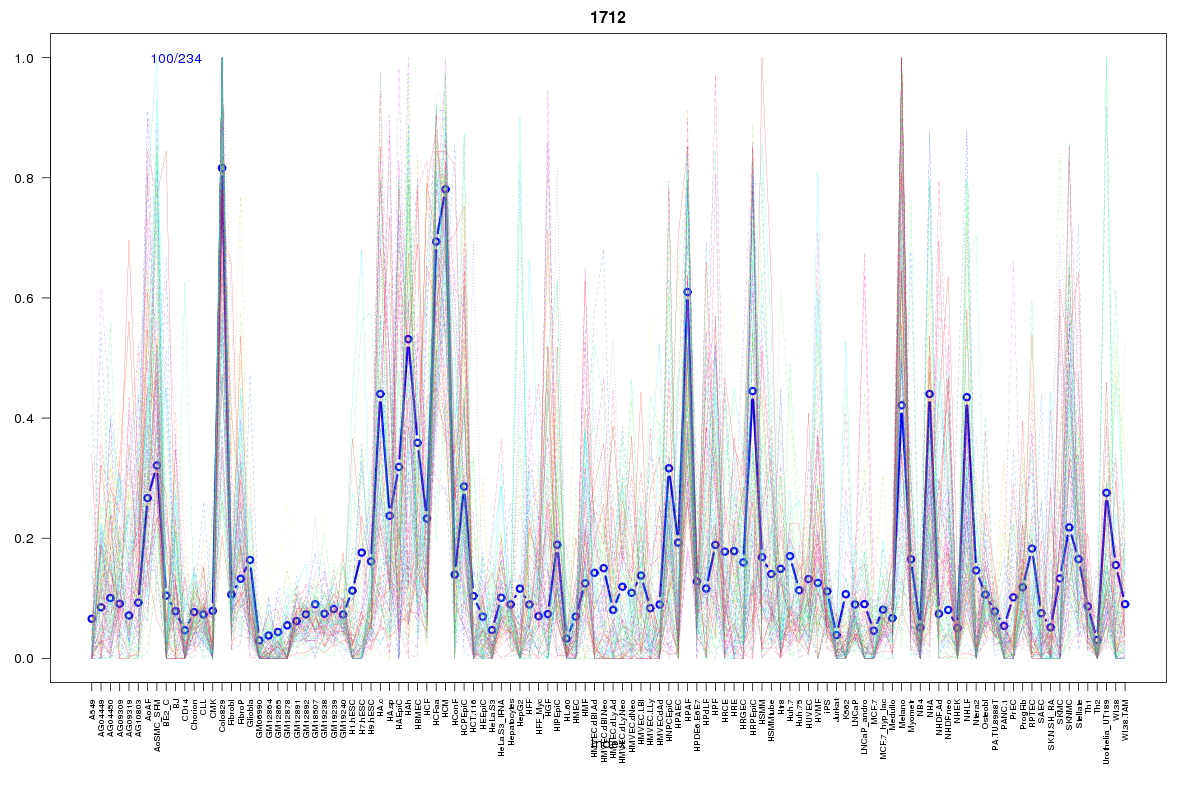 | 1712 | 1 |
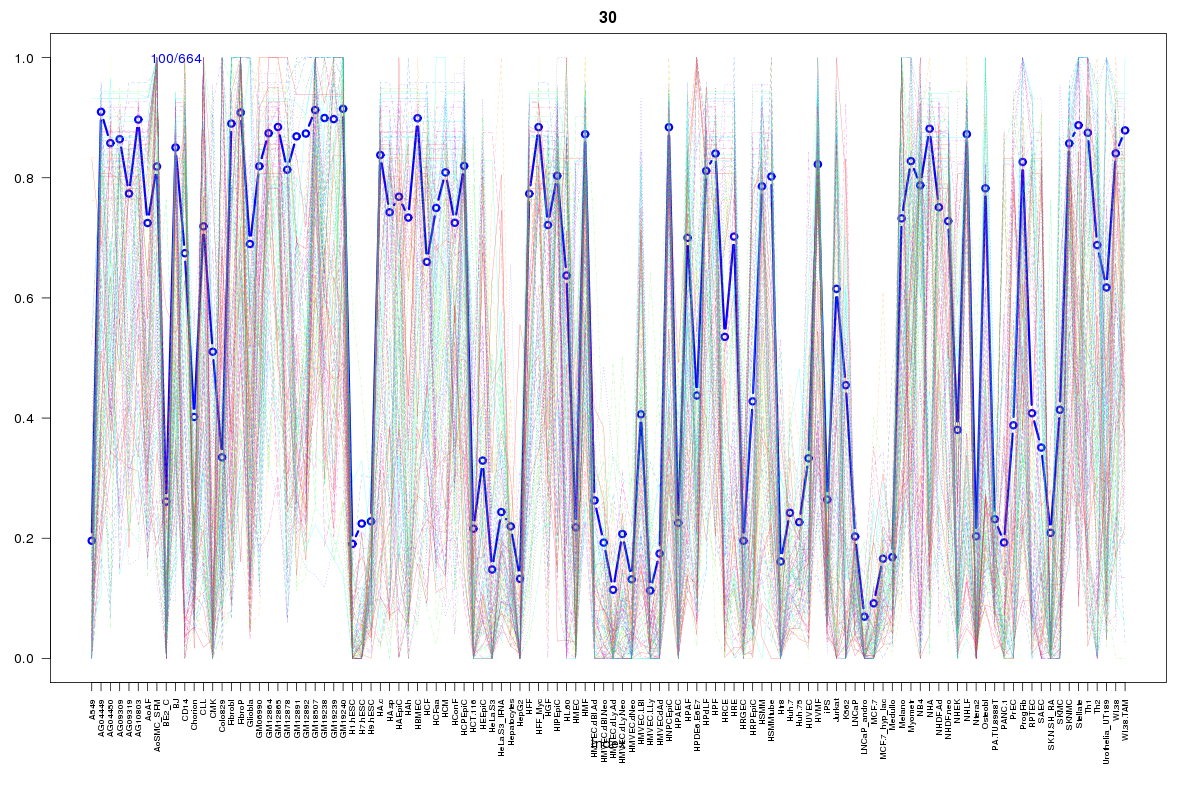 | 30 | 1 |
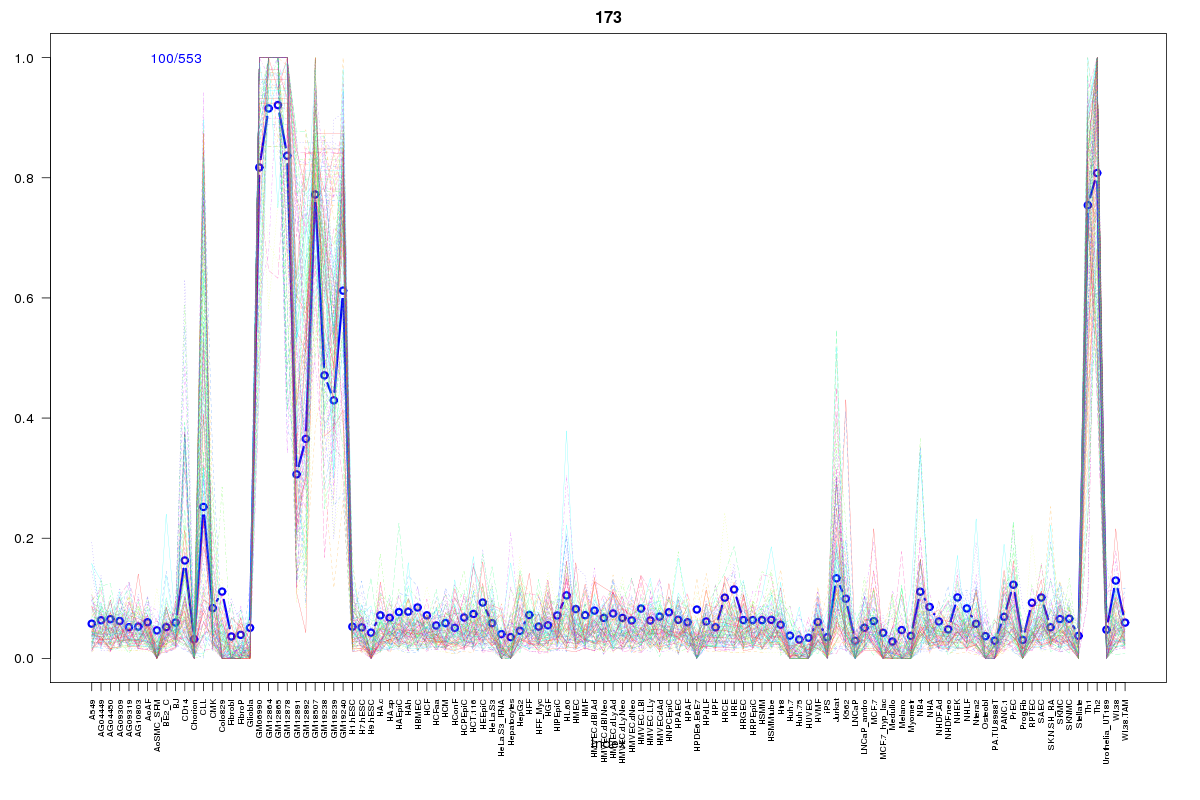 | 173 | 1 |
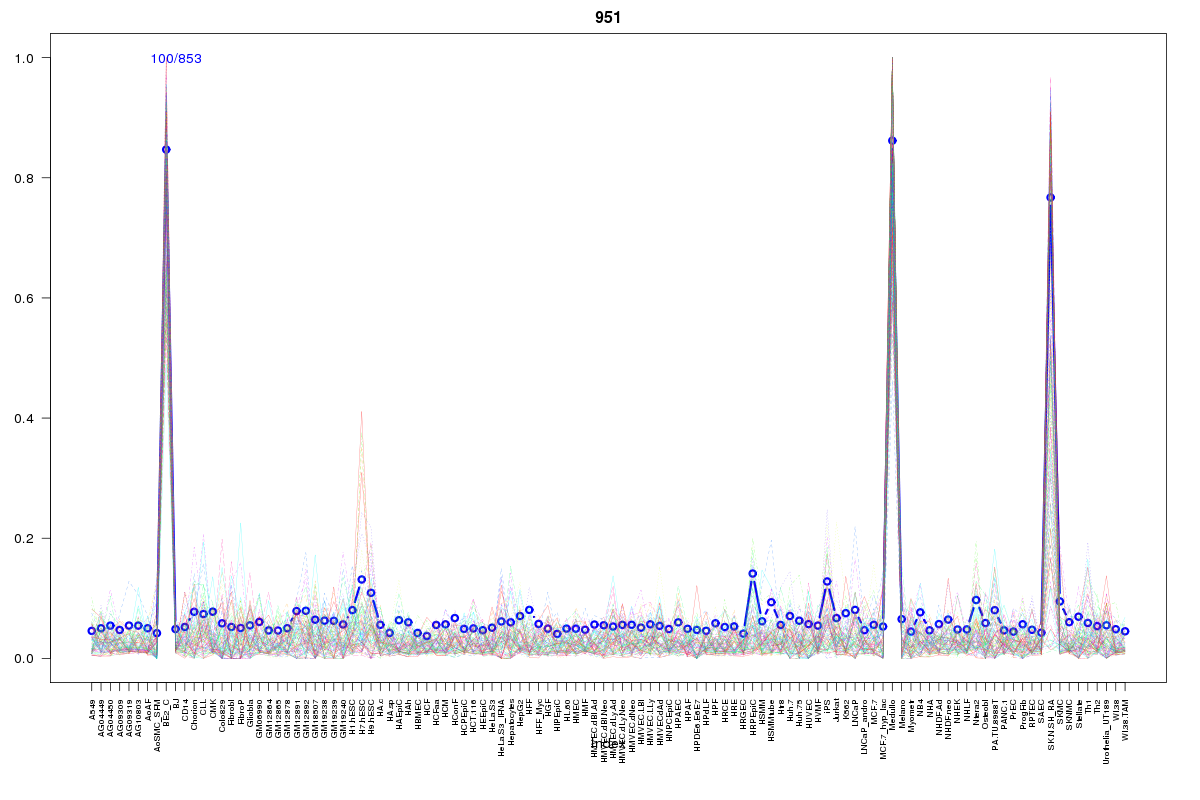 | 951 | 1 |
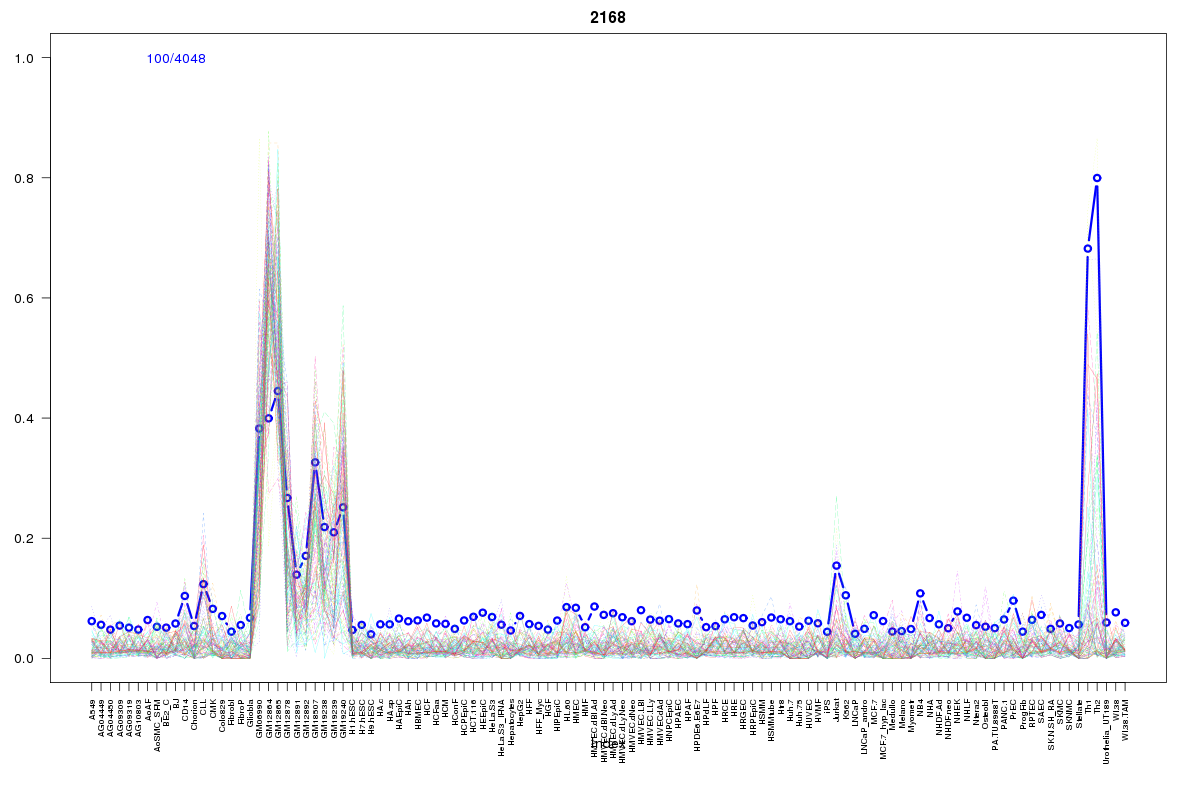 | 2168 | 1 |
Resources
BED file downloads
Connects to 19 DHS sitesTop 10 Correlated DHS Sites
p-values indiciate significant higher or lower correlation| Location | Cluster | P-value |
|---|---|---|
| chr1:11979020-11979170 | 948 | 0 |
| chr1:11991200-11991350 | 939 | 0.008 |
| chr1:12094460-12094610 | 1712 | 0.01 |
| chr1:12039700-12039850 | 1021 | 0.012 |
| chr1:11988060-11988210 | 1114 | 0.014 |
| chr1:12100720-12100870 | 30 | 0.016 |
| chr1:12046000-12046150 | 2452 | 0.021 |
| chr1:12107700-12107850 | 173 | 0.024 |
| chr1:11907005-11907155 | 655 | 0.024 |
| chr1:11905960-11906110 | 951 | 0.023 |
| chr1:11898825-11898975 | 251 | 0.019 |
External Databases
UCSCEnsembl (ENSG00000083444)