SOM cluster: 147
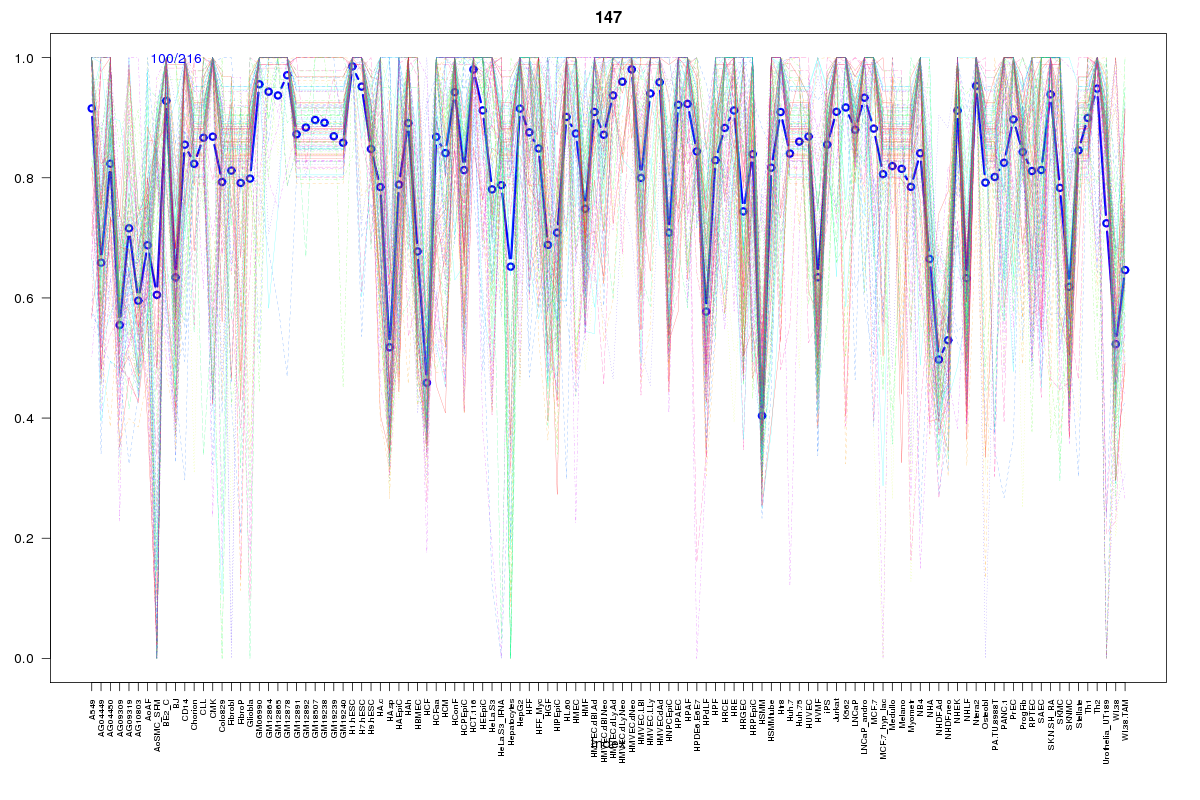
Cluster Hypersensitivity Profile

Genomic Location Trend
These plots show the distribution of the DHS sites surrounding the Transcript Start Site of the nearest gene.
Stats
Number of sites: 216Promoter: 56%
CpG-Island: 67%
Conserved: 63%
Enriched Motifs & Matches
Match Detail: [Jaspar]
|
| ||
|---|---|---|
| Sites: 72/100 | e-val: 0 | ||
| Factor | e-val(match) | DB |
| SP1 | 0.0000000038317 | JASPAR |
| Klf4 | 0.00000015518 | JASPAR |
| TFAP2A | 0.00002887 | JASPAR |
| PLAG1 | 0.0019451 | JASPAR |
| Zfx | 0.0052366 | JASPAR |
|
| ||
| Sites: 60/100 | e-val: 3.5e-17 | ||
| Factor | e-val(match) | DB |
| SP1 | 0.000000000031721 | JASPAR |
| Klf4 | 0.000042203 | JASPAR |
| Egr1 | 0.00051269 | JASPAR |
| INSM1 | 0.0045951 | JASPAR |
| CTCF | 0.00779 | JASPAR |
|
| ||
| Sites: 46/100 | e-val: 0.16 | ||
| Factor | e-val(match) | DB |
| Klf4 | 0.000000000021103 | JASPAR |
| SP1 | 0.00000002042 | JASPAR |
| Zfx | 0.0019483 | JASPAR |
| TFAP2A | 0.0020593 | JASPAR |
| Egr1 | 0.0025744 | JASPAR |
BED file downloads
Top 10 Example Regions
| Location | Gene Link | Dist. |
|---|---|---|
| chr12: 7125780-7125930 | SCARNA12 | 18.44 |
| chr12: 7125780-7125930 | C1R | 18.44 |
| chr12: 7125780-7125930 | C1S | 18.44 |
| chr12: 7125780-7125930 | PHB2 | 18.44 |
| chr1: 147400380-147400530 | RP11-314N2.2 | 40.8 |
| chr5: 115910500-115910650 | SEMA6A | 48.28 |
| chr9: 130981100-130981250 | TRUB2 | 49.82 |
| chr9: 130981100-130981250 | DNM1 | 49.82 |
| chr9: 130981100-130981250 | PTGES2 | 49.82 |
| chr9: 131486540-131486690 | ZDHHC12 | 50.11 |