Gene: SUGT1P3
chr13: 41482294-41495847Expression Profile
(log scale)
Graphical Connections
Distribution of linked clusters:
You may find it interesting if many of the connected DHS sites belong to the same cluster.| Cluster Profile | Cluster ID | Number of DHS sites in this cluster |
|---|---|---|
 | 2110 | 11 |
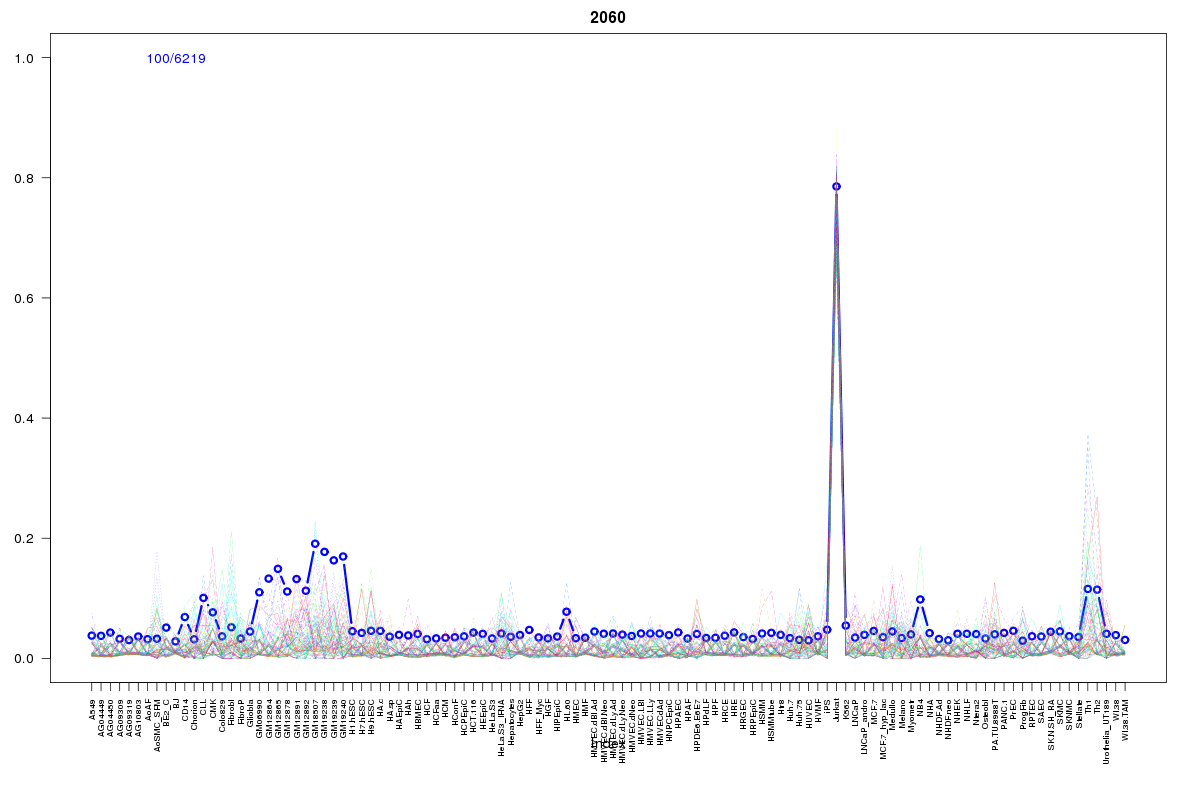 | 2060 | 4 |
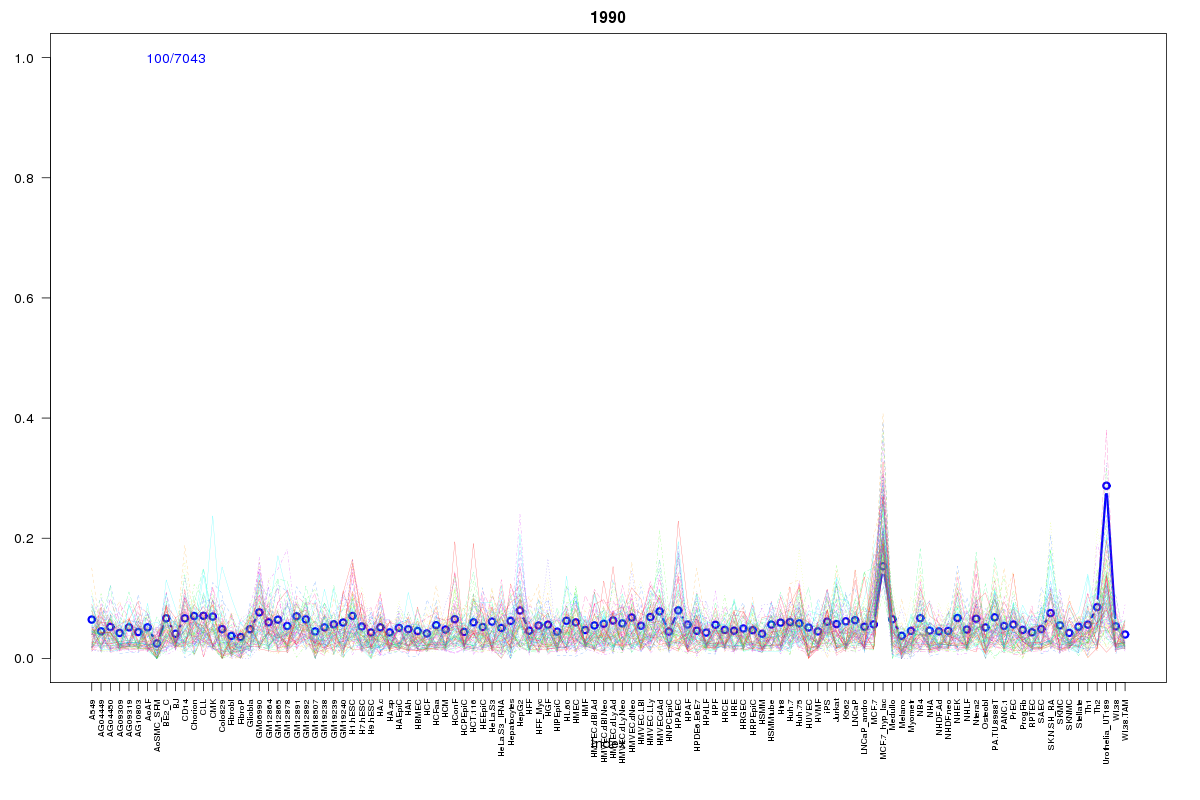 | 1990 | 1 |
 | 2114 | 1 |
 | 2072 | 1 |
Resources
BED file downloads
Connects to 18 DHS sitesTop 10 Correlated DHS Sites
p-values indiciate significant higher or lower correlation| Location | Cluster | P-value |
|---|---|---|
| chr13:41389660-41389810 | 2110 | 0.001 |
| chr13:41461920-41462070 | 2110 | 0.005 |
| chr13:41583480-41583630 | 2110 | 0.007 |
| chr13:41454160-41454310 | 2110 | 0.007 |
| chr13:41415200-41415350 | 2060 | 0.007 |
| chr13:41453920-41454070 | 2110 | 0.009 |
| chr13:41403500-41403650 | 2110 | 0.01 |
| chr13:41580100-41580250 | 2110 | 0.015 |
| chr13:41578560-41578710 | 2072 | 0.018 |
| chr13:41554740-41554890 | 2060 | 0.018 |
| chr13:41589820-41589970 | 2110 | 0.018 |
External Databases
UCSCEnsembl (ENSG00000239827)