Gene: HBBP1
chr11: 5263183-5264496Expression Profile
(log scale)
Graphical Connections
Distribution of linked clusters:
You may find it interesting if many of the connected DHS sites belong to the same cluster.| Cluster Profile | Cluster ID | Number of DHS sites in this cluster |
|---|---|---|
 | 615 | 32 |
 | 1963 | 18 |
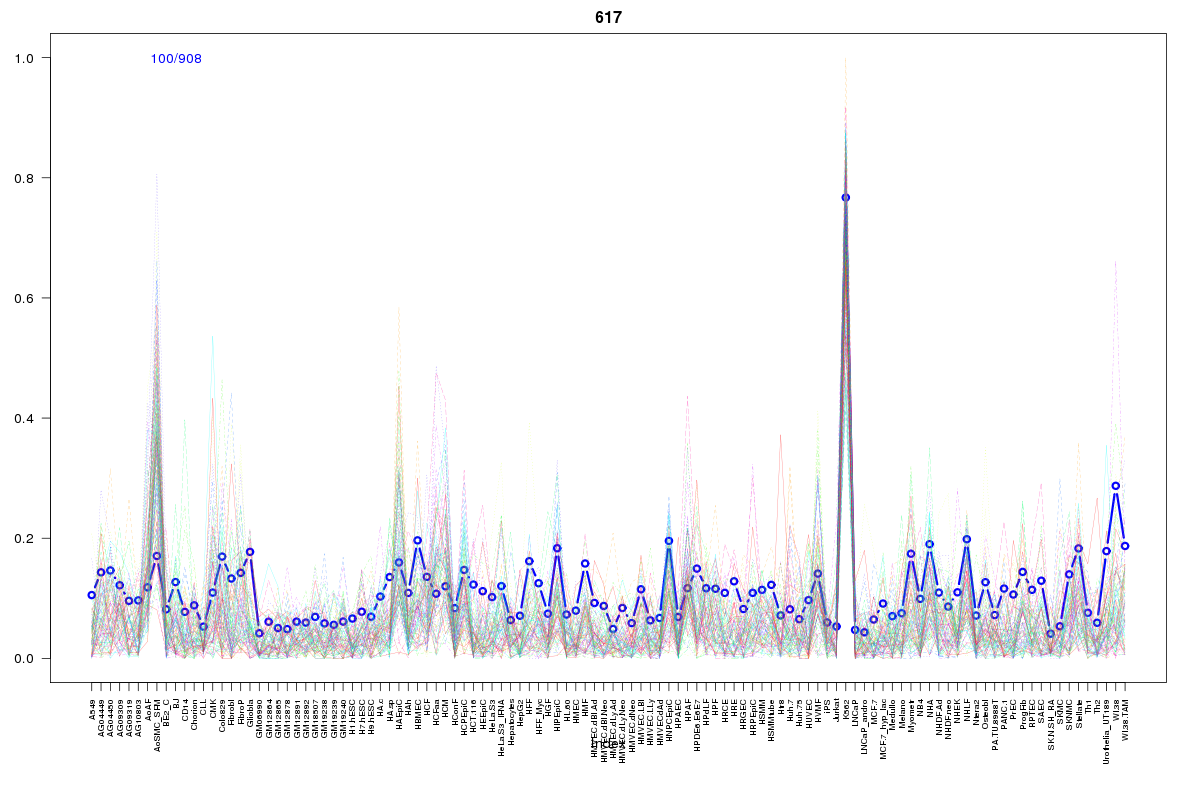 | 617 | 4 |
 | 1605 | 3 |
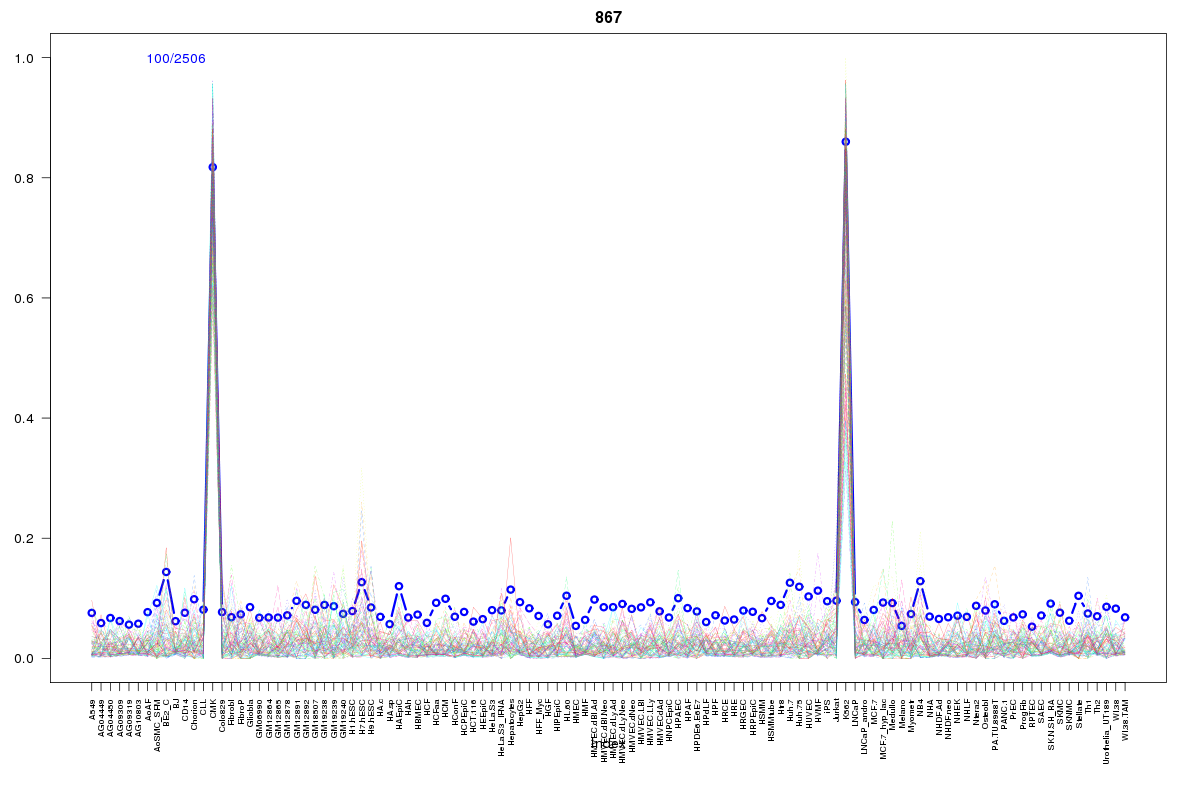 | 867 | 3 |
 | 568 | 3 |
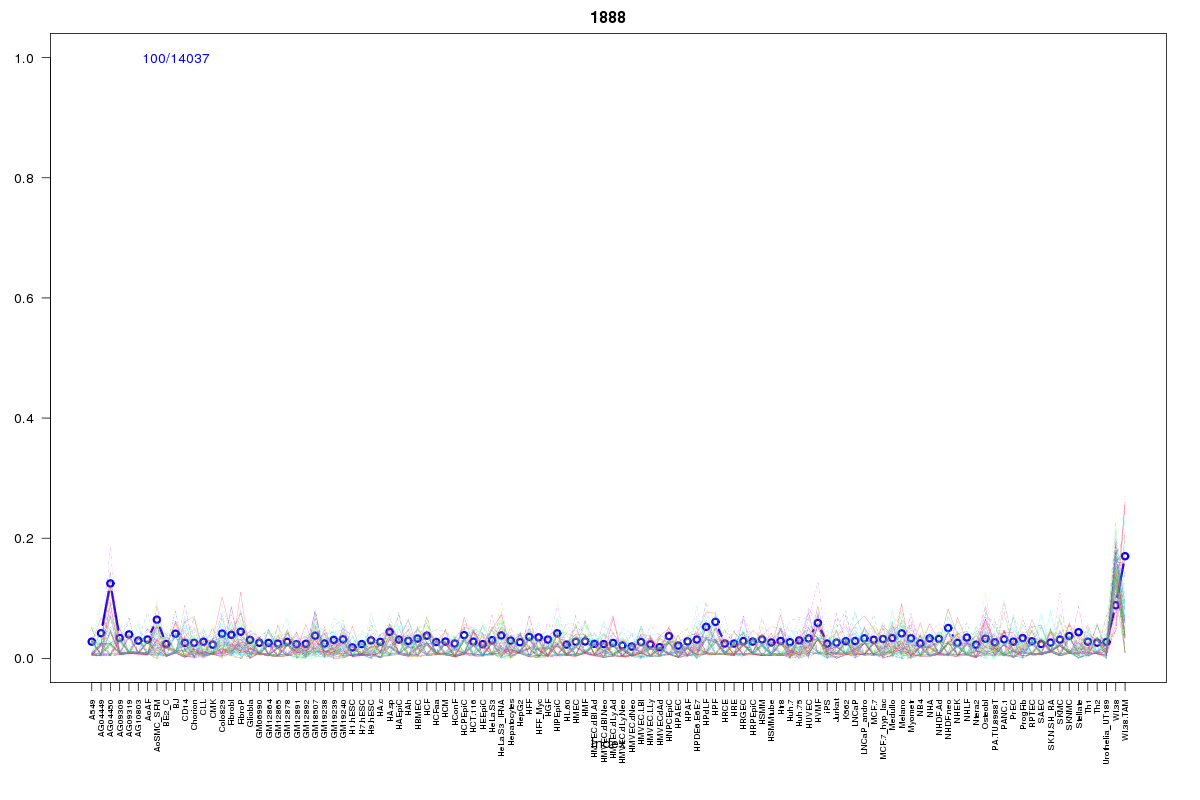 | 1888 | 3 |
 | 860 | 2 |
 | 1721 | 2 |
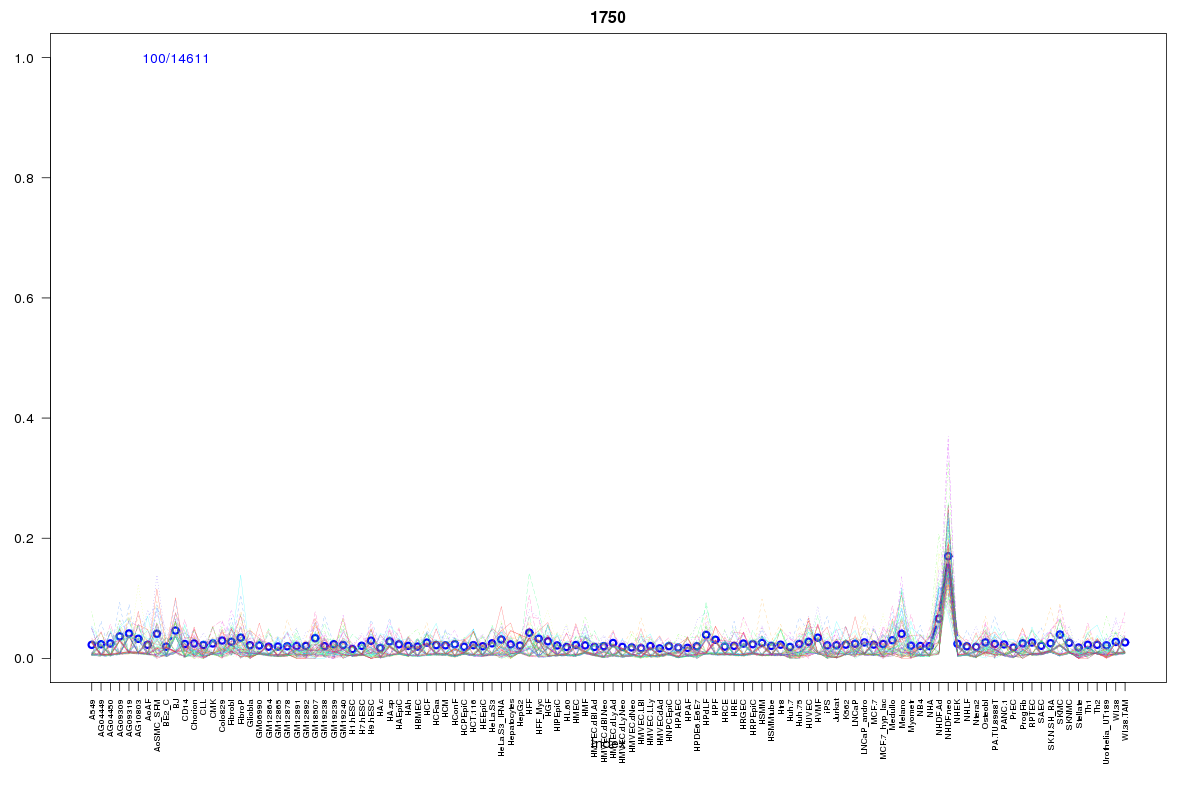 | 1750 | 1 |
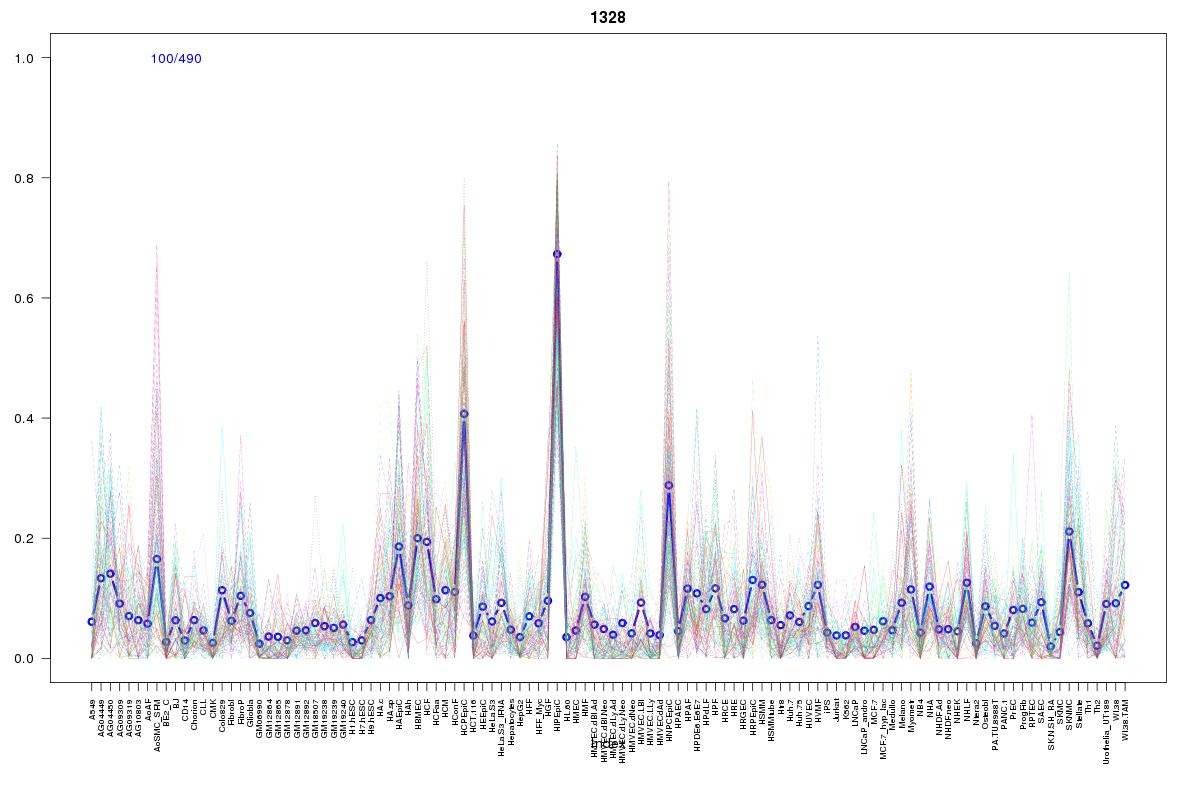 | 1328 | 1 |
 | 2186 | 1 |
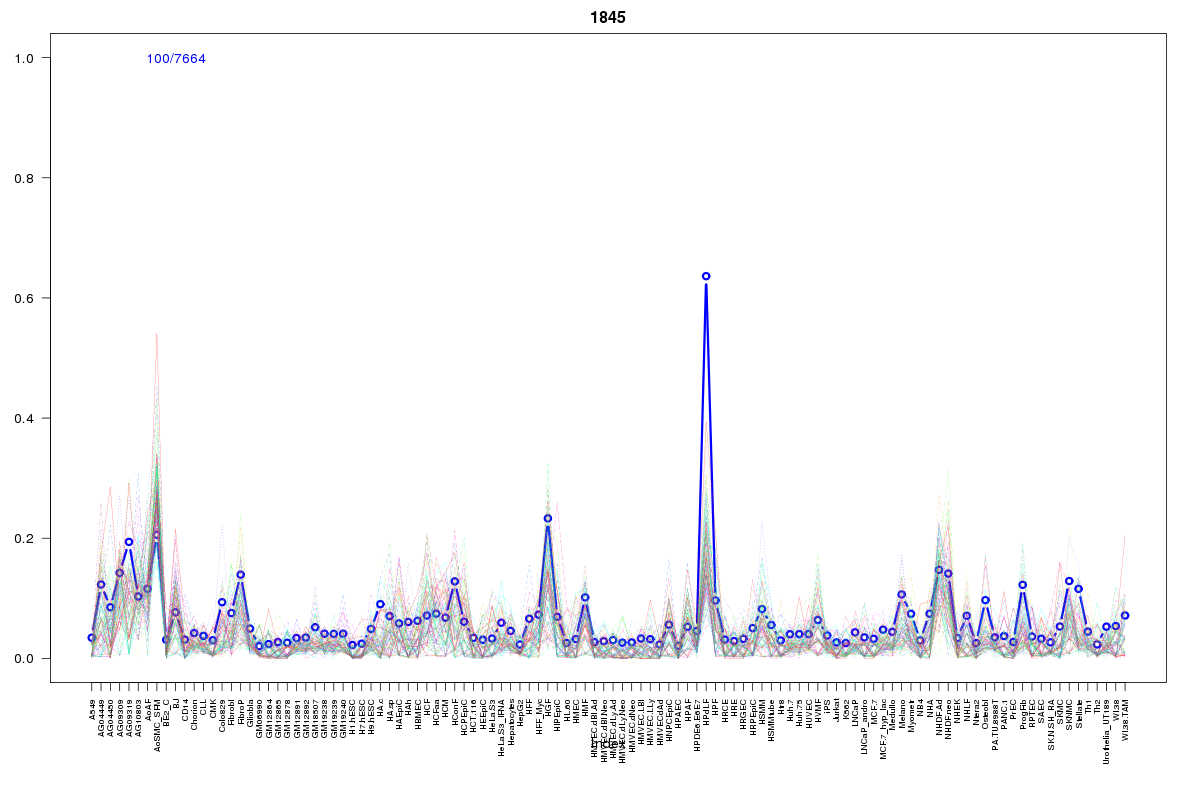 | 1845 | 1 |
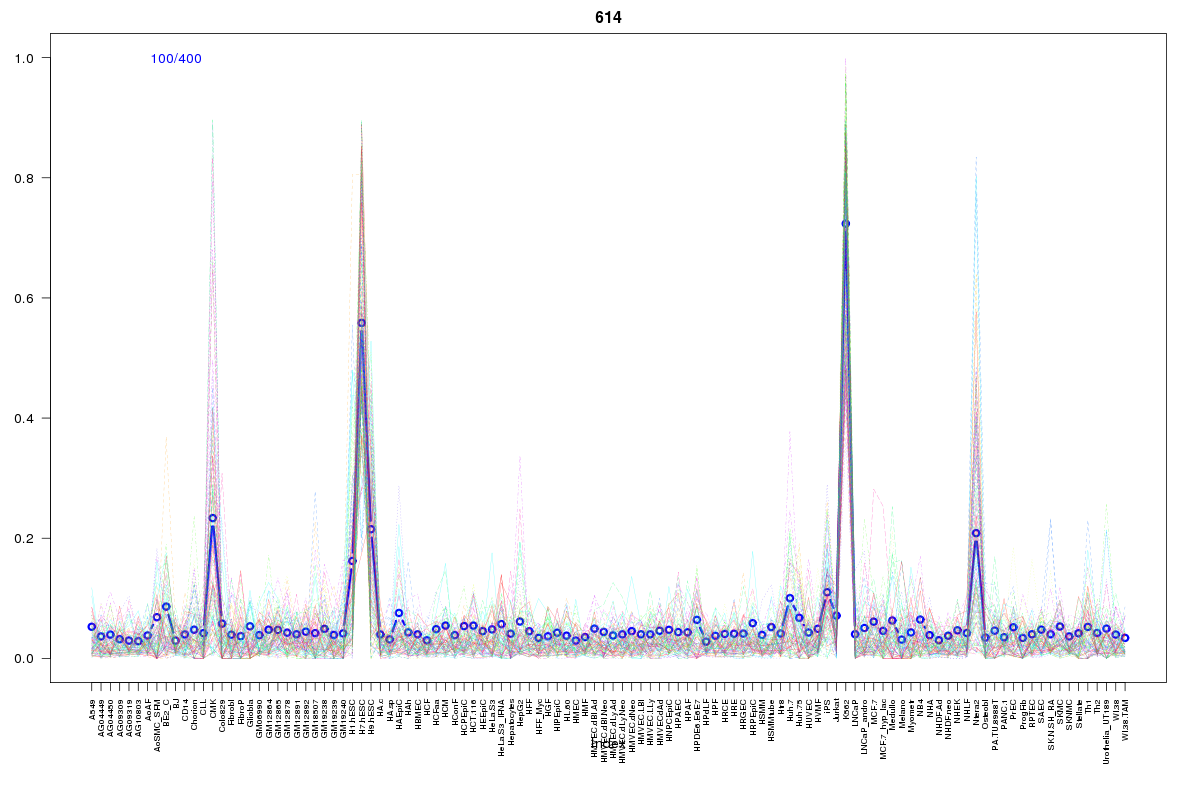 | 614 | 1 |
 | 2211 | 1 |
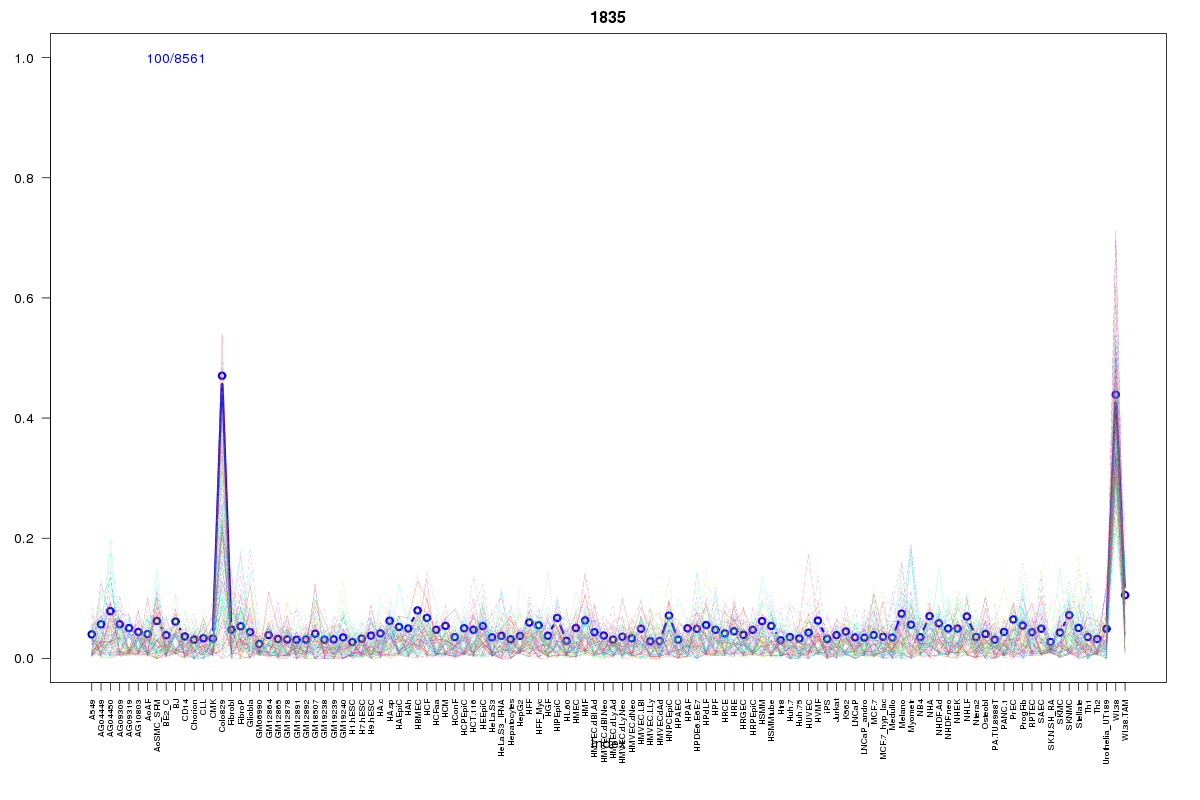 | 1835 | 1 |
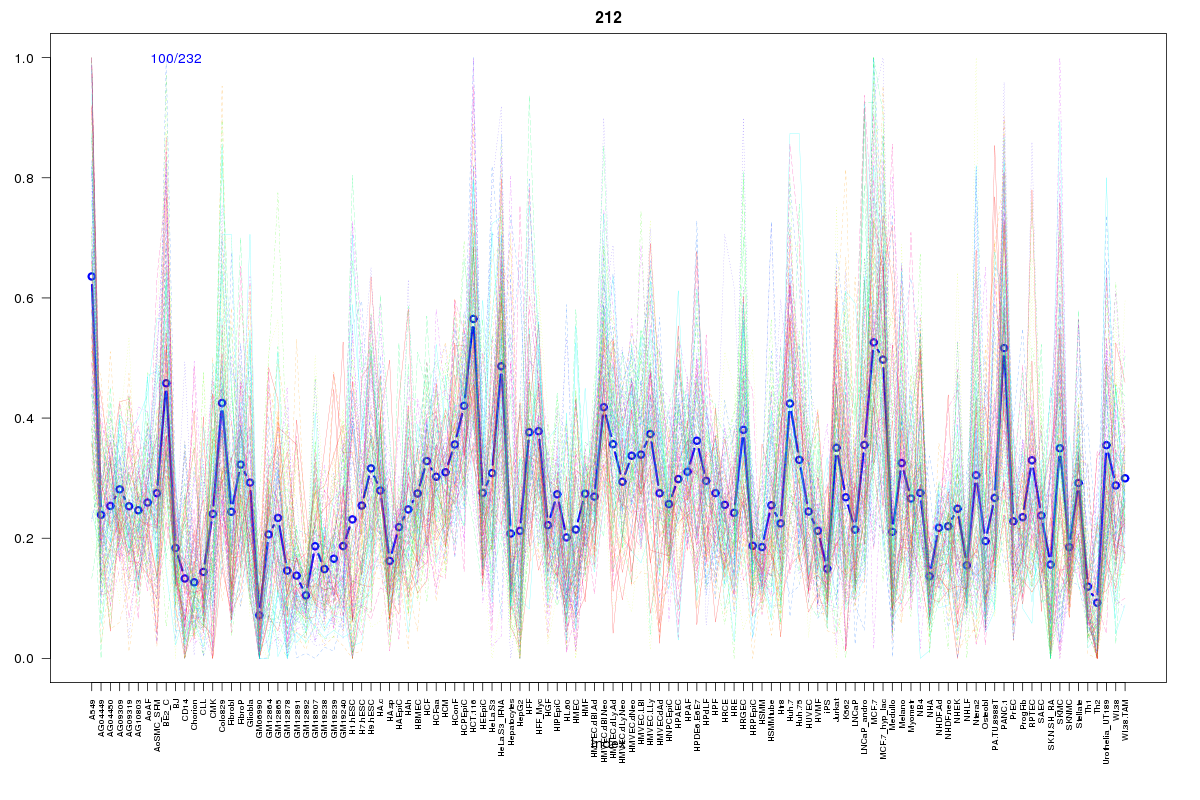 | 212 | 1 |
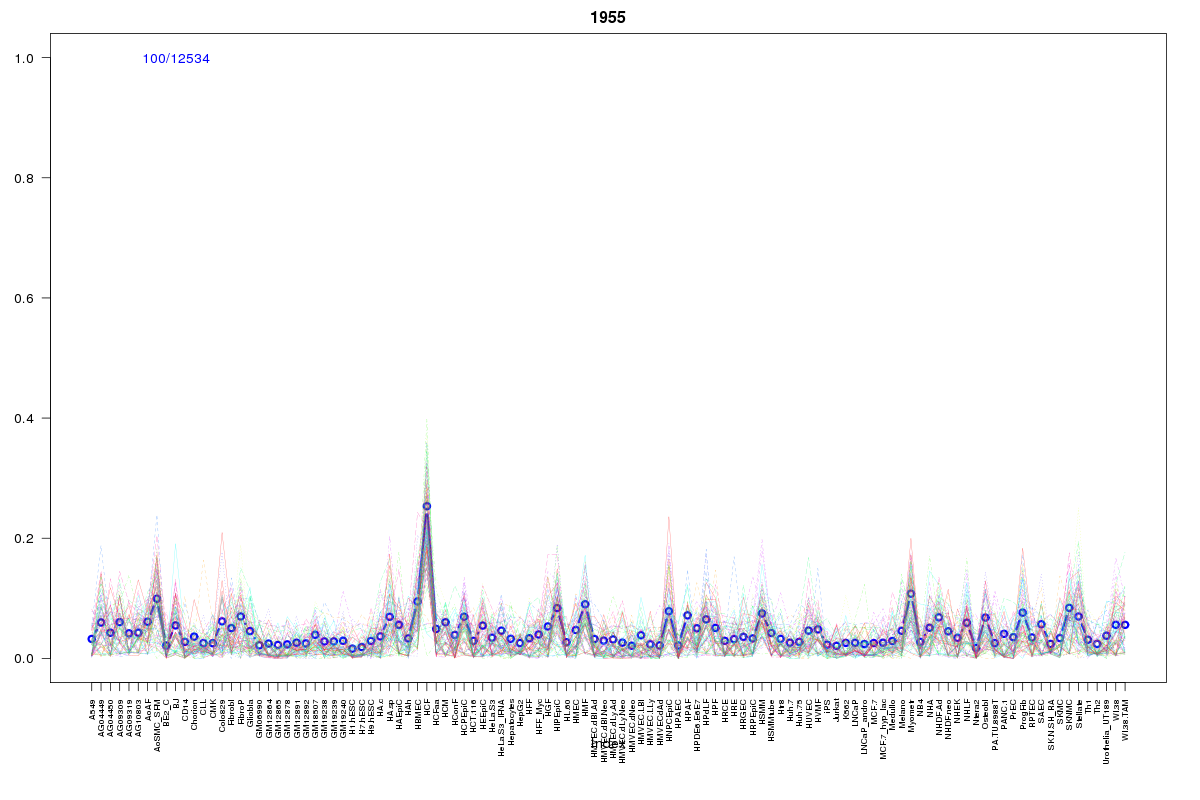 | 1955 | 1 |
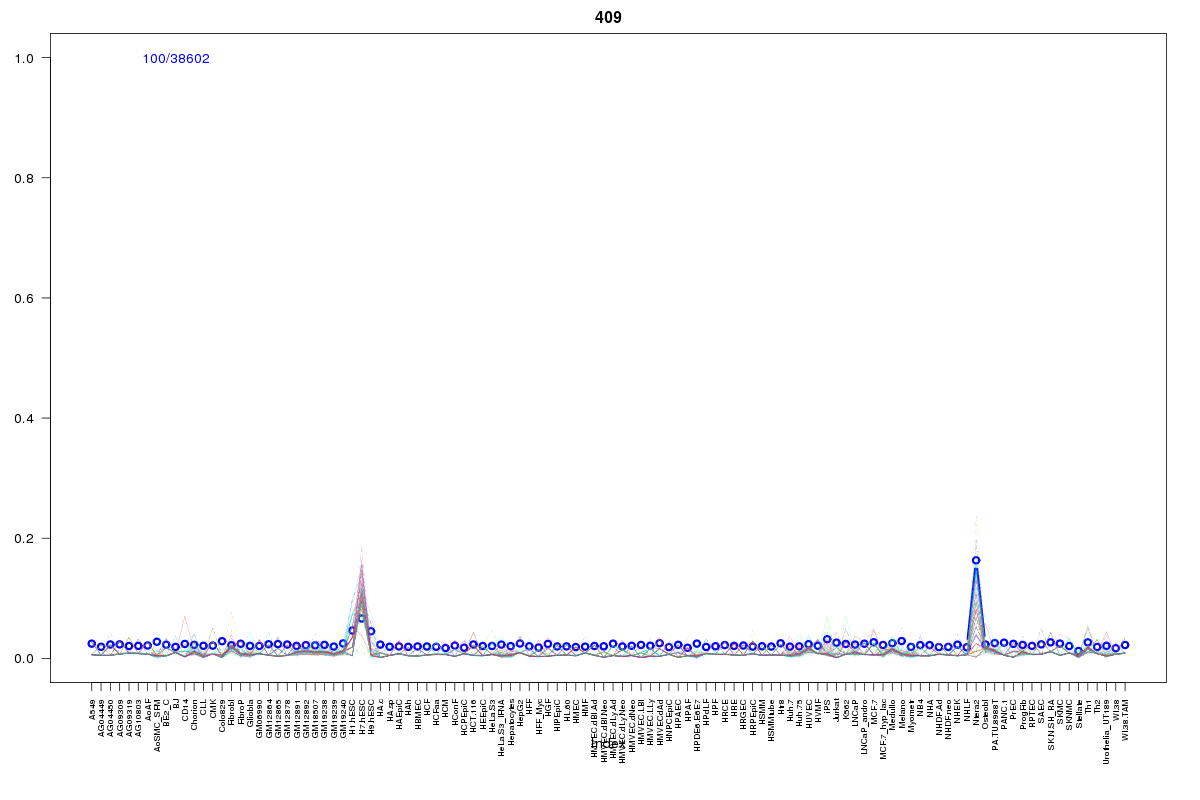 | 409 | 1 |
Resources
BED file downloads
Connects to 80 DHS sitesTop 10 Correlated DHS Sites
p-values indiciate significant higher or lower correlation| Location | Cluster | P-value |
|---|---|---|
| chr11:5245840-5245990 | 1963 | 0 |
| chr11:5275485-5275635 | 615 | 0 |
| chr11:5273640-5273790 | 1963 | 0 |
| chr11:5257620-5257770 | 615 | 0.001 |
| chr11:5359480-5359630 | 615 | 0.001 |
| chr11:5187480-5187630 | 615 | 0.001 |
| chr11:5273200-5273350 | 1963 | 0.001 |
| chr11:5182160-5182310 | 615 | 0.001 |
| chr11:5293960-5294110 | 615 | 0.001 |
| chr11:5264845-5264995 | 1963 | 0.001 |
| chr11:5177220-5177370 | 1605 | 0.001 |
External Databases
UCSCEnsembl (ENSG00000229988)