SOM cluster: 1888
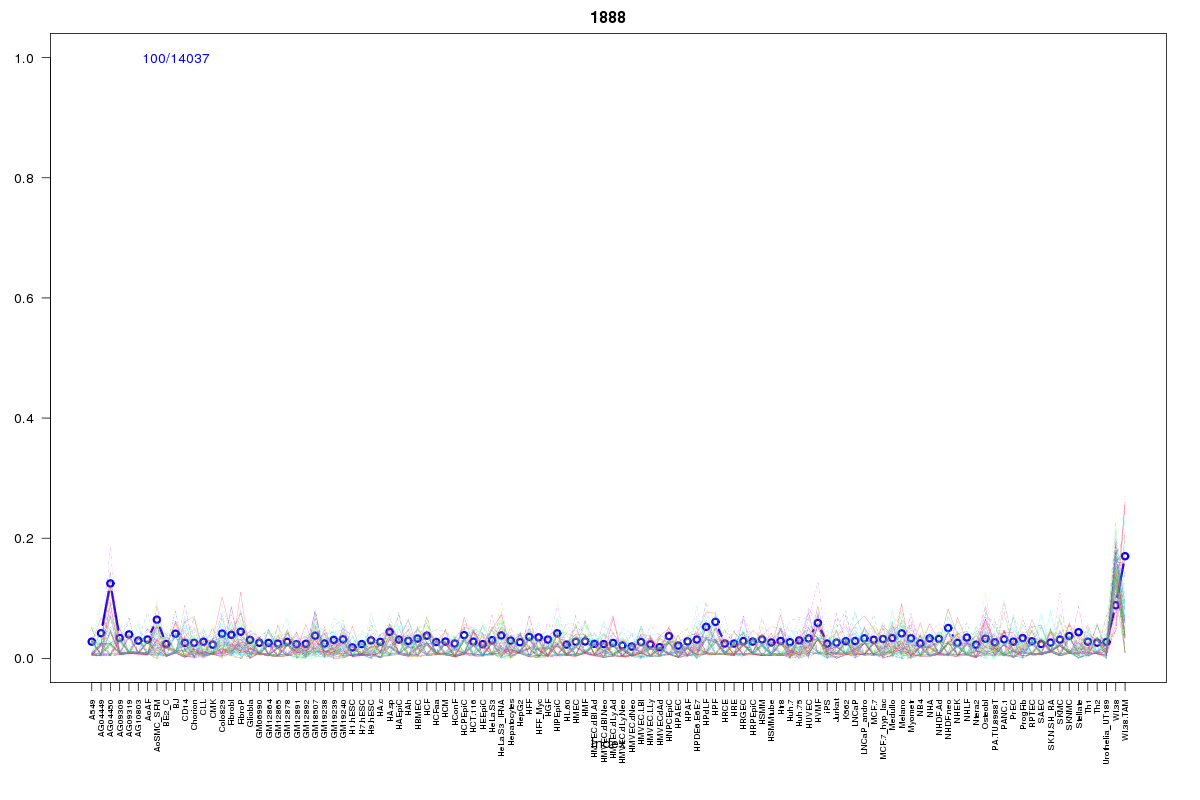
Cluster Hypersensitivity Profile

Genomic Location Trend
These plots show the distribution of the DHS sites surrounding the Transcript Start Site of the nearest gene.
Stats
Number of sites: 14037Promoter: 0%
CpG-Island: 0%
Conserved: 15%
Enriched Motifs & Matches
Match Detail: [Jaspar]
|
| ||
|---|---|---|
| Sites: 38/100 | e-val: 0.000038 | ||
| Factor | e-val(match) | DB |
| Foxa2 | 0.0000017878 | JASPAR |
| Foxq1 | 0.000014991 | JASPAR |
| Foxd3 | 0.00001756 | JASPAR |
| Lhx3 | 0.000030078 | JASPAR |
| FOXI1 | 0.00003212 | JASPAR |
BED file downloads
Top 10 Example Regions
| Location | Gene Link | Dist. |
|---|---|---|
| chr8: 124003280-124003430 | DERL1 | 37.72 |
| chr8: 19556500-19556650 | RP11-1105O14.1 | 38.79 |
| chr21: 41084280-41084430 | AF064860.5 | 42.47 |
| chr7: 41724260-41724410 | INHBA | 44.4 |
| chr17: 6548740-6548890 | MED31 | 45.44 |
| chr5: 67819200-67819350 | CTC-537E7.1 | 45.9 |
| chr8: 10249245-10249395 | RNU6-729P | 46.4 |
| chr12: 27960220-27960370 | KLHL42 | 46.57 |
| chr19: 10054000-10054150 | RDH8 | 46.65 |
| chr16: 15978180-15978330 | RPL15P20 | 47.21 |