SOM cluster: 685
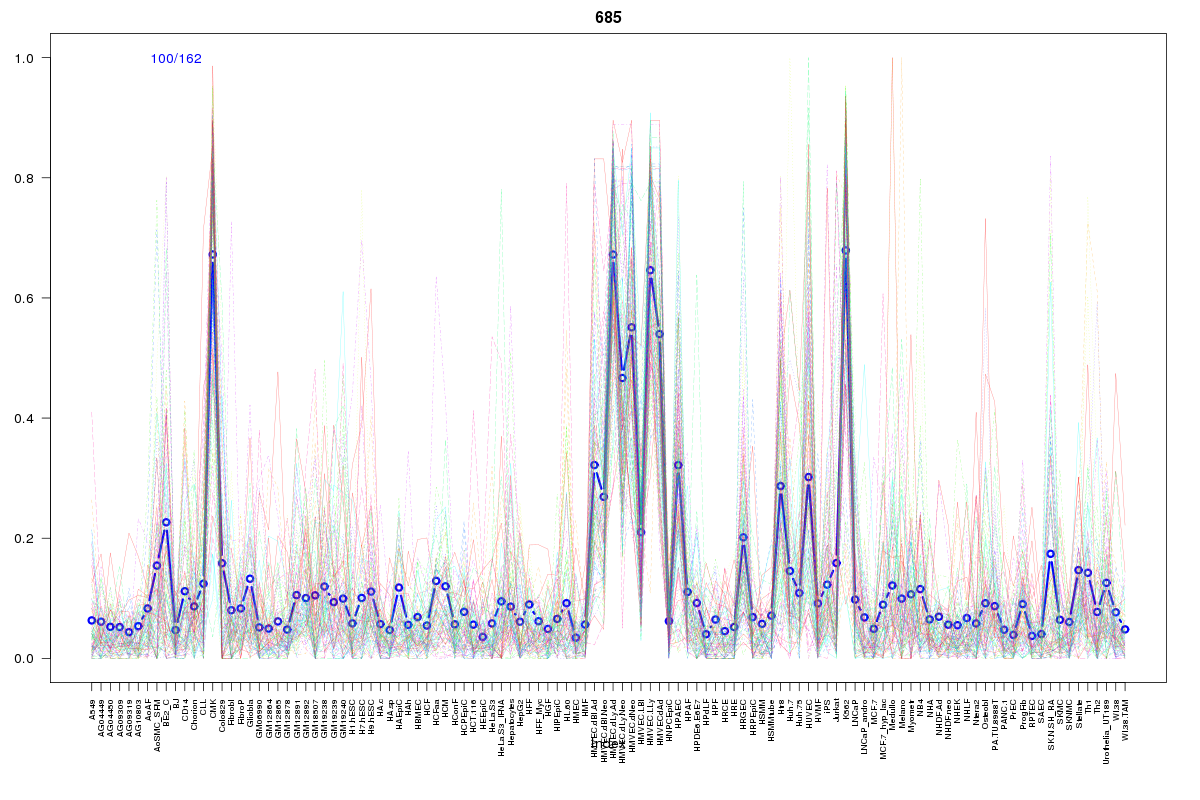
Cluster Hypersensitivity Profile

Genomic Location Trend
These plots show the distribution of the DHS sites surrounding the Transcript Start Site of the nearest gene.
Stats
Number of sites: 162Promoter: 3%
CpG-Island: 3%
Conserved: 46%
Enriched Motifs & Matches
Match Detail: [Jaspar]
|
| ||
|---|---|---|
| Sites: 22/100 | e-val: 0.00000000029 | ||
| Factor | e-val(match) | DB |
| Tal1::Gata1 | 0.00027236 | JASPAR |
| SPIB | 0.00093712 | JASPAR |
| RXR::RAR_DR5 | 0.0014182 | JASPAR |
| Sox2 | 0.0017009 | JASPAR |
| EWSR1-FLI1 | 0.002195 | JASPAR |
|
| ||
| Sites: 26/100 | e-val: 0.0006 | ||
| Factor | e-val(match) | DB |
| SP1 | 0.0000000000092576 | JASPAR |
| Klf4 | 0.000022993 | JASPAR |
| Egr1 | 0.0031924 | JASPAR |
| Pax4 | 0.010801 | JASPAR |
| RREB1 | 0.017991 | JASPAR |
|
| ||
| Sites: 19/100 | e-val: 0.0066 | ||
| Factor | e-val(match) | DB |
| FEV | 0.00000021354 | JASPAR |
| Stat3 | 0.00011163 | JASPAR |
| SPI1 | 0.00079025 | JASPAR |
| FOXD1 | 0.00084738 | JASPAR |
| Tal1::Gata1 | 0.00096908 | JASPAR |
BED file downloads
Top 10 Example Regions
| Location | Gene Link | Dist. |
|---|---|---|
| chr1: 94020520-94020670 | RNA5SP53 | 33.29 |
| chr1: 94020520-94020670 | FNBP1L | 33.29 |
| chr5: 115700720-115700870 | CTC-339F2.2 | 44.11 |
| chr12: 131714700-131714850 | GPR133 | 47.19 |
| chr9: 139557465-139557615 | FAM69B | 51.66 |
| chr9: 139557465-139557615 | EGFL7 | 51.66 |
| chr17: 43523600-43523750 | ARHGAP27 | 57.17 |
| chr1: 206554380-206554530 | SRGAP2 | 65.85 |
| chr10: 17467960-17468110 | ST8SIA6 | 71.32 |
| chr8: 74669700-74669850 | STAU2 | 71.63 |