Gene: RNA5SP53
chr1: 93953889-93954009Expression Profile
(log scale)
Graphical Connections
Distribution of linked clusters:
You may find it interesting if many of the connected DHS sites belong to the same cluster.| Cluster Profile | Cluster ID | Number of DHS sites in this cluster |
|---|---|---|
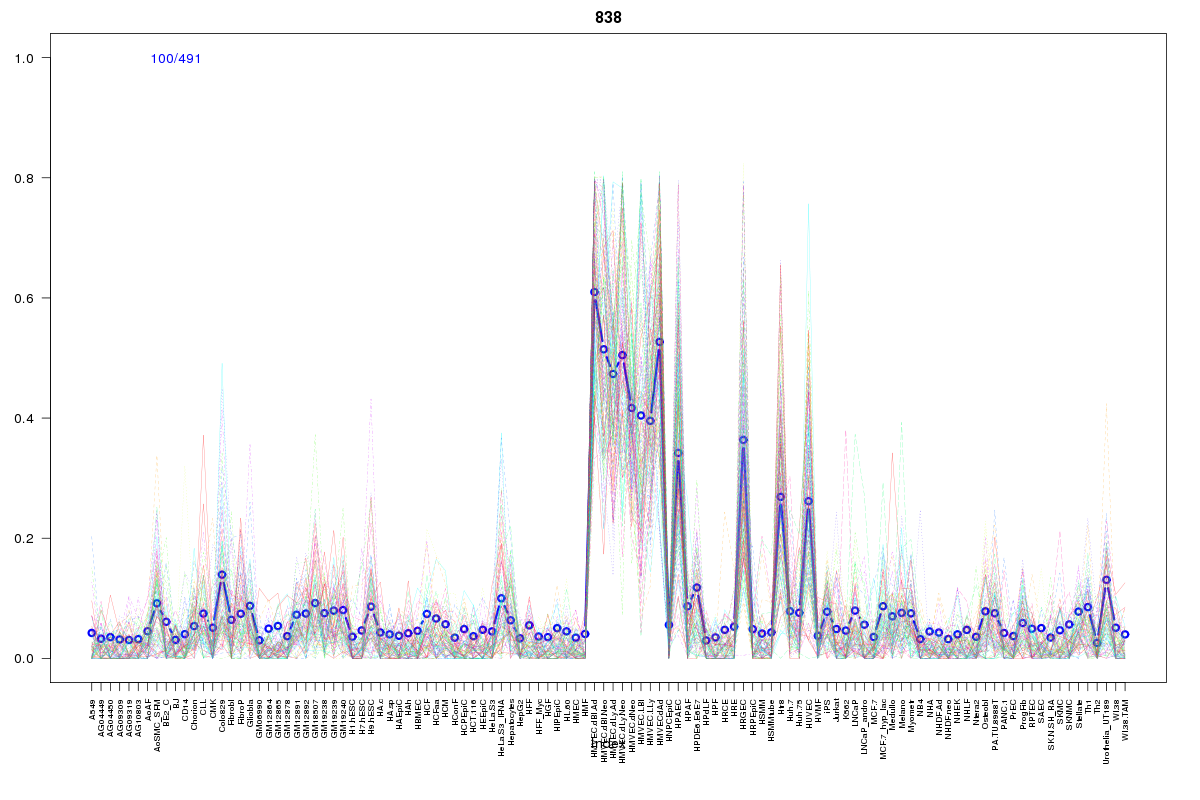 | 838 | 1 |
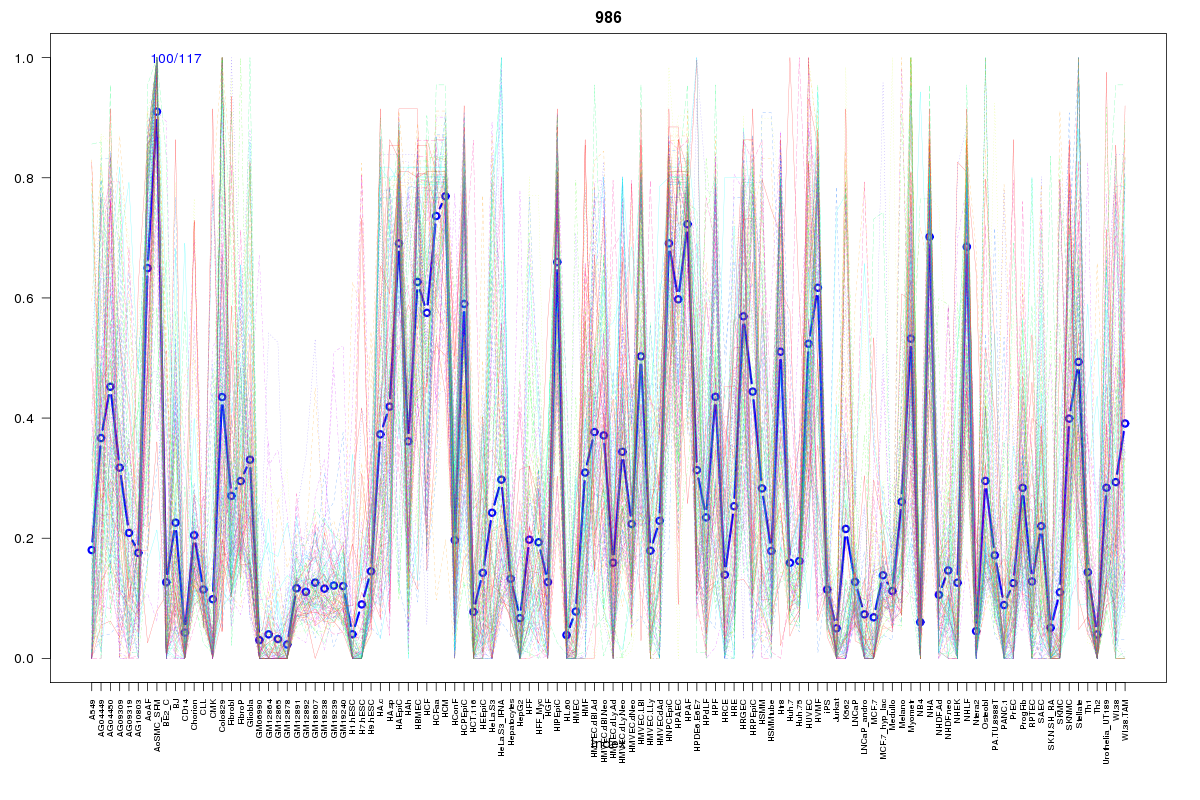 | 986 | 1 |
 | 948 | 1 |
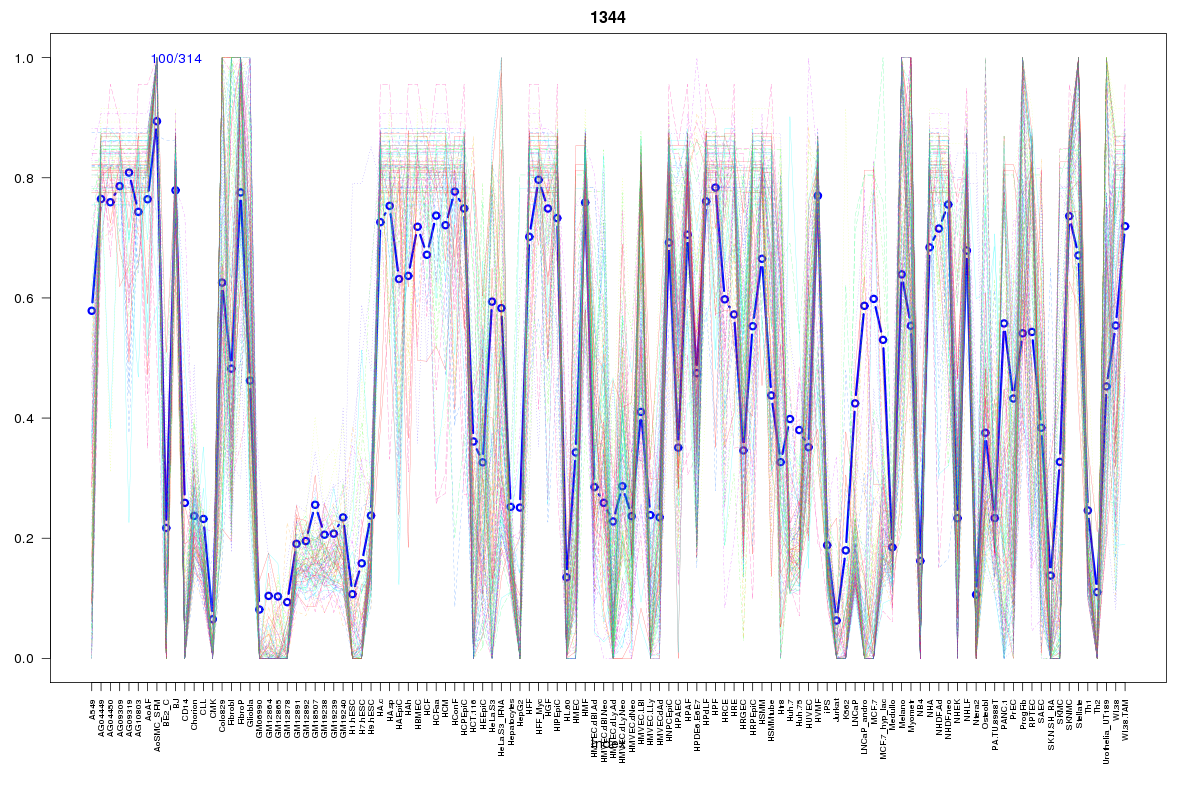 | 1344 | 1 |
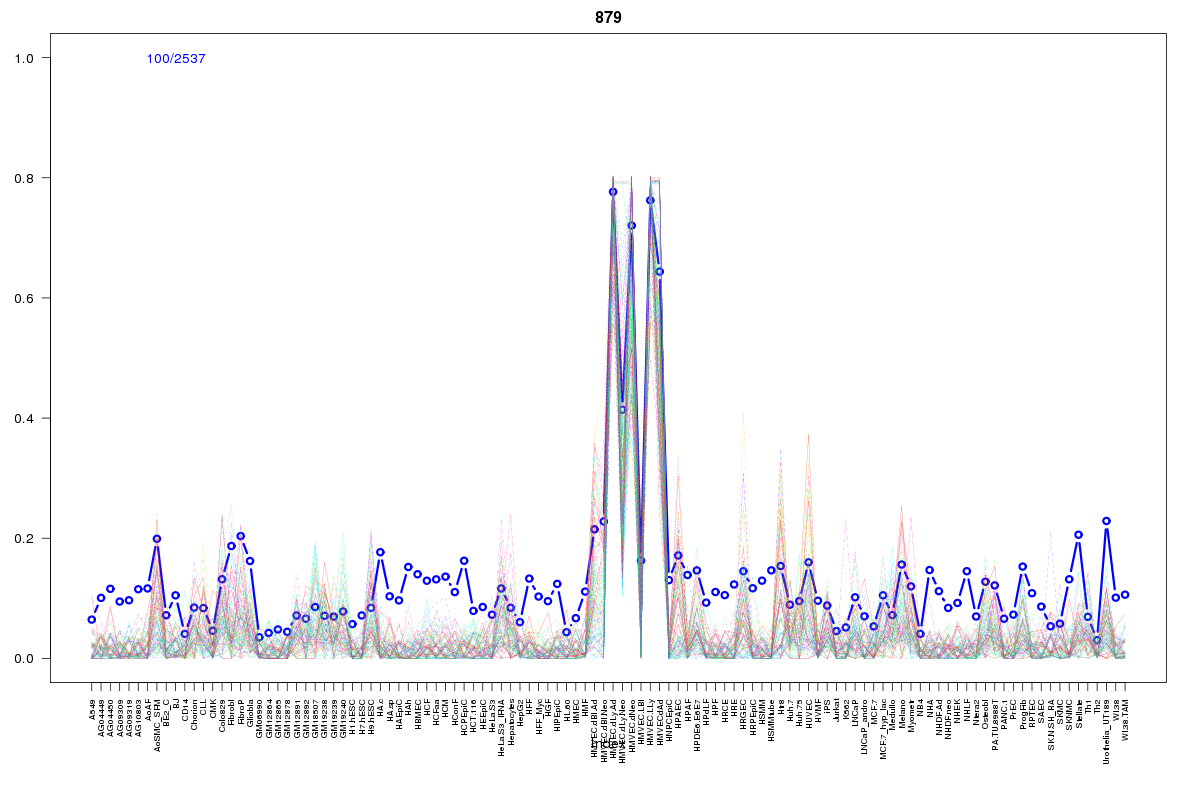 | 879 | 1 |
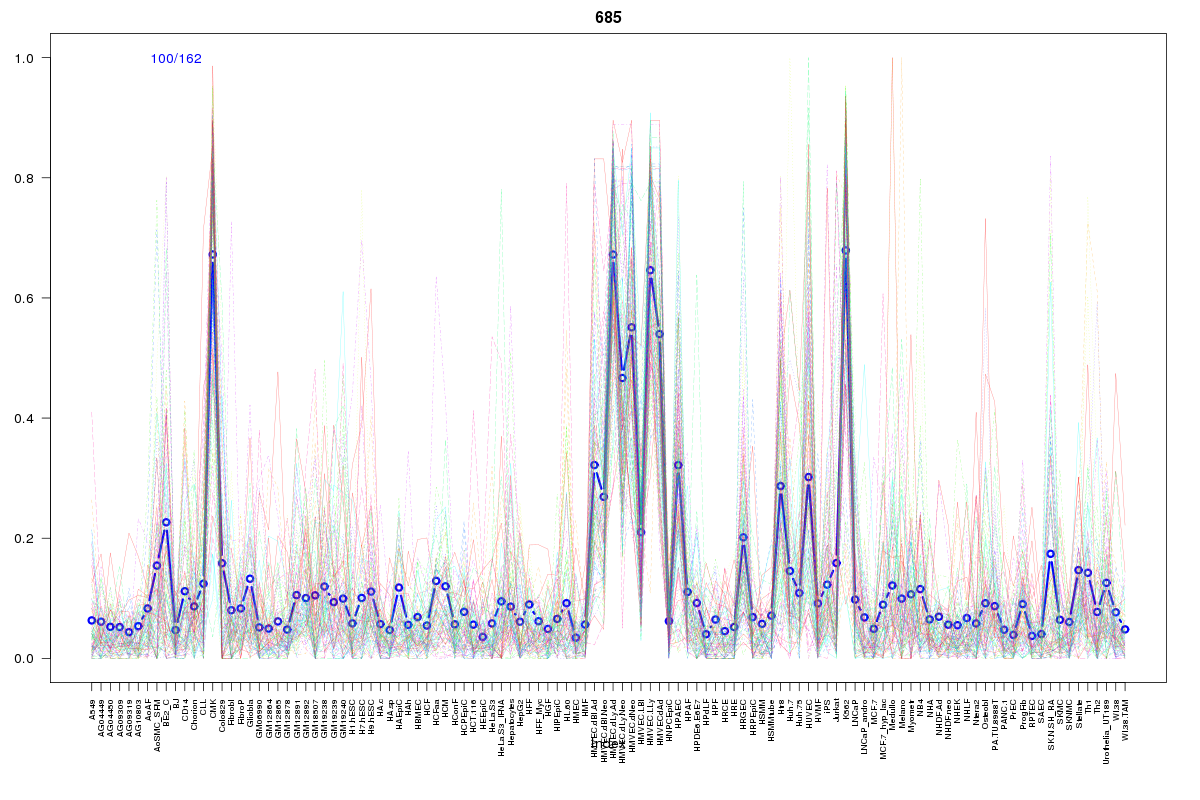 | 685 | 1 |
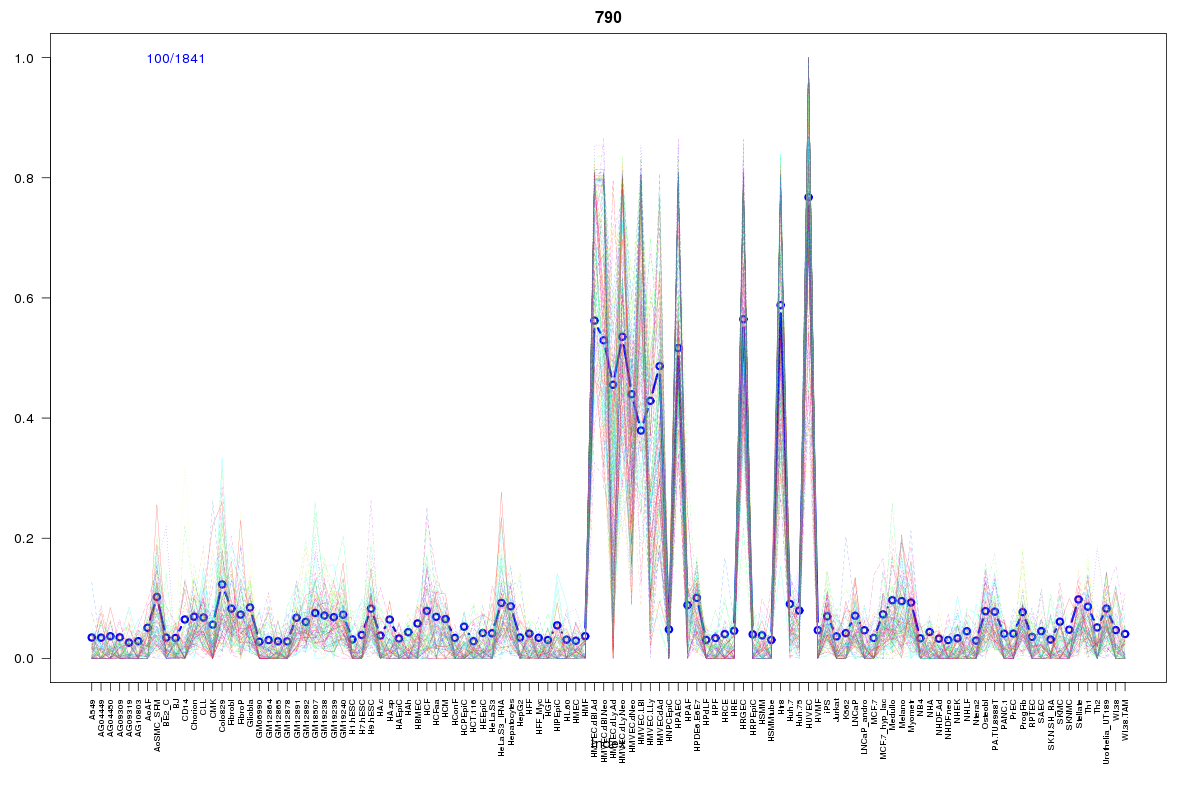 | 790 | 1 |
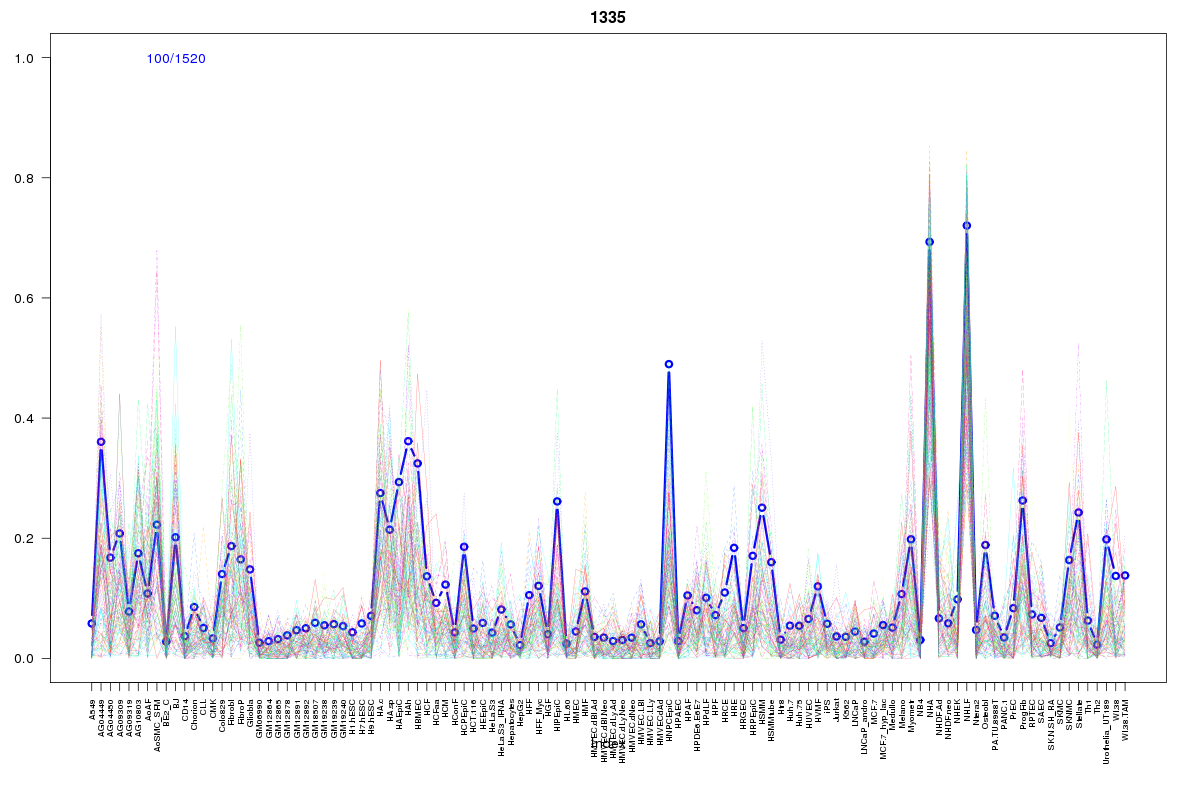 | 1335 | 1 |
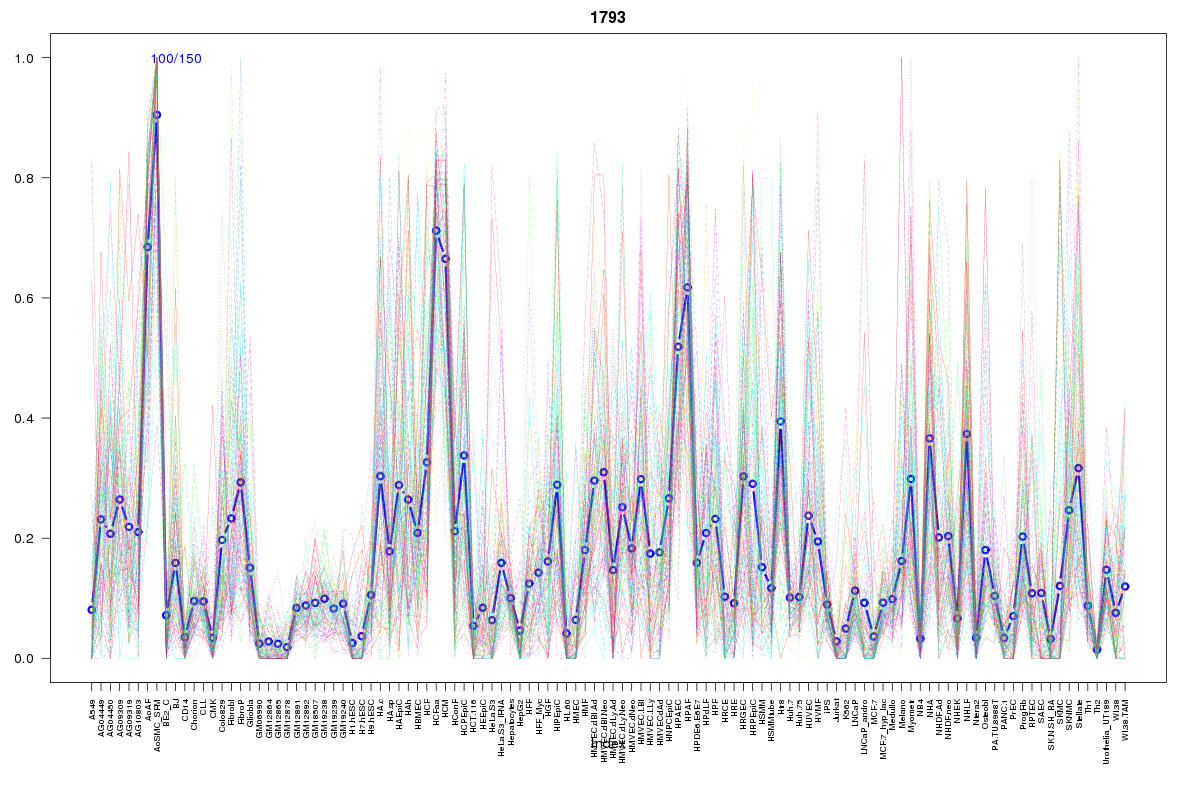 | 1793 | 1 |
Resources
BED file downloads
Connects to 9 DHS sitesTop 10 Correlated DHS Sites
p-values indiciate significant higher or lower correlation| Location | Cluster | P-value |
|---|---|---|
| chr1:94045640-94045790 | 1344 | 0.001 |
| chr1:94031345-94031495 | 1335 | 0.004 |
| chr1:94031500-94031650 | 1793 | 0.005 |
| chr1:94032960-94033110 | 986 | 0.008 |
| chr1:94033120-94033270 | 948 | 0.008 |
| chr1:94020900-94021050 | 790 | 0.017 |
| chr1:93988380-93988530 | 879 | 0.013 |
| chr1:94020520-94020670 | 685 | 0.008 |
| chr1:94031780-94031930 | 838 | 0.008 |
External Databases
UCSCEnsembl (ENSG00000212601)