SOM cluster: 636
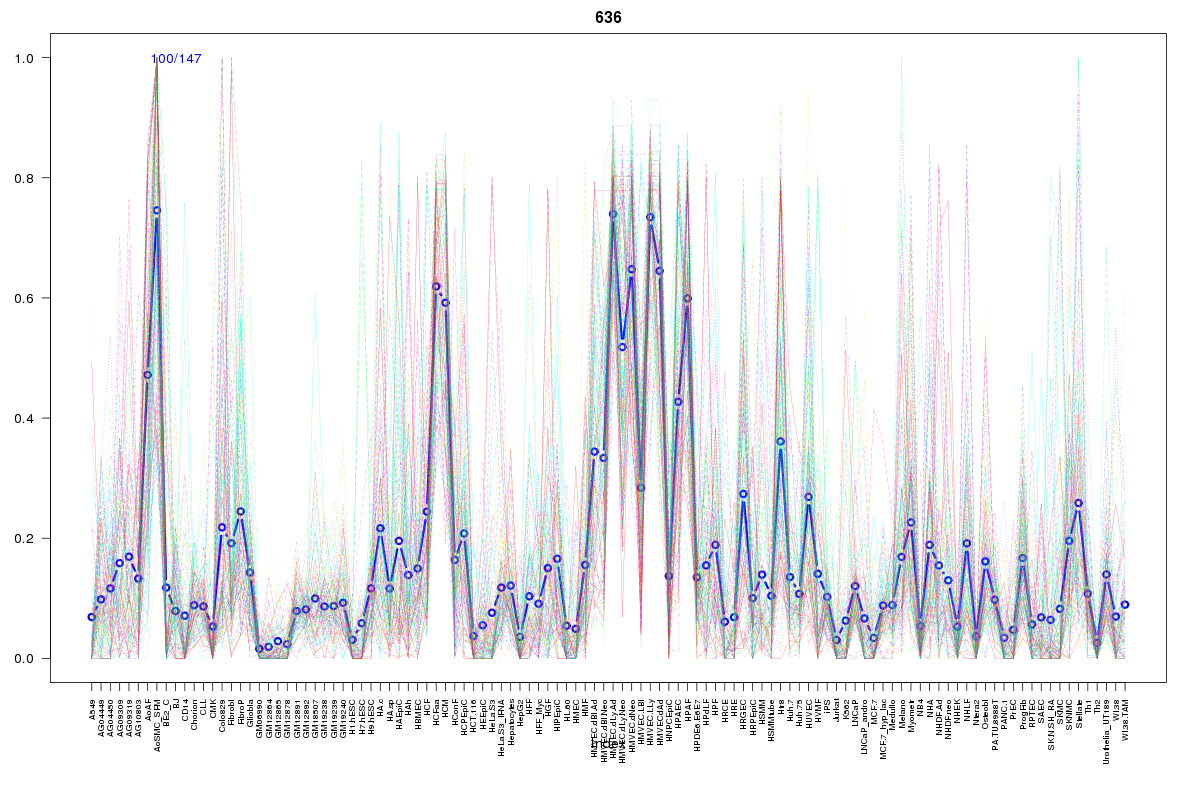
Cluster Hypersensitivity Profile

Genomic Location Trend
These plots show the distribution of the DHS sites surrounding the Transcript Start Site of the nearest gene.
Stats
Number of sites: 147Promoter: 1%
CpG-Island: 0%
Conserved: 57%
Enriched Motifs & Matches
Match Detail: [Jaspar]
|
| ||
|---|---|---|
| Sites: 25/100 | e-val: 0.0000086 | ||
| Factor | e-val(match) | DB |
| SPIB | 0.00000045783 | JASPAR |
| FEV | 0.0000027362 | JASPAR |
| SPI1 | 0.00033151 | JASPAR |
| NFATC2 | 0.00070125 | JASPAR |
| ELF5 | 0.0014974 | JASPAR |
BED file downloads
Top 10 Example Regions
| Location | Gene Link | Dist. |
|---|---|---|
| chr3: 32417660-32417810 | CMTM7 | 35.27 |
| chr1: 95272040-95272190 | CNN3 | 40.25 |
| chr1: 95272040-95272190 | RP11-465K1.2 | 40.25 |
| chr1: 94142120-94142270 | RP11-488P3.1 | 42.91 |
| chr12: 93924300-93924450 | MRPL42 | 48.01 |
| chr15: 84415980-84416130 | ADAMTSL3 | 58.51 |
| chr5: 73085940-73086090 | ARHGEF28 | 58.64 |
| chr3: 29566705-29566855 | RBMS3 | 62.32 |
| chr3: 44965660-44965810 | EXOSC7 | 70.96 |
| chr3: 44965660-44965810 | KIF15 | 70.96 |