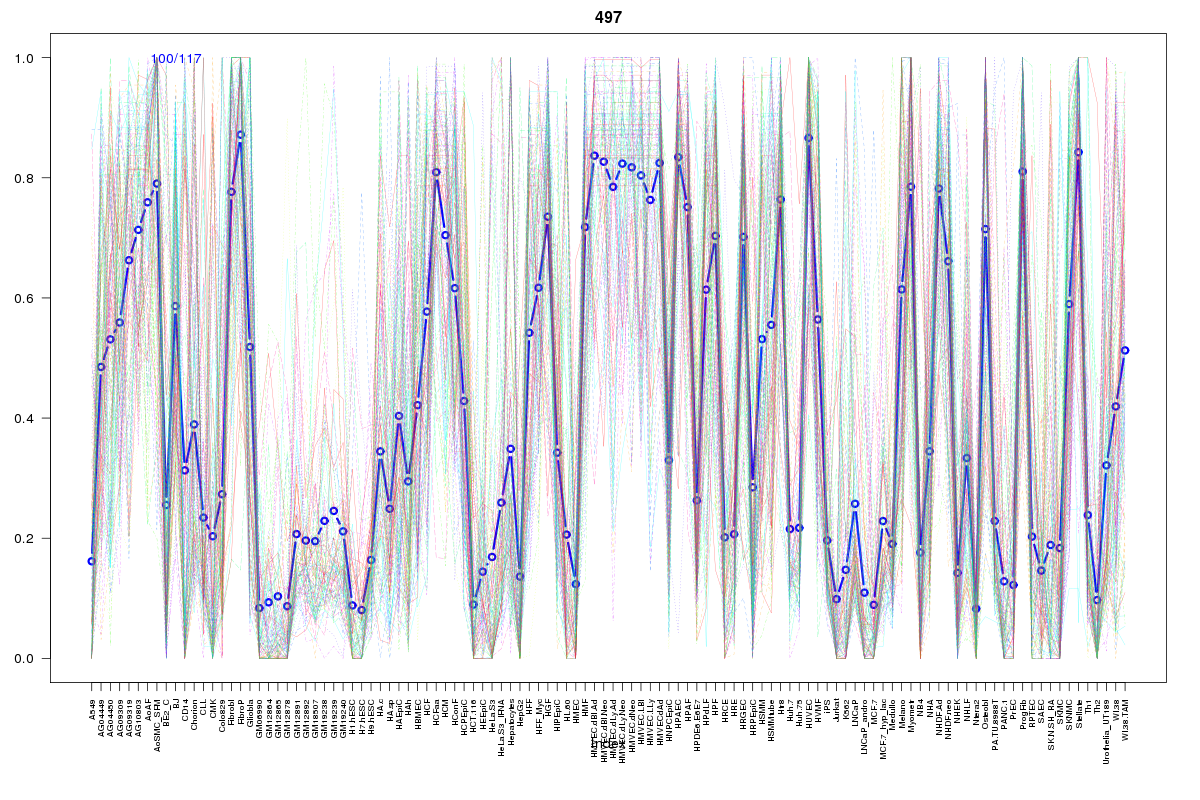
SOM cluster: 497
Cluster Hypersensitivity Profile

Genomic Location Trend
These plots show the distribution of the DHS sites surrounding the Transcript Start Site of the nearest gene.
Stats
Number of sites: 117Promoter: 14%
CpG-Island: 8%
Conserved: 66%
Enriched Motifs & Matches
Match Detail: [Jaspar]
|
| ||
|---|---|---|
| Sites: 68/100 | e-val: 0.0000000038 | ||
| Factor | e-val(match) | DB |
| FEV | 0.000000012943 | JASPAR |
| Stat3 | 0.00000030658 | JASPAR |
| ELK4 | 0.00000031284 | JASPAR |
| SPIB | 0.0000012803 | JASPAR |
| SPI1 | 0.000003719 | JASPAR |
|
| ||
| Sites: 27/100 | e-val: 0.000000008 | ||
| Factor | e-val(match) | DB |
| SP1 | 0.00000046757 | JASPAR |
| Klf4 | 0.000030071 | JASPAR |
| EWSR1-FLI1 | 0.00015077 | JASPAR |
| Pax4 | 0.0010466 | JASPAR |
| MZF1_1-4 | 0.0028419 | JASPAR |
BED file downloads
Top 10 Example Regions
| Location | Gene Link | Dist. |
|---|---|---|
| chr10: 31986880-31987030 | RP11-472N13.3 | 37.4 |
| chr10: 121130580-121130730 | GRK5 | 54.81 |
| chr10: 121130580-121130730 | RP11-79M19.2 | 54.81 |
| chr11: 116969760-116969910 | SIDT2 | 64.7 |
| chr1: 161168840-161168990 | APOA2 | 64.83 |
| chr1: 161168840-161168990 | PPOX | 64.83 |
| chr1: 161168840-161168990 | ADAMTS4 | 64.83 |
| chr1: 161168840-161168990 | TOMM40L | 64.83 |
| chr1: 161168840-161168990 | PFDN2 | 64.83 |
| chr1: 161168840-161168990 | NDUFS2 | 64.83 |