Gene: APOA2
chr1: 161192081-161193421Expression Profile
(log scale)
Graphical Connections
Distribution of linked clusters:
You may find it interesting if many of the connected DHS sites belong to the same cluster.| Cluster Profile | Cluster ID | Number of DHS sites in this cluster |
|---|---|---|
 | 1355 | 5 |
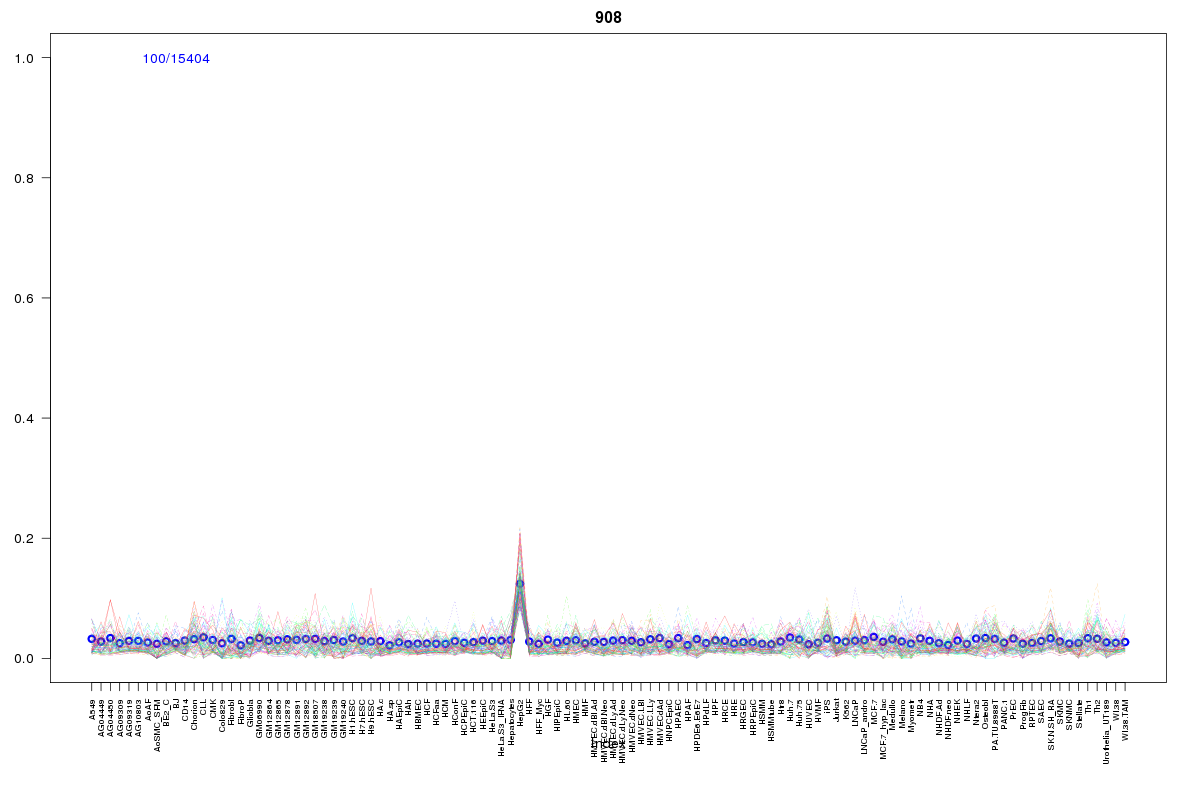 | 908 | 2 |
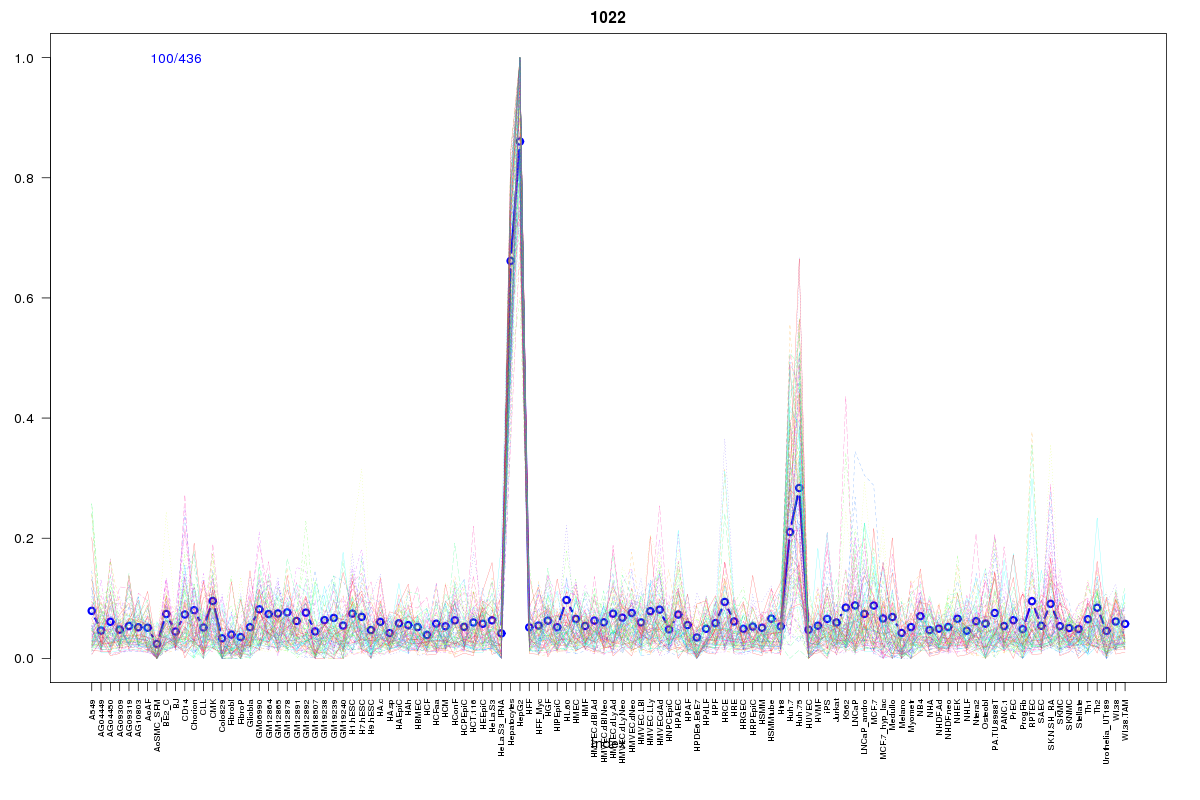 | 1022 | 2 |
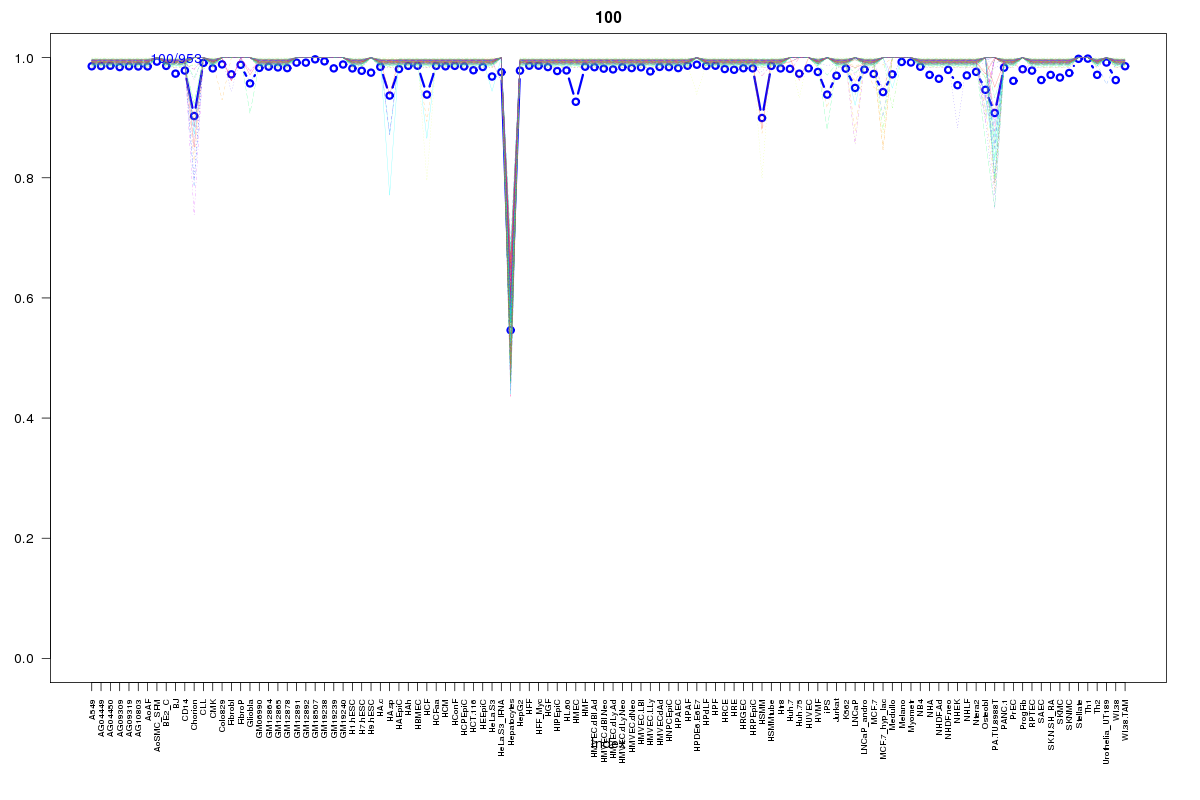 | 100 | 2 |
 | 860 | 1 |
 | 2059 | 1 |
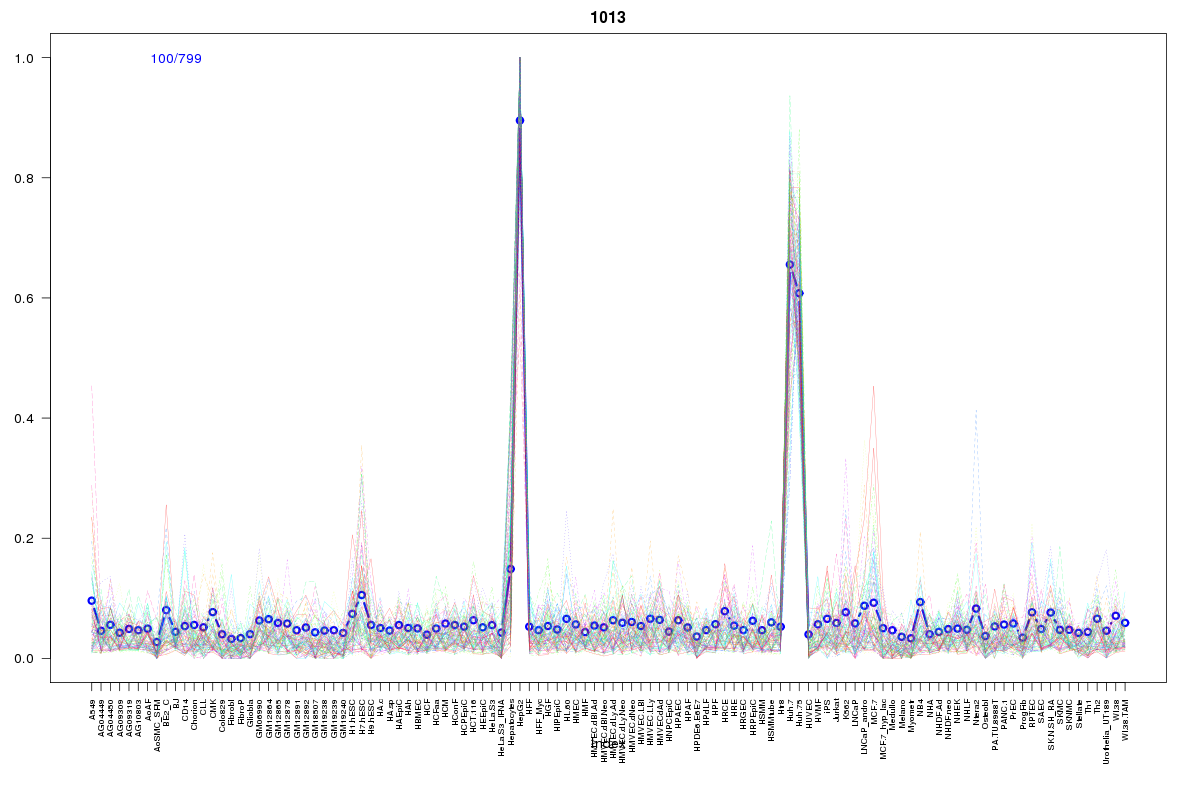 | 1013 | 1 |
 | 927 | 1 |
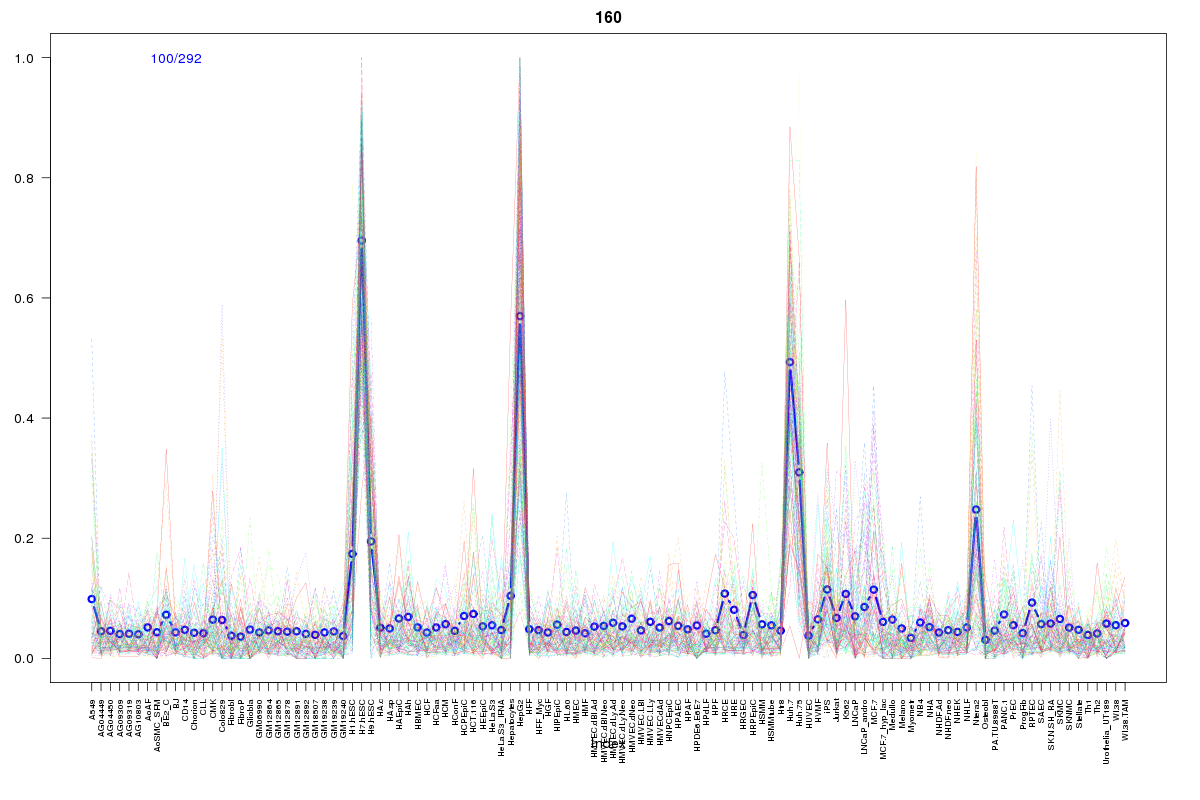 | 160 | 1 |
 | 2075 | 1 |
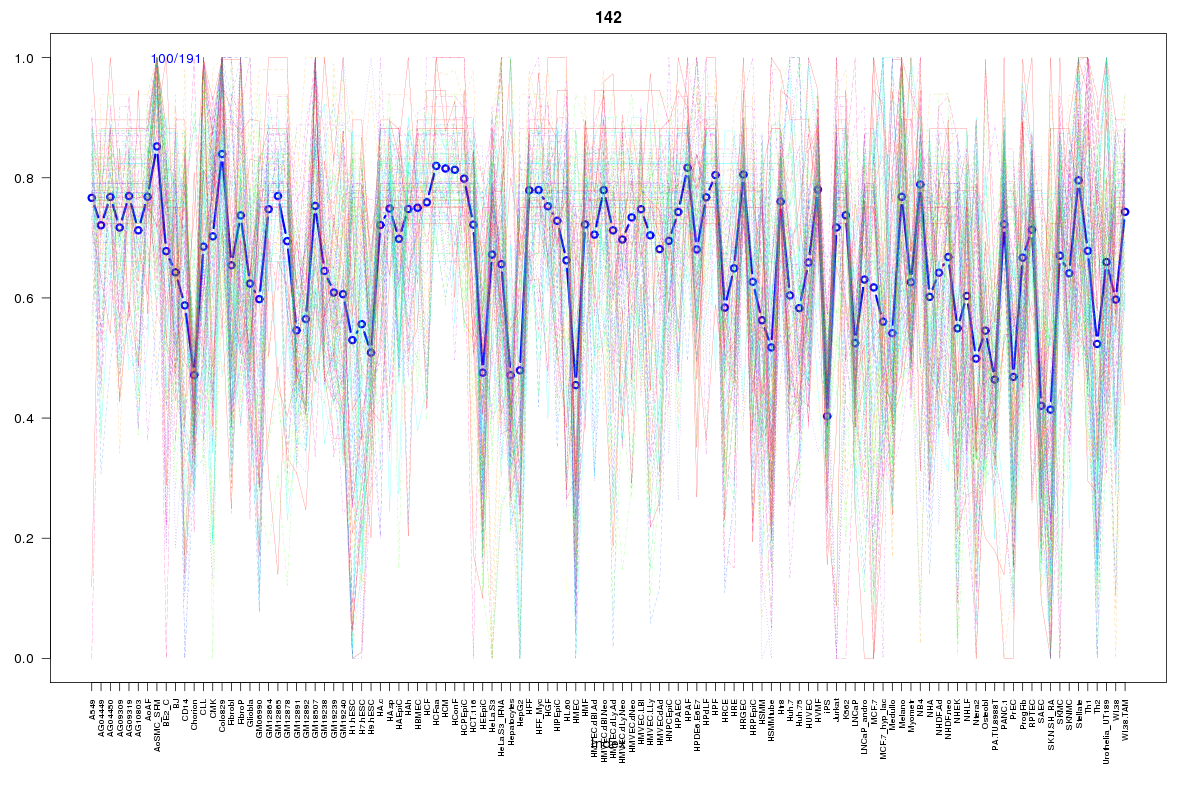 | 142 | 1 |
 | 248 | 1 |
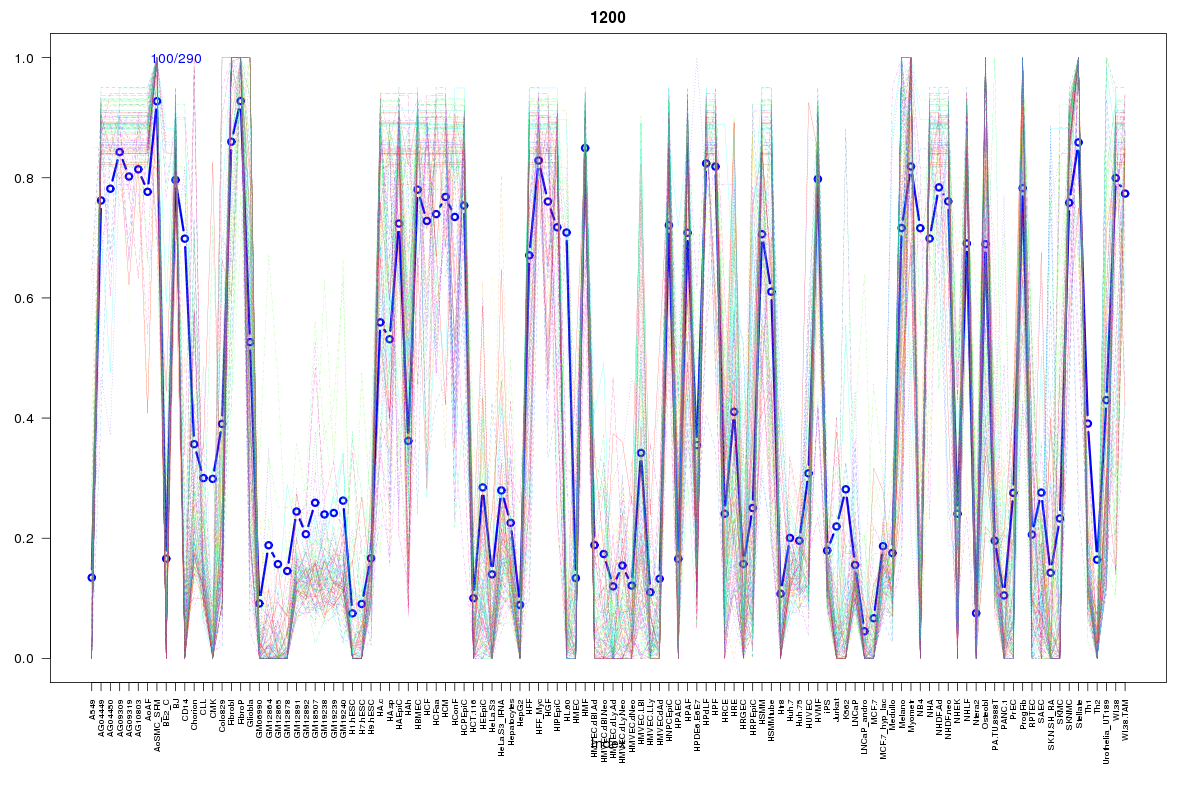 | 1200 | 1 |
 | 1877 | 1 |
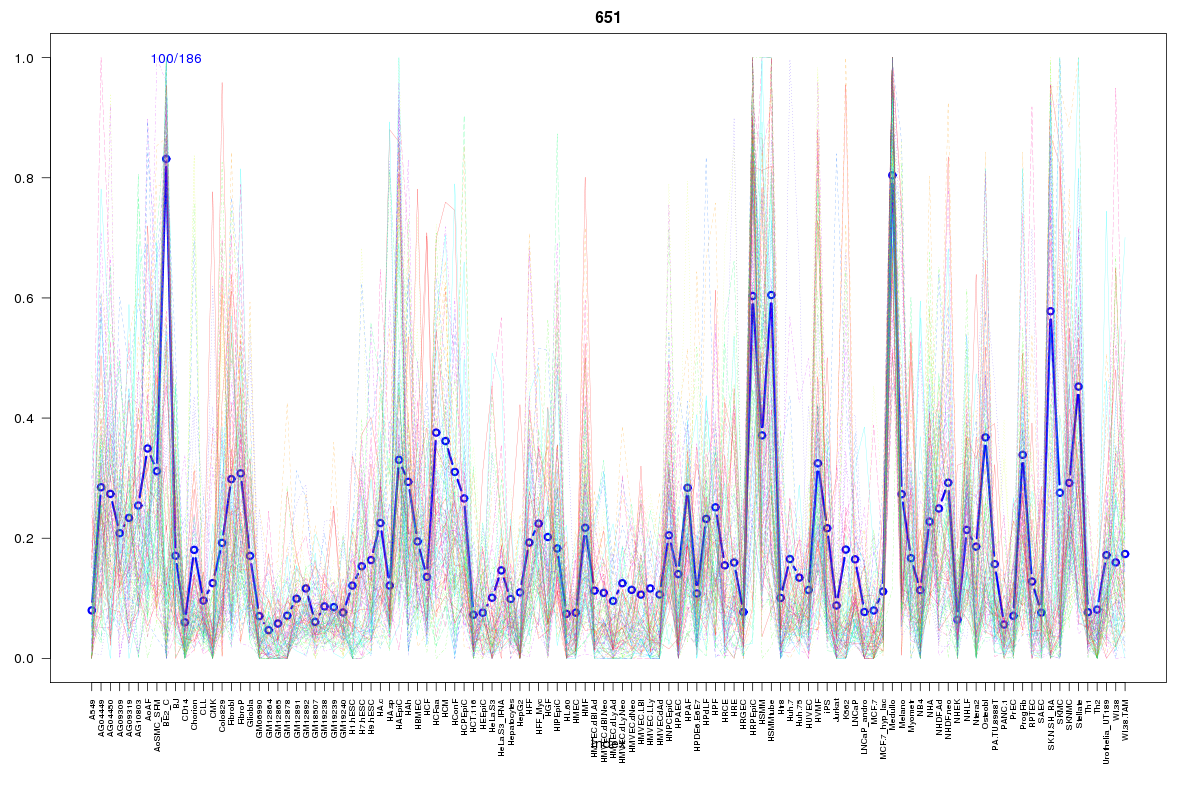 | 651 | 1 |
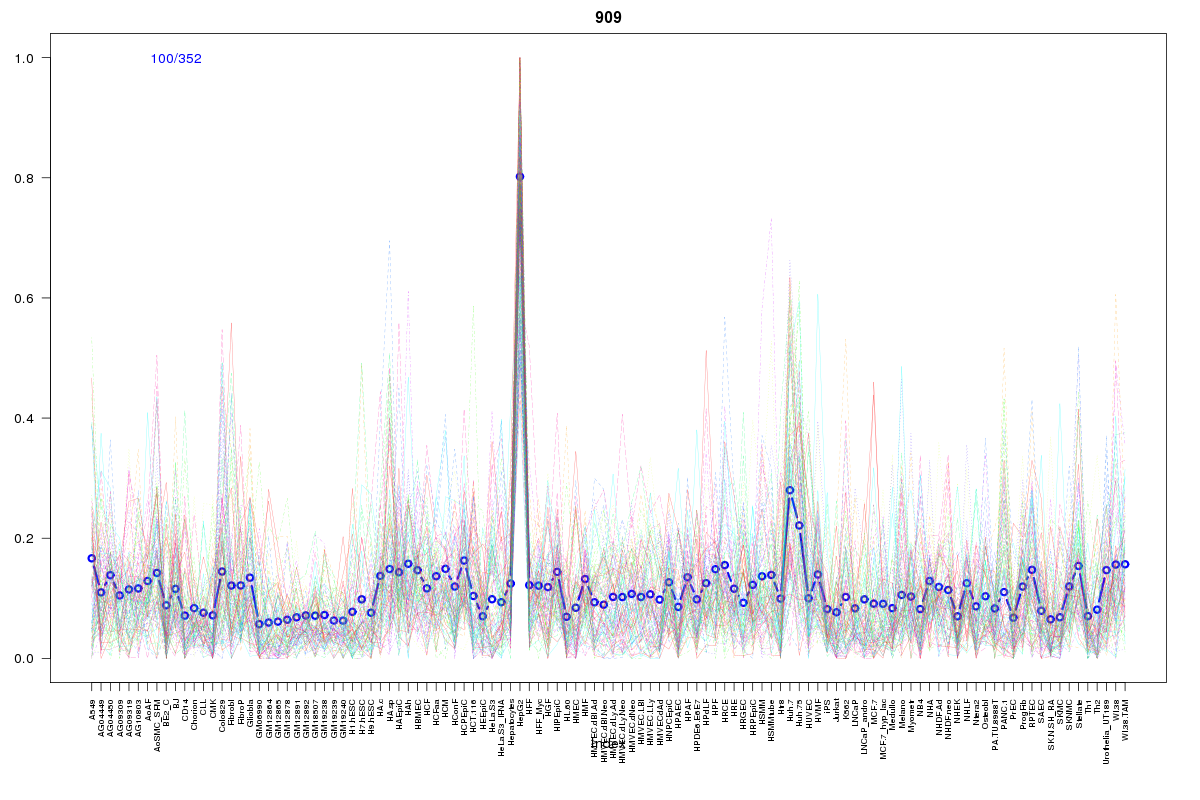 | 909 | 1 |
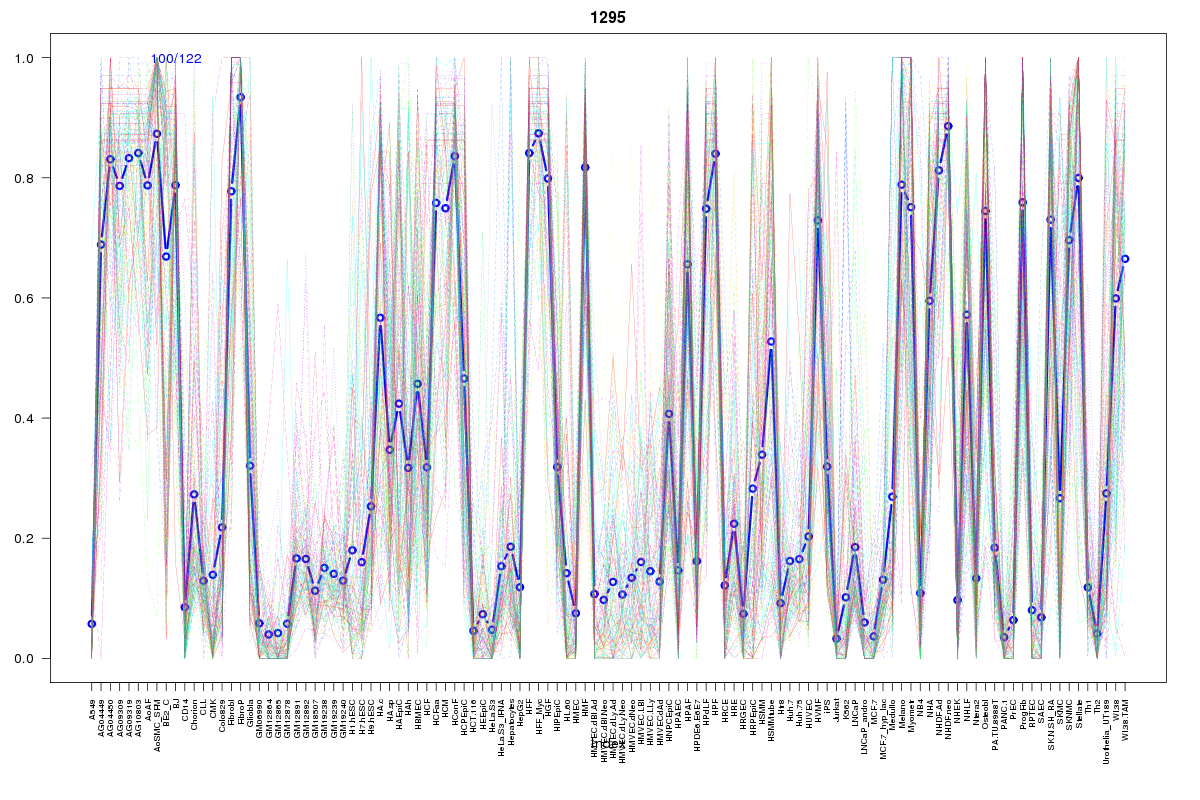 | 1295 | 1 |
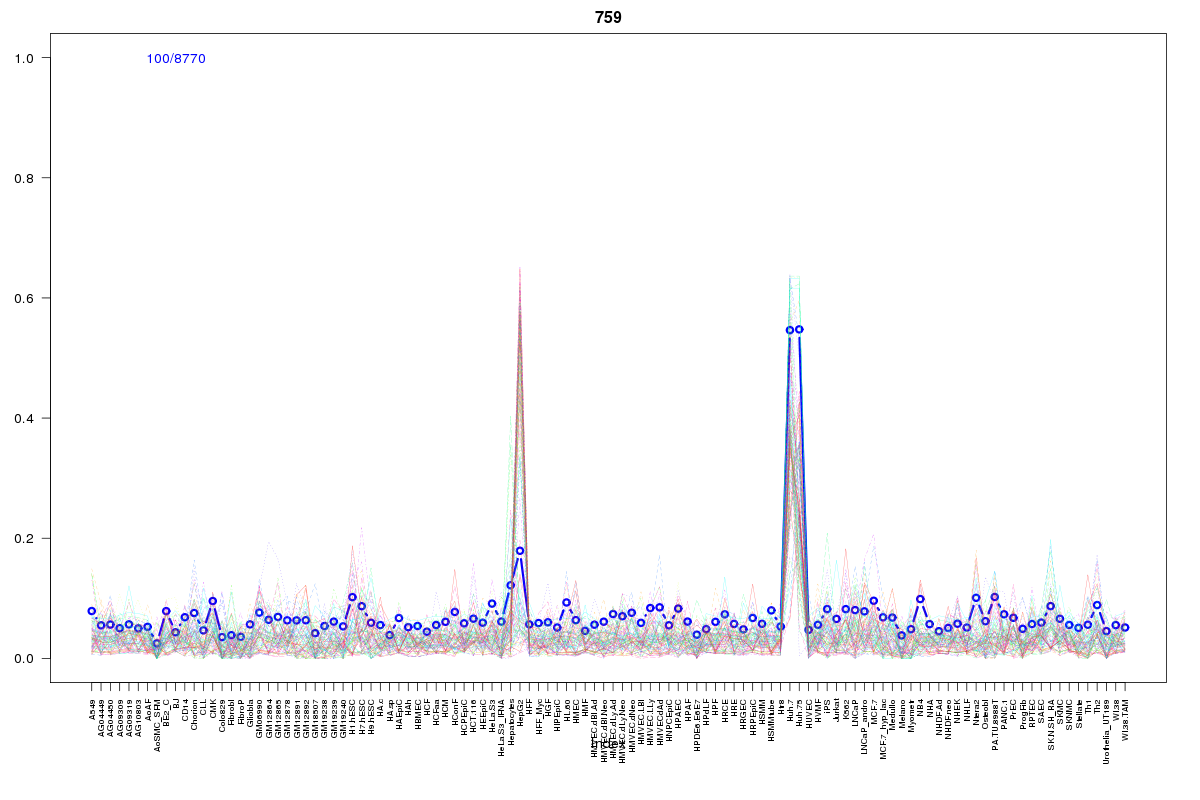 | 759 | 1 |
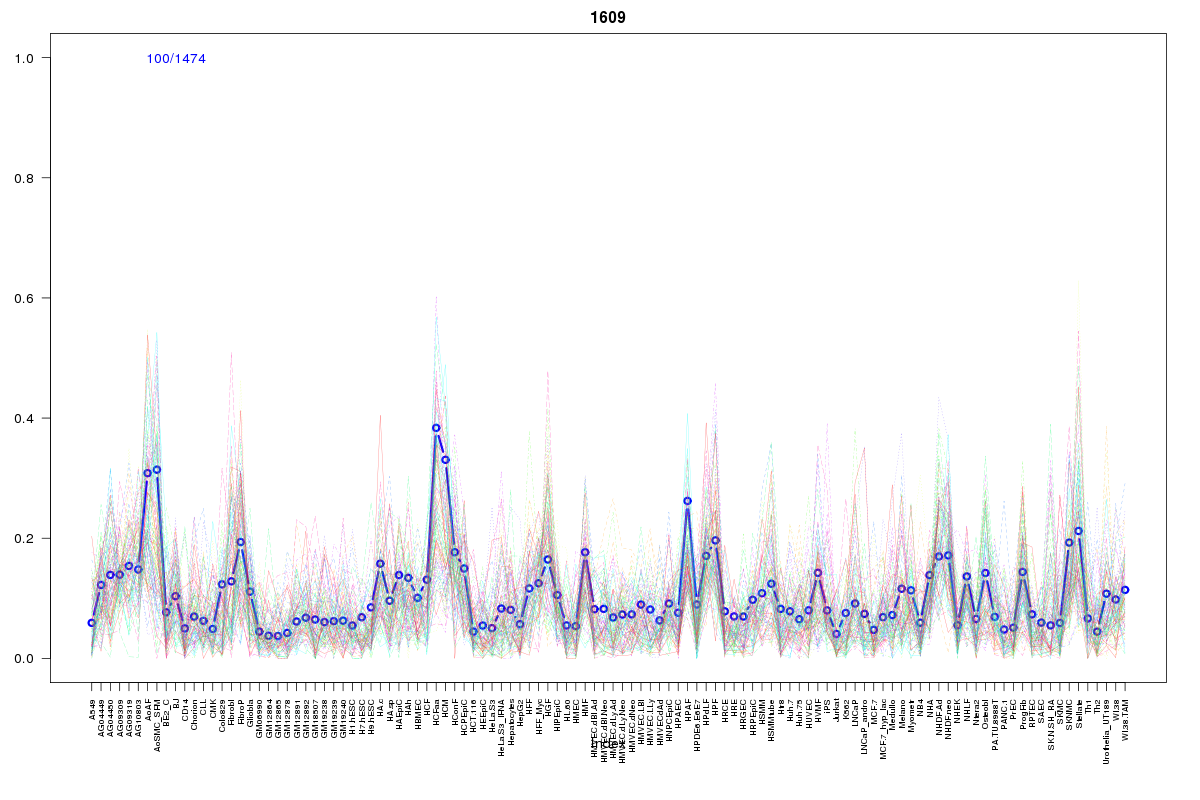 | 1609 | 1 |
 | 375 | 1 |
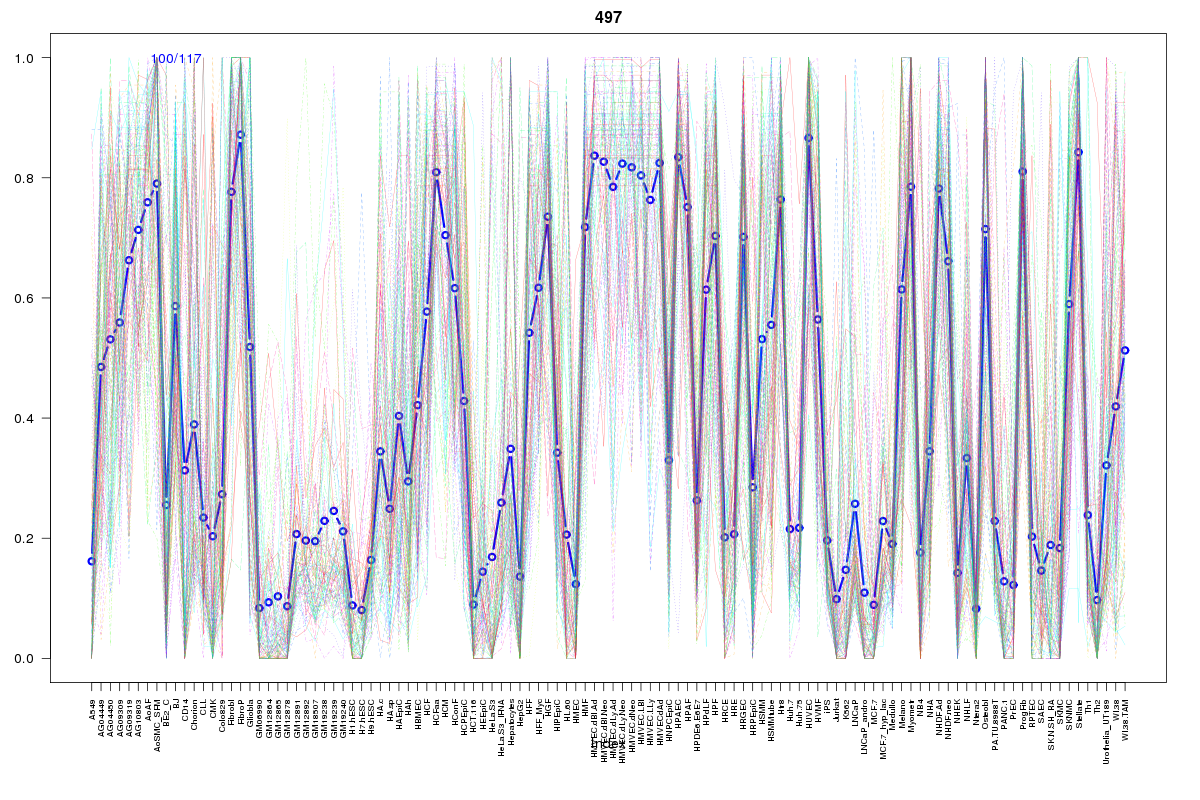 | 497 | 1 |
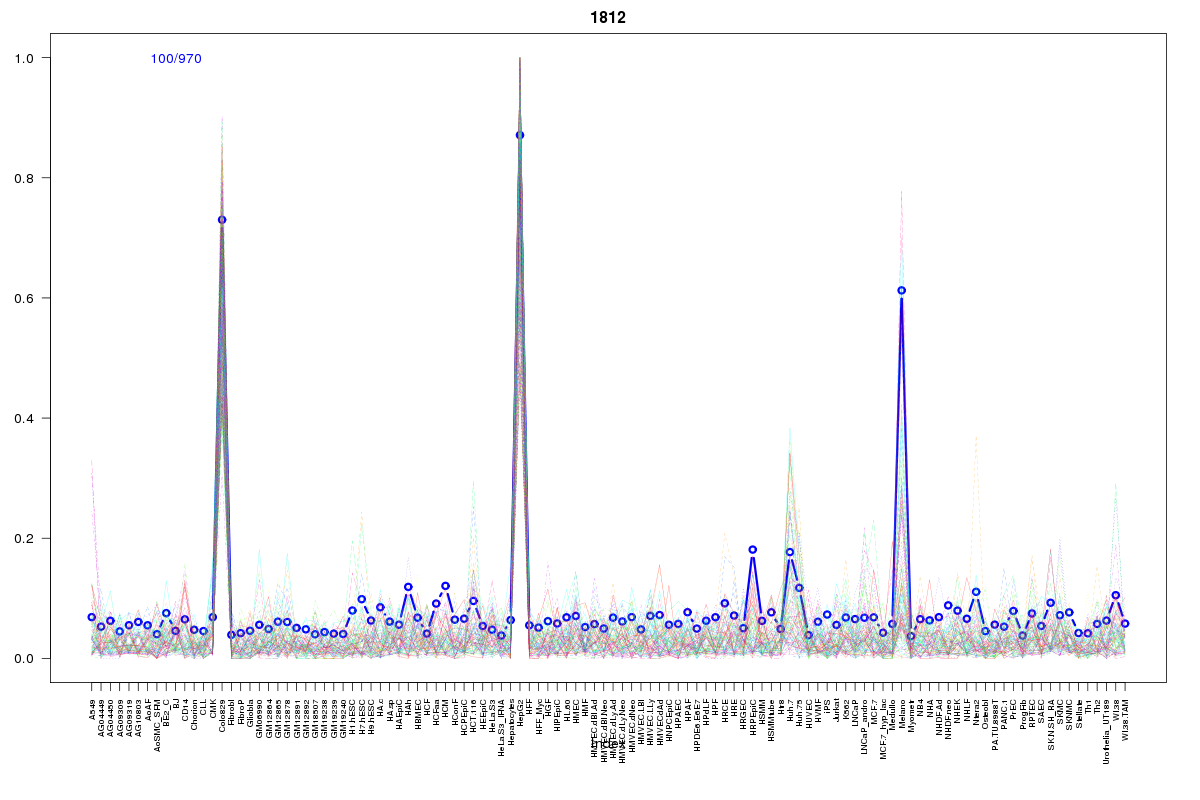 | 1812 | 1 |
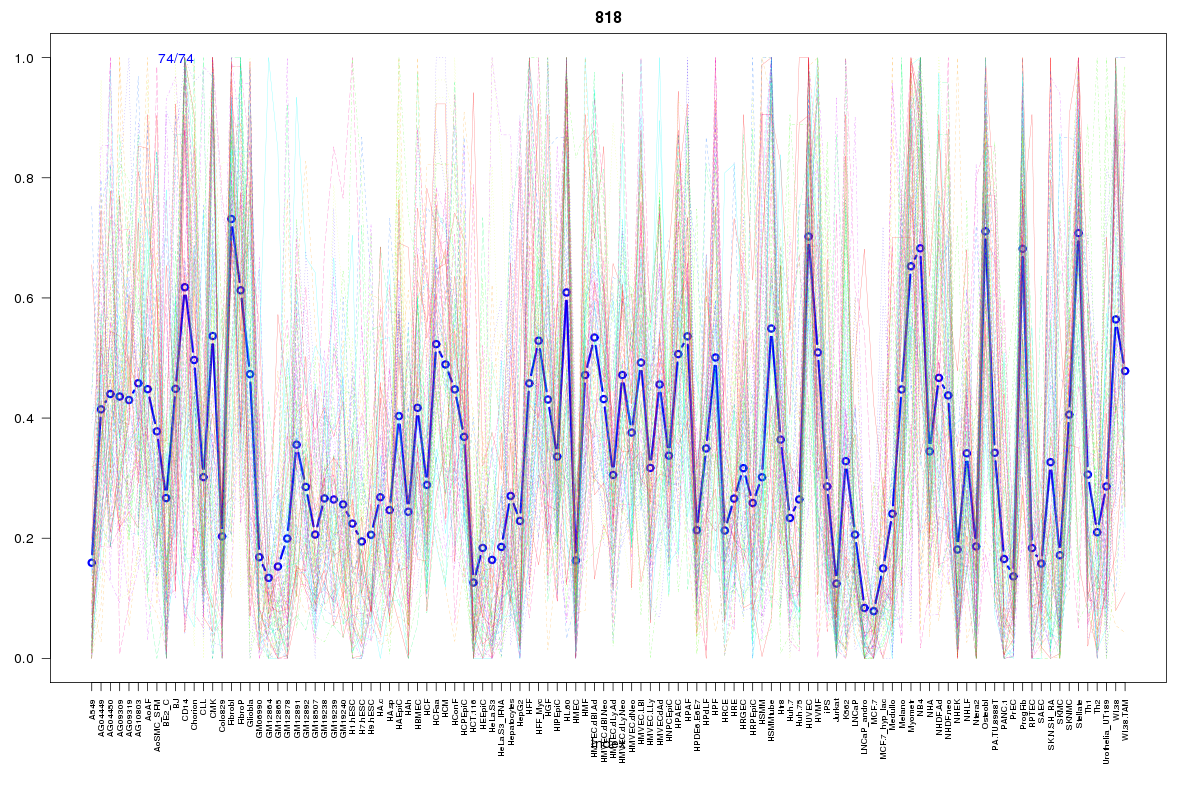 | 818 | 1 |
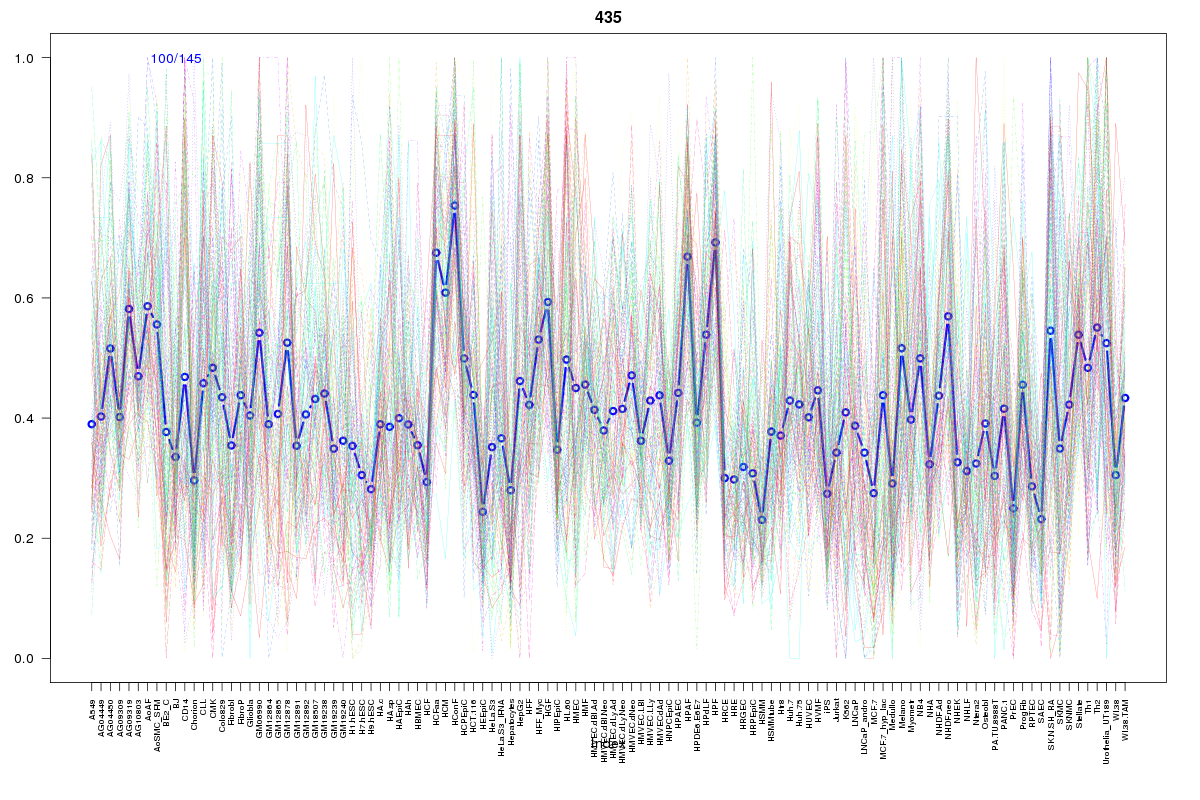 | 435 | 1 |
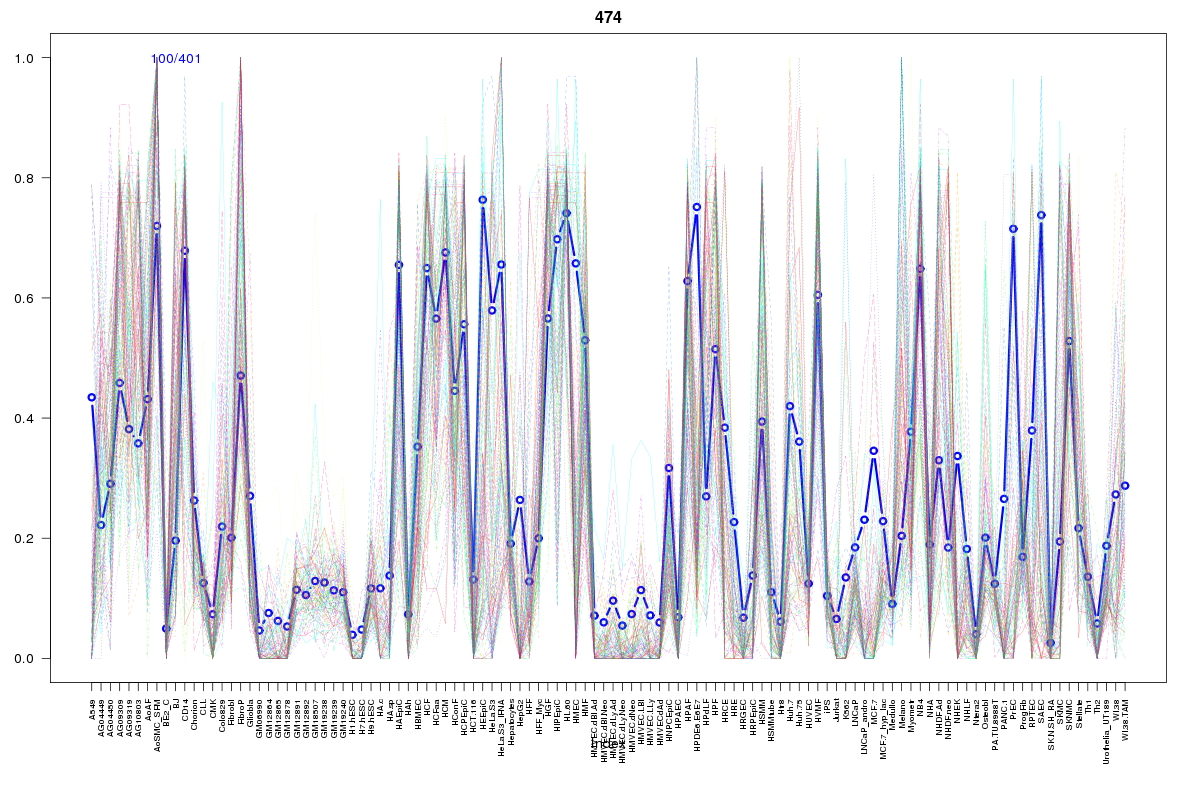 | 474 | 1 |
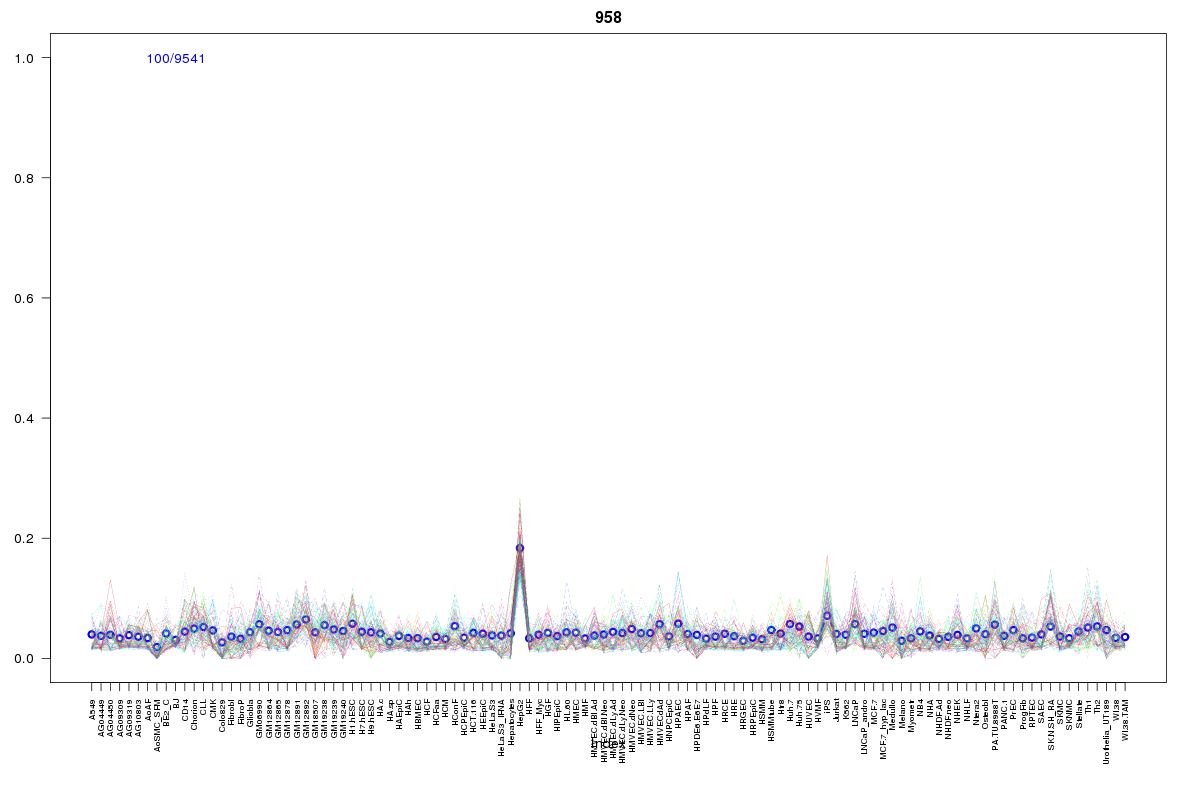 | 958 | 1 |
Resources
BED file downloads
Connects to 33 DHS sitesTop 10 Correlated DHS Sites
p-values indiciate significant higher or lower correlation| Location | Cluster | P-value |
|---|---|---|
| chr1:161207920-161208070 | 1022 | 0 |
| chr1:161193980-161194130 | 1013 | 0 |
| chr1:161257425-161257575 | 759 | 0.001 |
| chr1:161193380-161193530 | 1022 | 0.001 |
| chr1:161194180-161194330 | 160 | 0.003 |
| chr1:161188540-161188690 | 1355 | 0.004 |
| chr1:161283465-161283615 | 1812 | 0.012 |
| chr1:161279525-161279675 | 908 | 0.012 |
| chr1:161189320-161189470 | 1355 | 0.012 |
| chr1:161208120-161208270 | 909 | 0.013 |
| chr1:161279785-161279935 | 1355 | 0.014 |
External Databases
UCSCEnsembl (ENSG00000158874)