SOM cluster: 2446
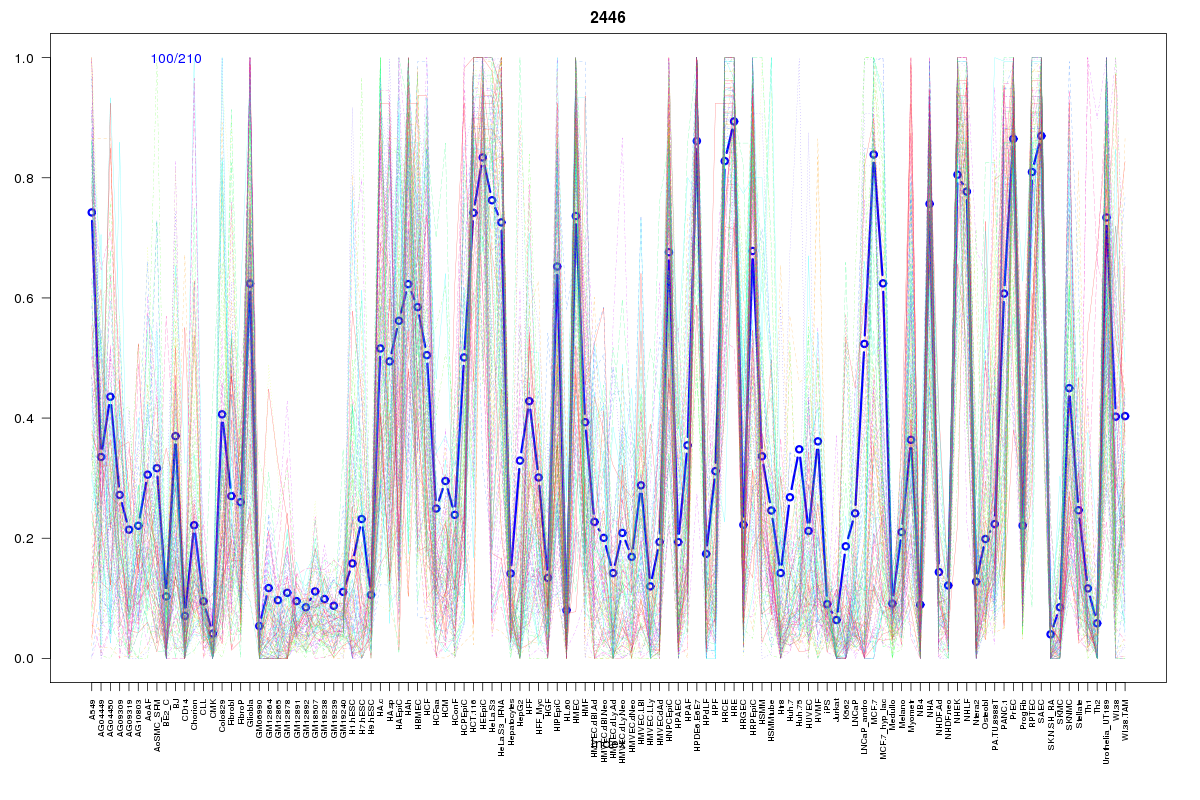
Cluster Hypersensitivity Profile

Genomic Location Trend
These plots show the distribution of the DHS sites surrounding the Transcript Start Site of the nearest gene.
Stats
Number of sites: 210Promoter: 2%
CpG-Island: 0%
Conserved: 40%
Enriched Motifs & Matches
Match Detail: [Jaspar]
|
| ||
|---|---|---|
| Sites: 53/100 | e-val: 1.1e-31 | ||
| Factor | e-val(match) | DB |
| AP1 | 0.000000000014946 | JASPAR |
| NFE2L2 | 0.000000007982 | JASPAR |
| PPARG | 0.0028482 | JASPAR |
| NFE2L1::MafG | 0.0057816 | JASPAR |
| RORA_2 | 0.015105 | JASPAR |
BED file downloads
Top 10 Example Regions
| Location | Gene Link | Dist. |
|---|---|---|
| chr1: 149909360-149909510 | MTMR11 | 18.57 |
| chr1: 149909360-149909510 | SF3B4 | 18.57 |
| chr1: 149909360-149909510 | OTUD7B | 18.57 |
| chr1: 151558200-151558350 | SNORA44 | 42.37 |
| chr3: 196006380-196006530 | TCTEX1D2 | 48.79 |
| chr3: 196006380-196006530 | Y_RNA | 48.79 |
| chr3: 196006380-196006530 | TM4SF19 | 48.79 |
| chr3: 196006380-196006530 | PCYT1A | 48.79 |
| chr8: 102648060-102648210 | GRHL2 | 50.72 |
| chr8: 102648060-102648210 | NCALD | 50.72 |