Gene: TCTEX1D2
chr3: 196018089-196045159Expression Profile
(log scale)
Graphical Connections
Distribution of linked clusters:
You may find it interesting if many of the connected DHS sites belong to the same cluster.| Cluster Profile | Cluster ID | Number of DHS sites in this cluster |
|---|---|---|
 | 430 | 2 |
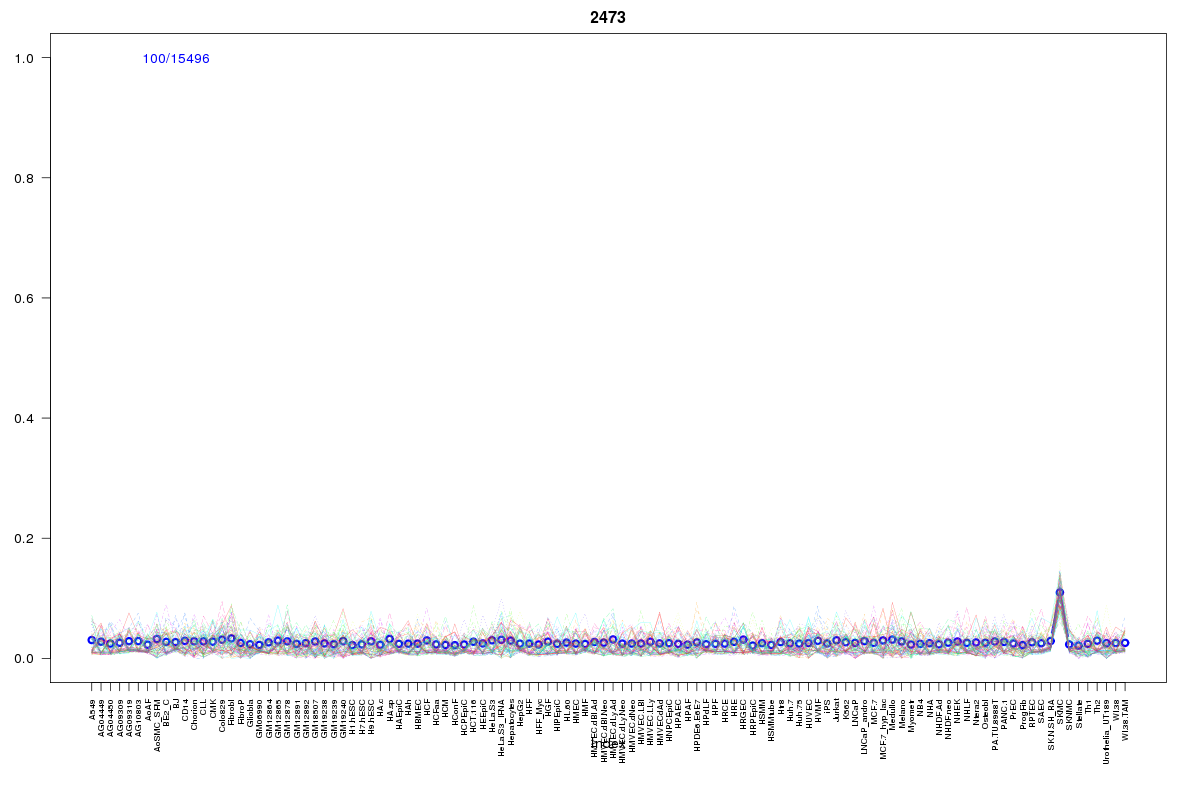 | 2473 | 2 |
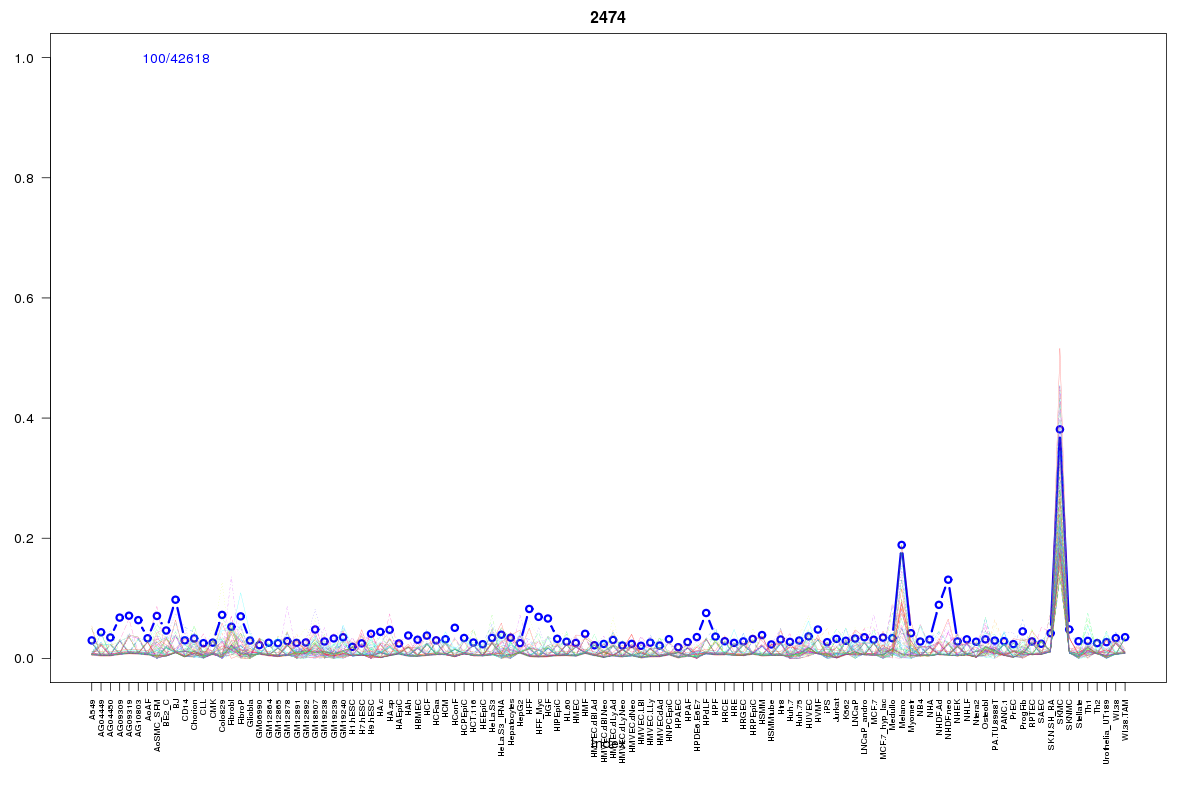 | 2474 | 1 |
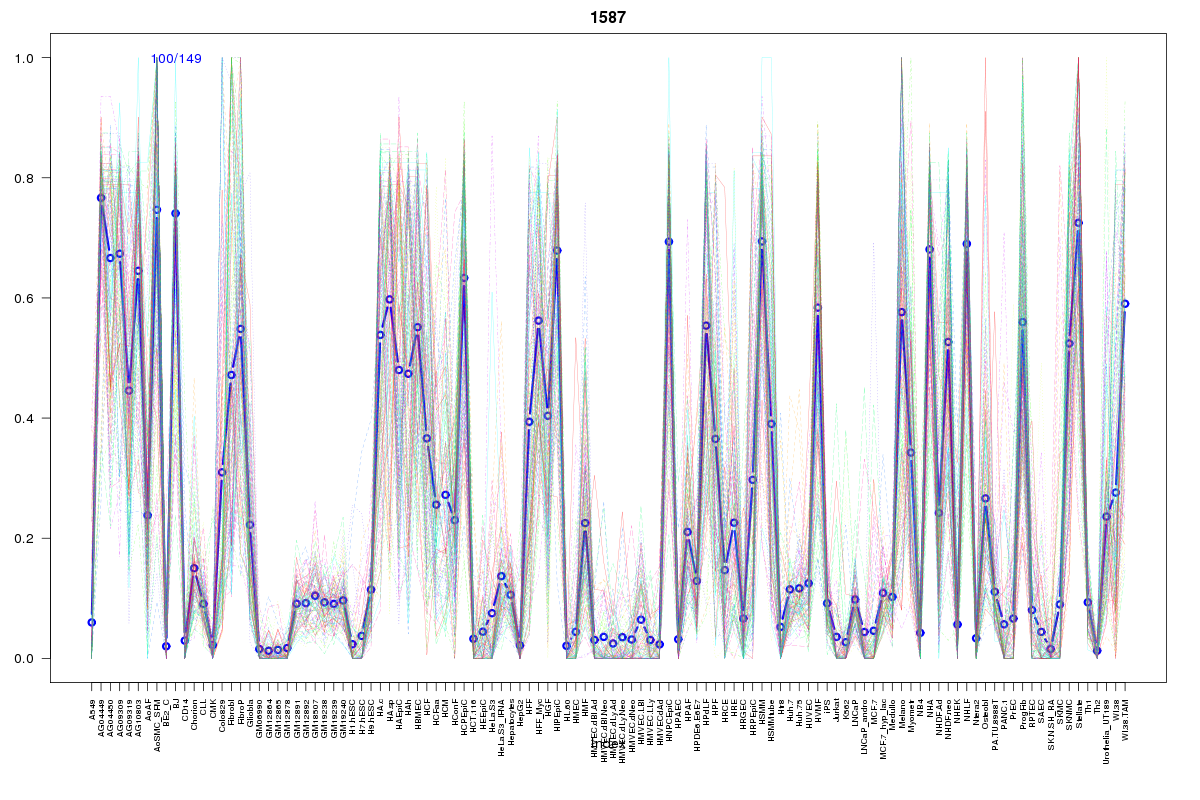 | 1587 | 1 |
 | 326 | 1 |
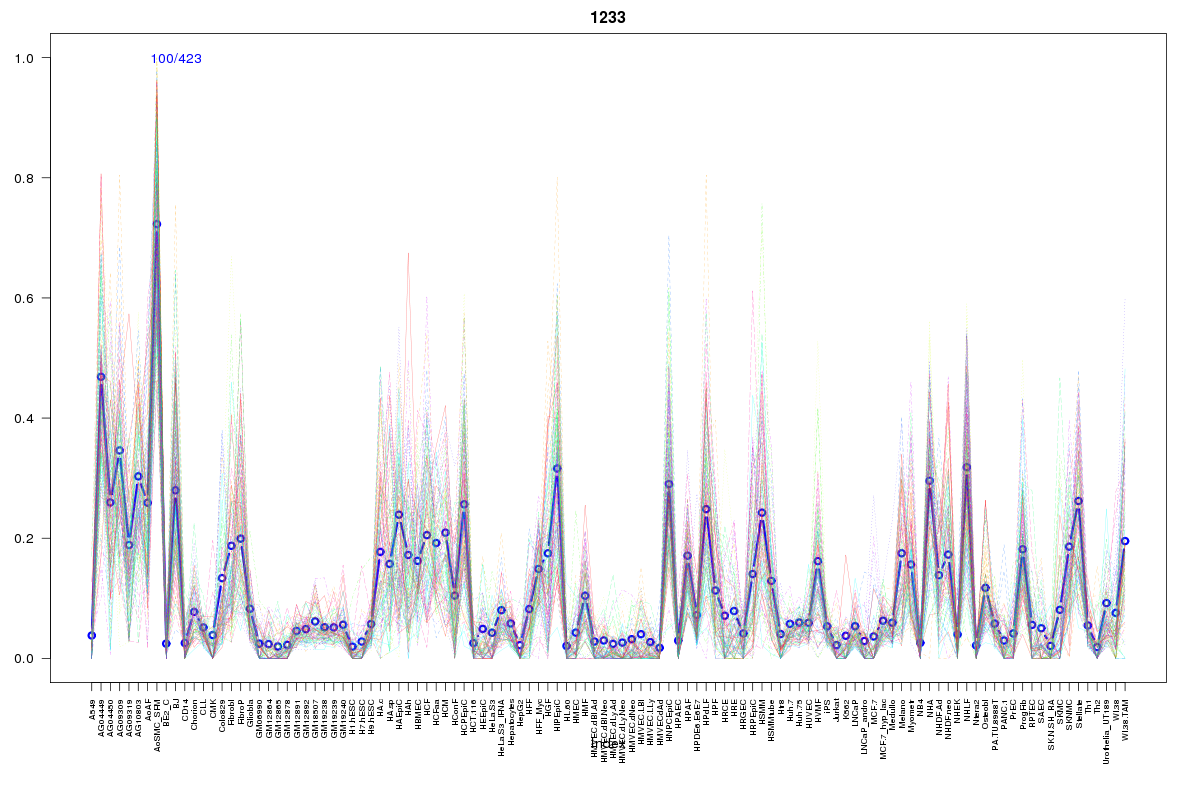 | 1233 | 1 |
 | 429 | 1 |
 | 1056 | 1 |
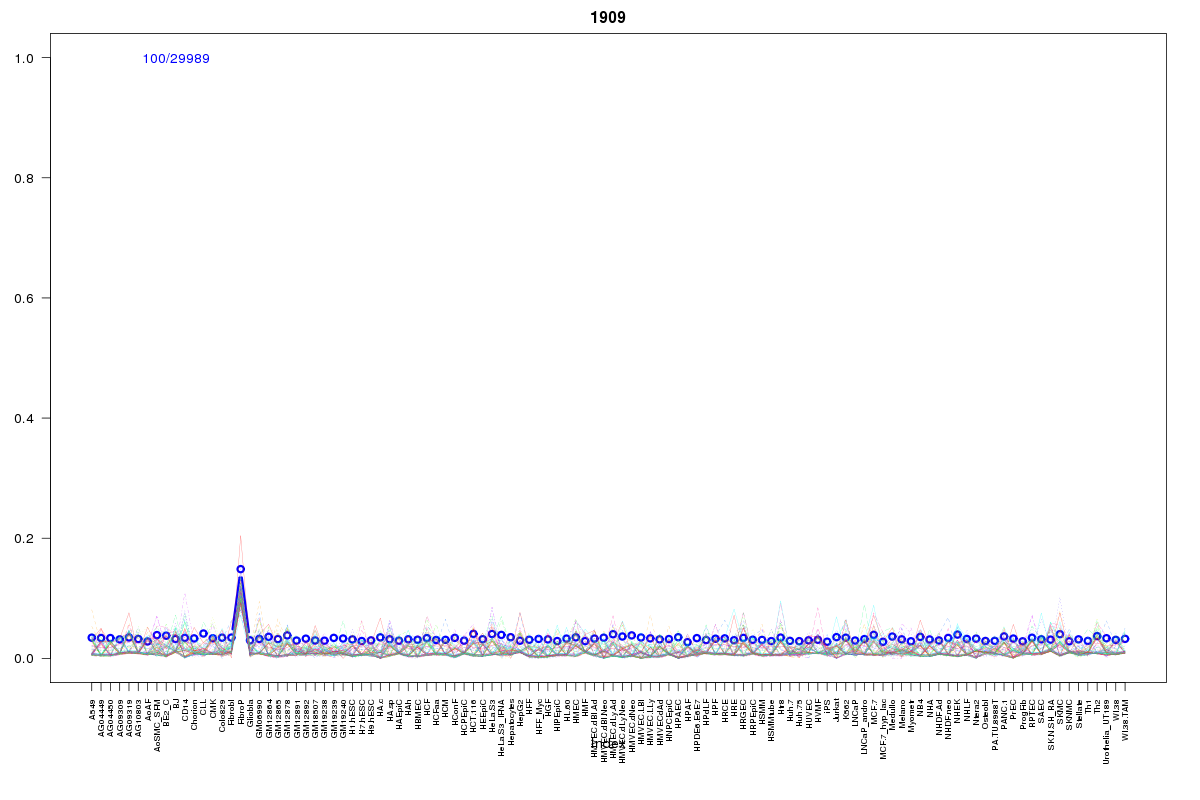 | 1909 | 1 |
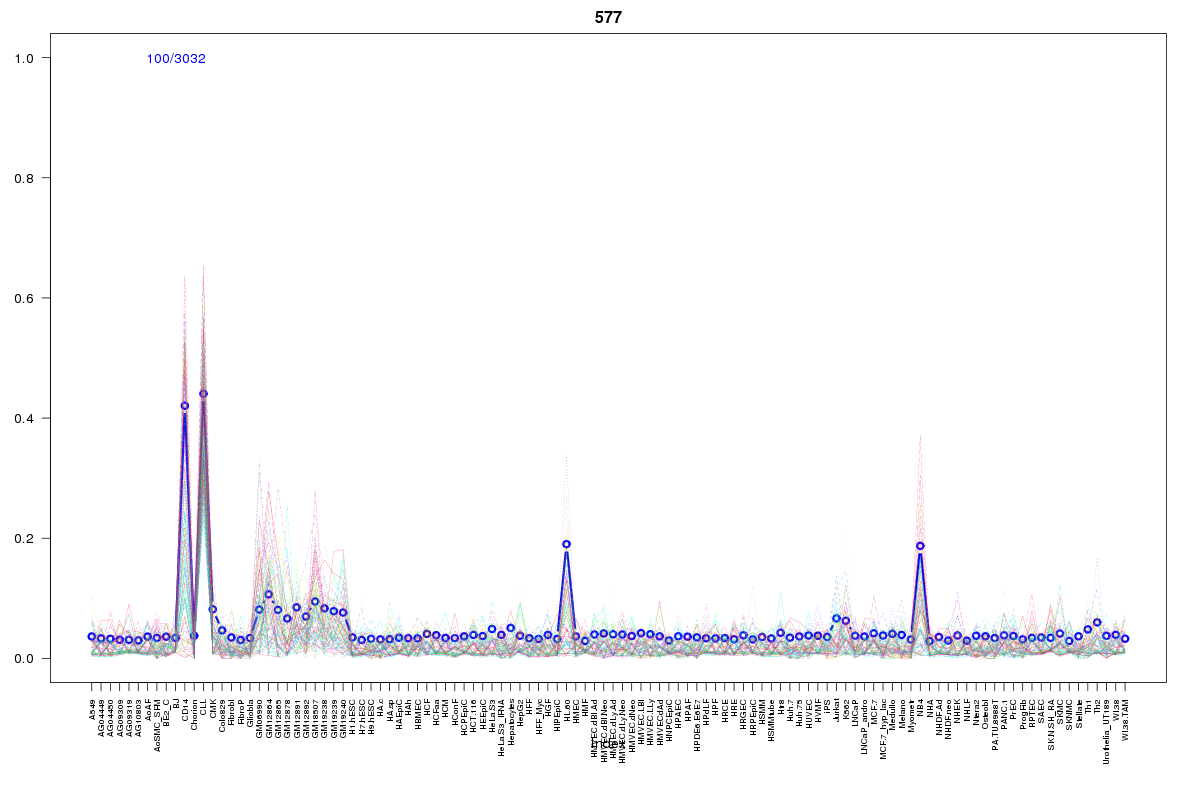 | 577 | 1 |
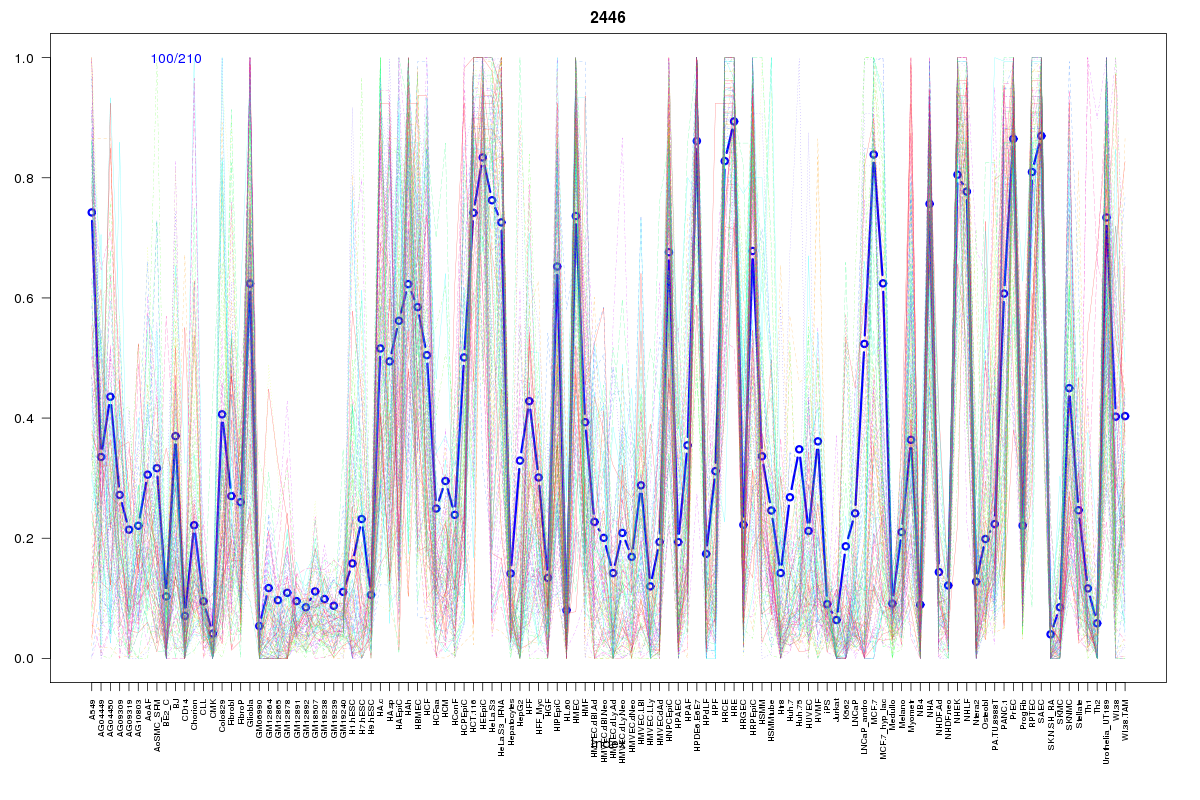 | 2446 | 1 |
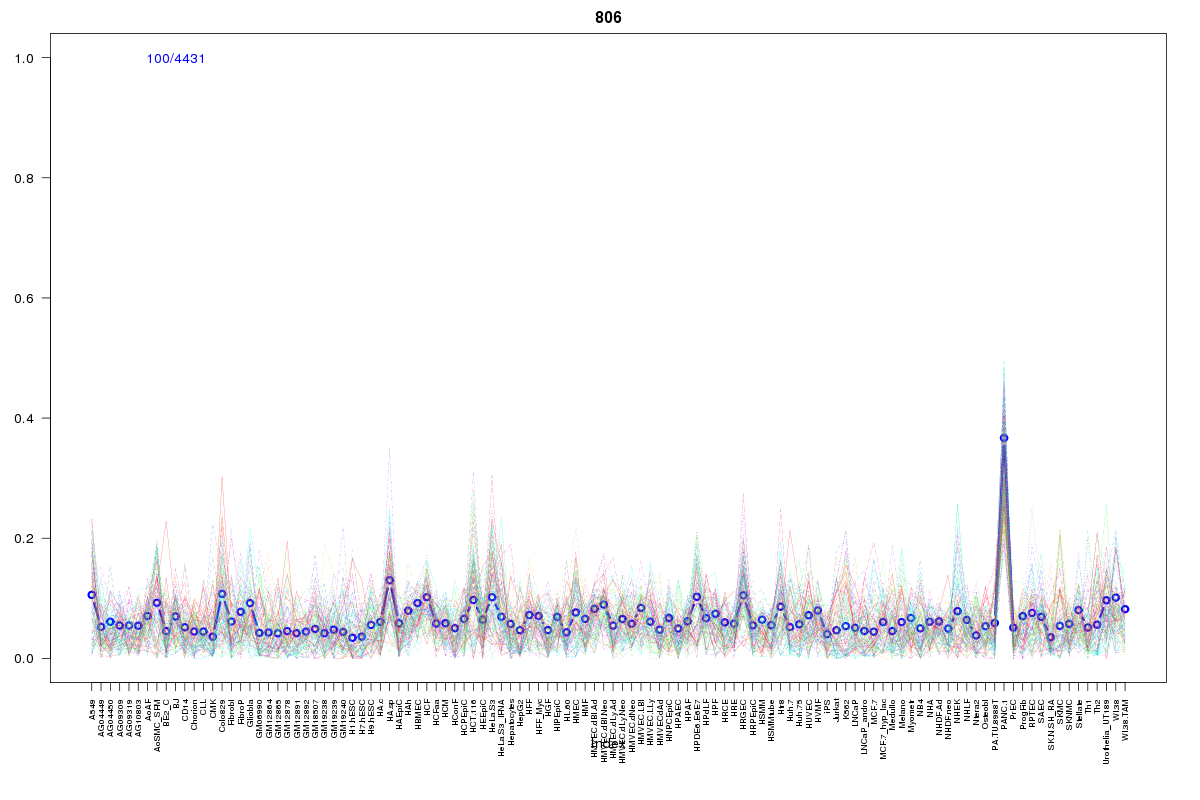 | 806 | 1 |
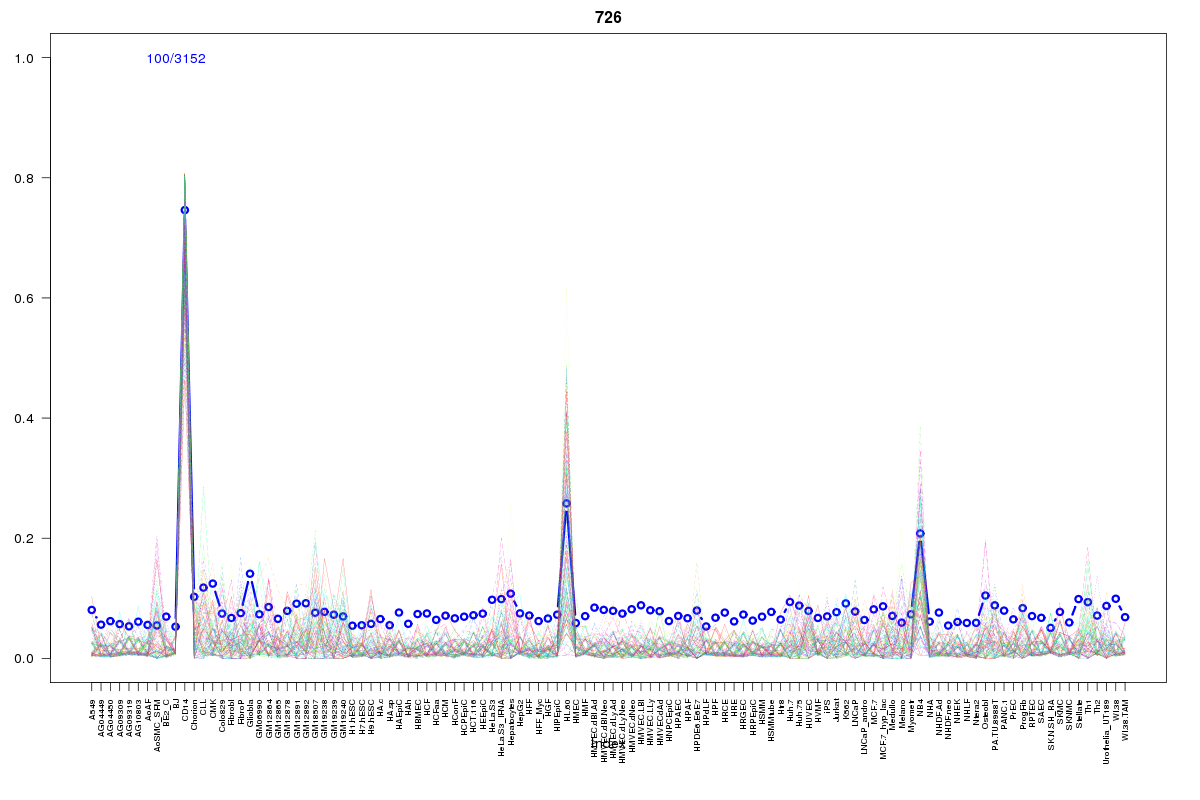 | 726 | 1 |
 | 1605 | 1 |
 | 2052 | 1 |
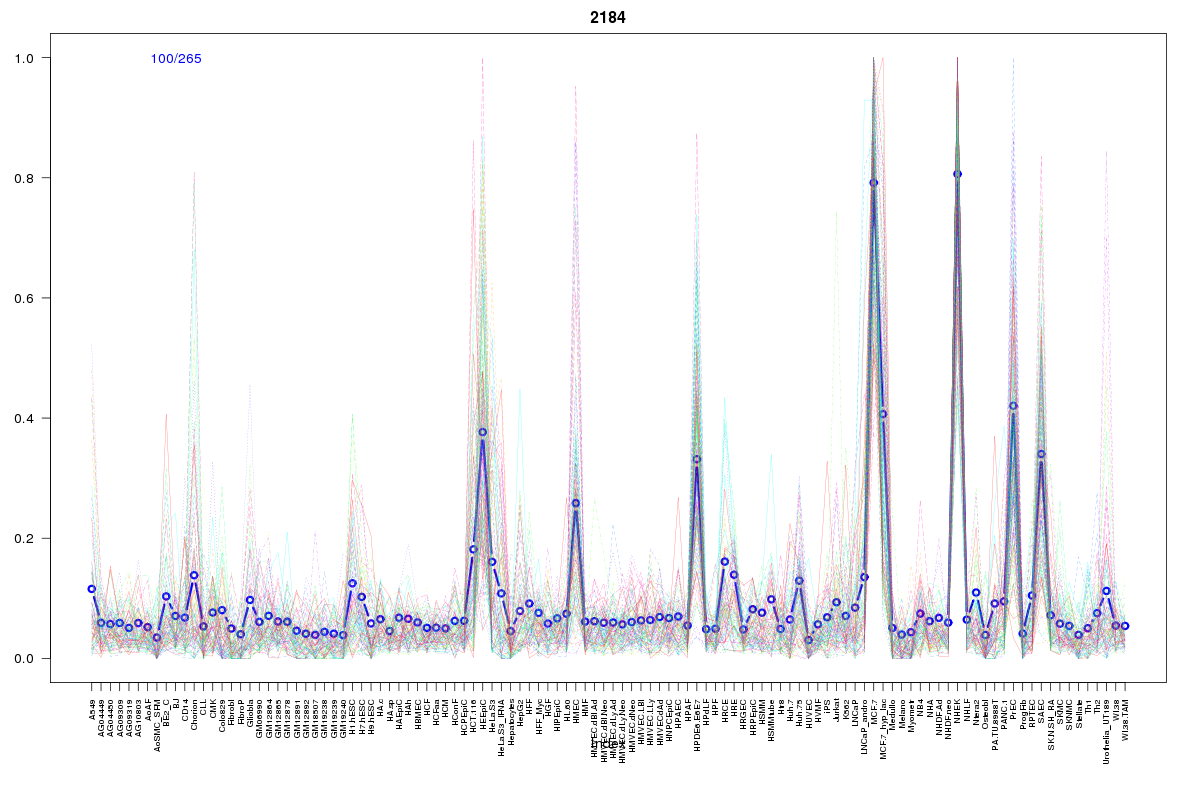 | 2184 | 1 |
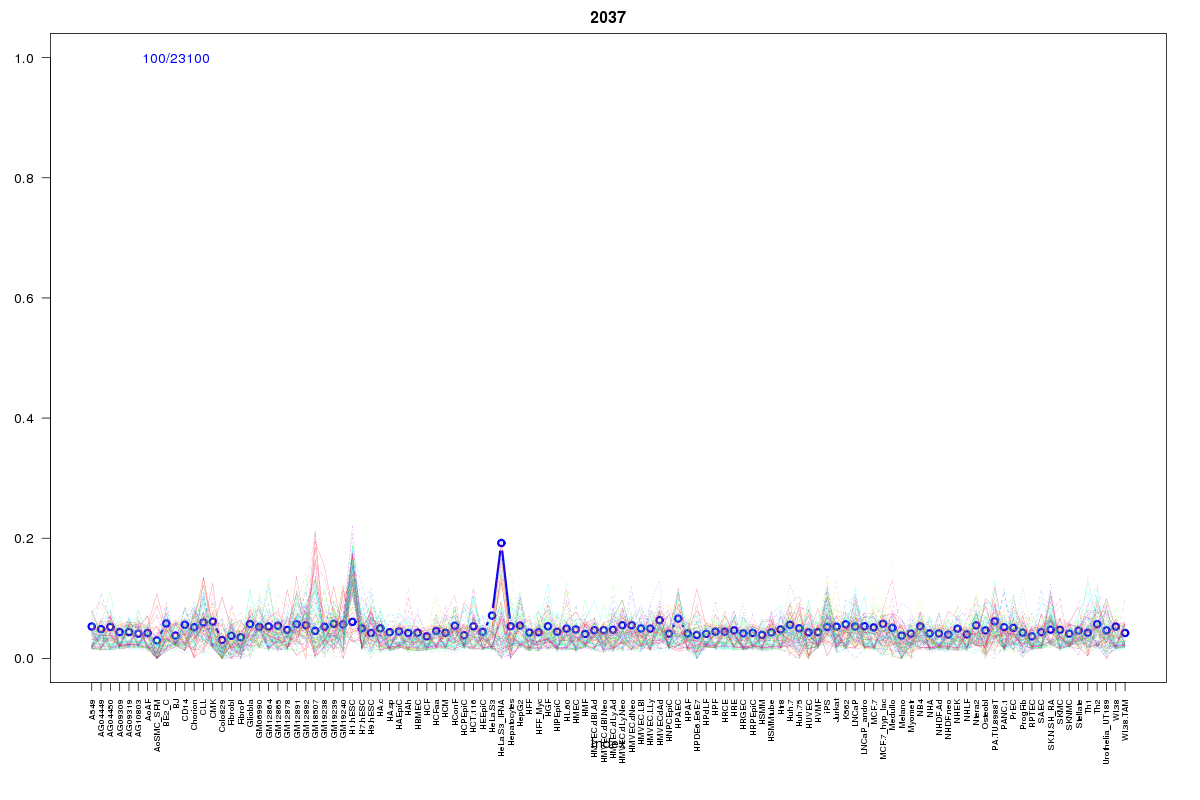 | 2037 | 1 |
Resources
BED file downloads
Connects to 19 DHS sitesTop 10 Correlated DHS Sites
p-values indiciate significant higher or lower correlation| Location | Cluster | P-value |
|---|---|---|
| chr3:196078725-196078875 | 2473 | 0.001 |
| chr3:196059525-196059675 | 1605 | 0.002 |
| chr3:196104845-196104995 | 2474 | 0.005 |
| chr3:196082105-196082255 | 2473 | 0.006 |
| chr3:195987925-195988075 | 1909 | 0.006 |
| chr3:196061005-196061155 | 2052 | 0.016 |
| chr3:196006380-196006530 | 2446 | 0.02 |
| chr3:196070260-196070410 | 2184 | 0.02 |
| chr3:196072405-196072555 | 2037 | 0.023 |
| chr3:196043920-196044070 | 806 | 0.023 |
| chr3:195980285-195980435 | 1056 | 0.023 |
External Databases
UCSCEnsembl (ENSG00000213123)