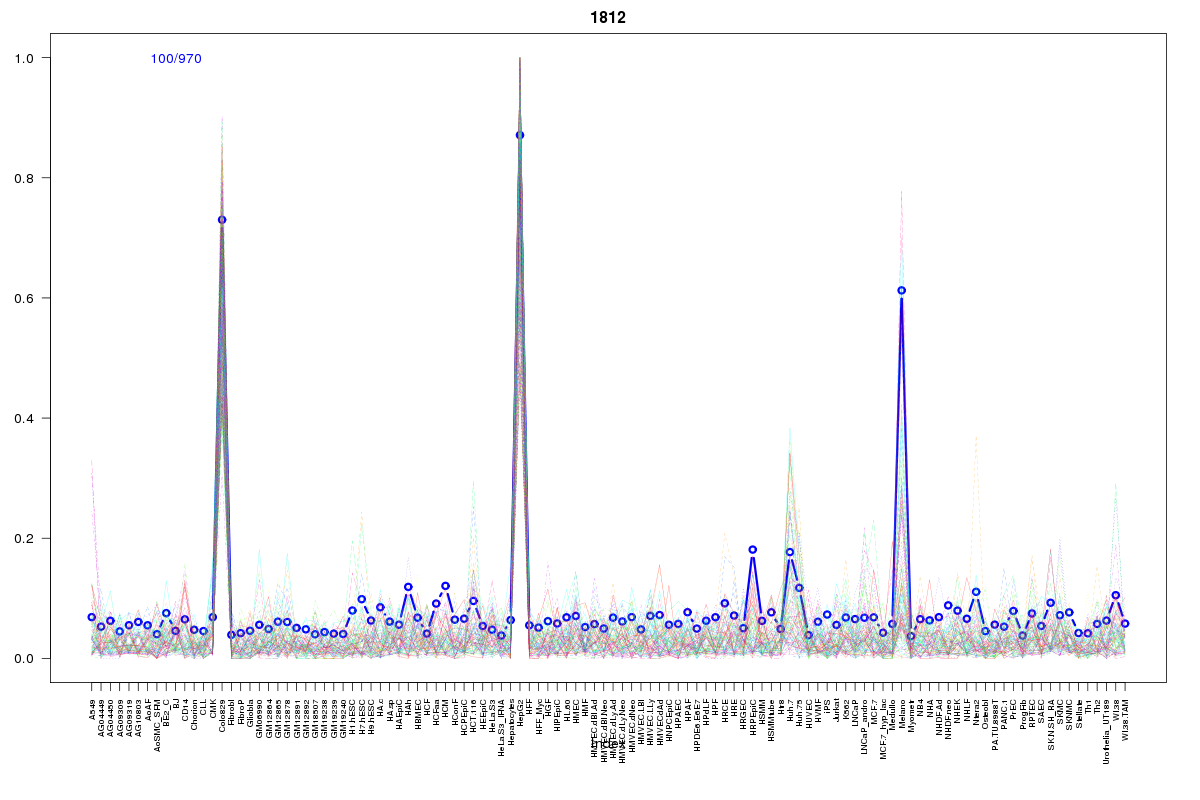
SOM cluster: 1812
Cluster Hypersensitivity Profile

Genomic Location Trend
These plots show the distribution of the DHS sites surrounding the Transcript Start Site of the nearest gene.
Stats
Number of sites: 970Promoter: 0%
CpG-Island: 0%
Conserved: 41%
Enriched Motifs & Matches
Match Detail: [Jaspar]
|
| ||
|---|---|---|
| Sites: 56/100 | e-val: 1.7e-34 | ||
| Factor | e-val(match) | DB |
| SOX10 | 0.0000068543 | JASPAR |
| Foxd3 | 0.00031004 | JASPAR |
| SRY | 0.0032816 | JASPAR |
| SOX9 | 0.0065511 | JASPAR |
| Sox2 | 0.0066315 | JASPAR |
BED file downloads
Top 10 Example Regions
| Location | Gene Link | Dist. |
|---|---|---|
| chr18: 55954940-55955090 | NEDD4L | 46.2 |
| chr16: 524660-524810 | RAB11FIP3 | 46.28 |
| chr16: 524660-524810 | TMEM8A | 46.28 |
| chr16: 524660-524810 | PIGQ | 46.28 |
| chr12: 102009765-102009915 | CHPT1 | 48.8 |
| chr1: 161283465-161283615 | APOA2 | 49.88 |
| chr1: 161283465-161283615 | MPZ | 49.88 |
| chr1: 161283465-161283615 | SDHC | 49.88 |
| chr3: 133436360-133436510 | RP11-404G16.2 | 52.84 |
| chr3: 133436360-133436510 | TF | 52.84 |