SOM cluster: 1795
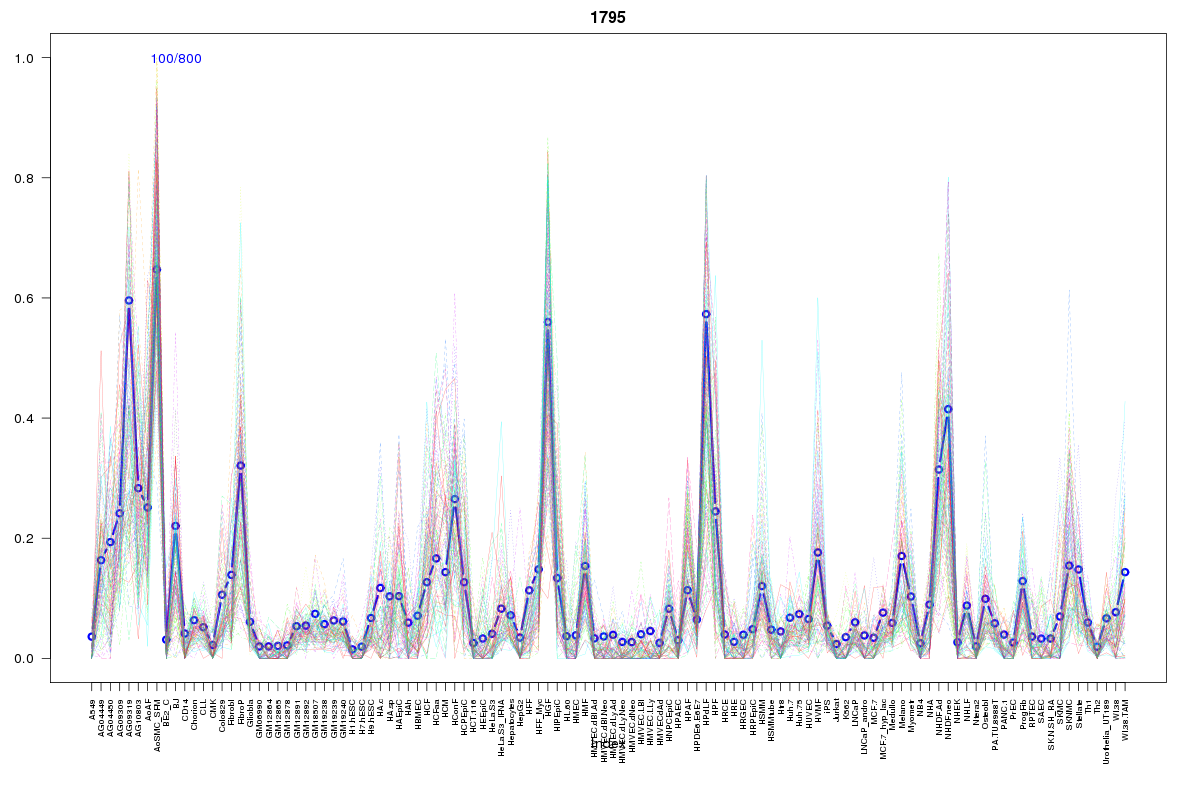
Cluster Hypersensitivity Profile

Genomic Location Trend
These plots show the distribution of the DHS sites surrounding the Transcript Start Site of the nearest gene.
Stats
Number of sites: 800Promoter: 1%
CpG-Island: 0%
Conserved: 42%
Enriched Motifs & Matches
Match Detail: [Jaspar]
|
| ||
|---|---|---|
| Sites: 41/100 | e-val: 0.00000000000044 | ||
| Factor | e-val(match) | DB |
| Sox2 | 0.0024255 | JASPAR |
| Foxq1 | 0.0026996 | JASPAR |
| Foxd3 | 0.0028864 | JASPAR |
| NFATC2 | 0.0044663 | JASPAR |
| MEF2A | 0.0051353 | JASPAR |
|
| ||
| Sites: 29/100 | e-val: 0.00000000066 | ||
| Factor | e-val(match) | DB |
| CEBPA | 0.000000030709 | JASPAR |
| HNF1B | 0.0027397 | JASPAR |
| Ddit3::Cebpa | 0.0027954 | JASPAR |
| HLF | 0.0037457 | JASPAR |
| Sox5 | 0.0060566 | JASPAR |
BED file downloads
Top 10 Example Regions
| Location | Gene Link | Dist. |
|---|---|---|
| chr7: 38721640-38721790 | AMPH | 45.06 |
| chr1: 65971740-65971890 | RP11-430H12.2 | 47.25 |
| chr1: 65971740-65971890 | LEPR | 47.25 |
| chr18: 25642500-25642650 | CDH2 | 48.46 |
| chr4: 41209360-41209510 | UCHL1 | 52.18 |
| chr11: 121496620-121496770 | SORL1 | 52.26 |
| chr8: 57471920-57472070 | RP11-17A4.3 | 54.67 |
| chr8: 57471920-57472070 | LINC00968 | 54.67 |
| chr11: 130425480-130425630 | ADAMTS15 | 55.57 |
| chr8: 52771420-52771570 | PCMTD1 | 57.05 |