Gene: PCMTD1
chr8: 52730139-52811735Expression Profile
(log scale)
Graphical Connections
Distribution of linked clusters:
You may find it interesting if many of the connected DHS sites belong to the same cluster.| Cluster Profile | Cluster ID | Number of DHS sites in this cluster |
|---|---|---|
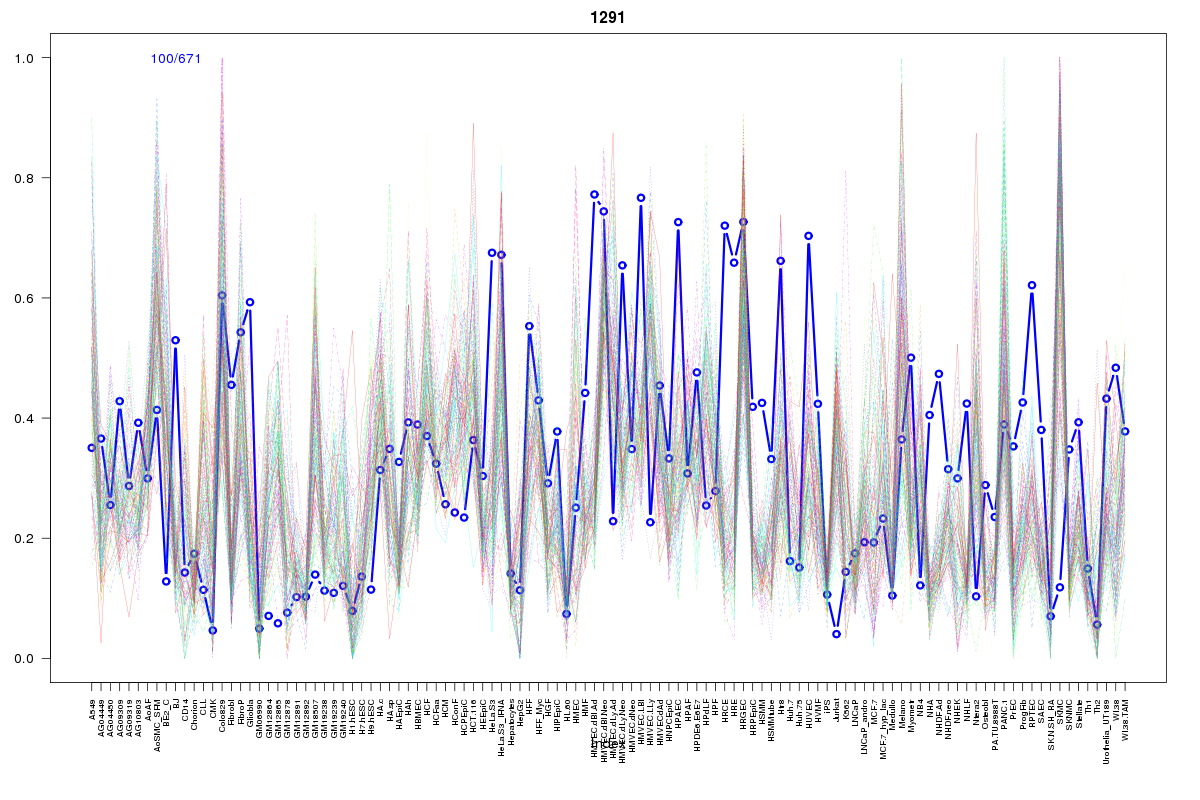 | 1291 | 1 |
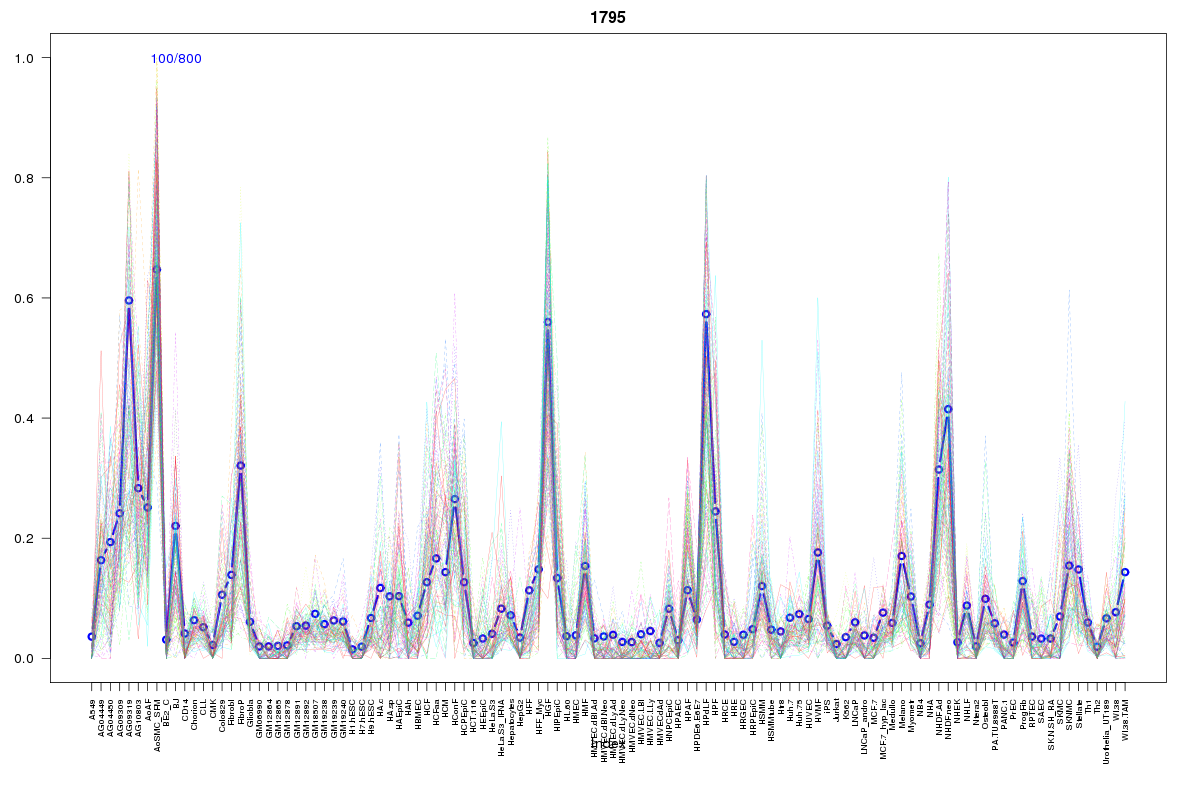 | 1795 | 1 |
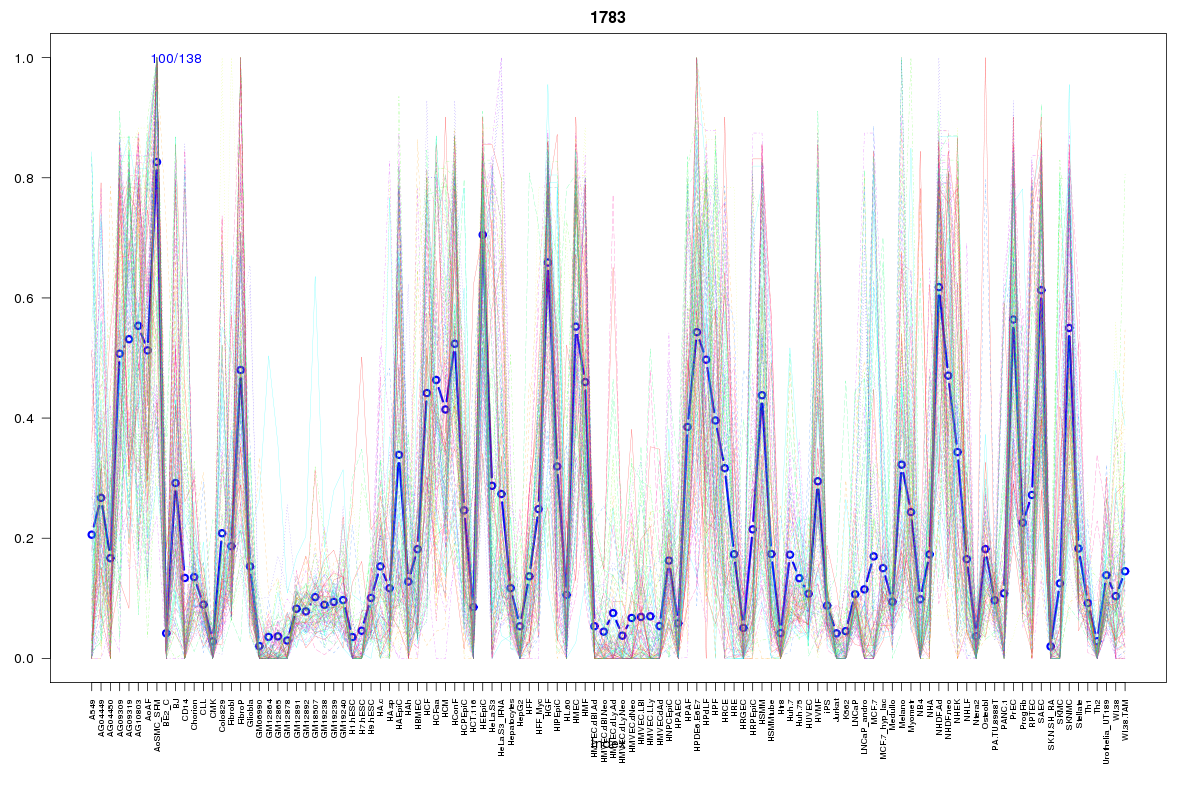 | 1783 | 1 |
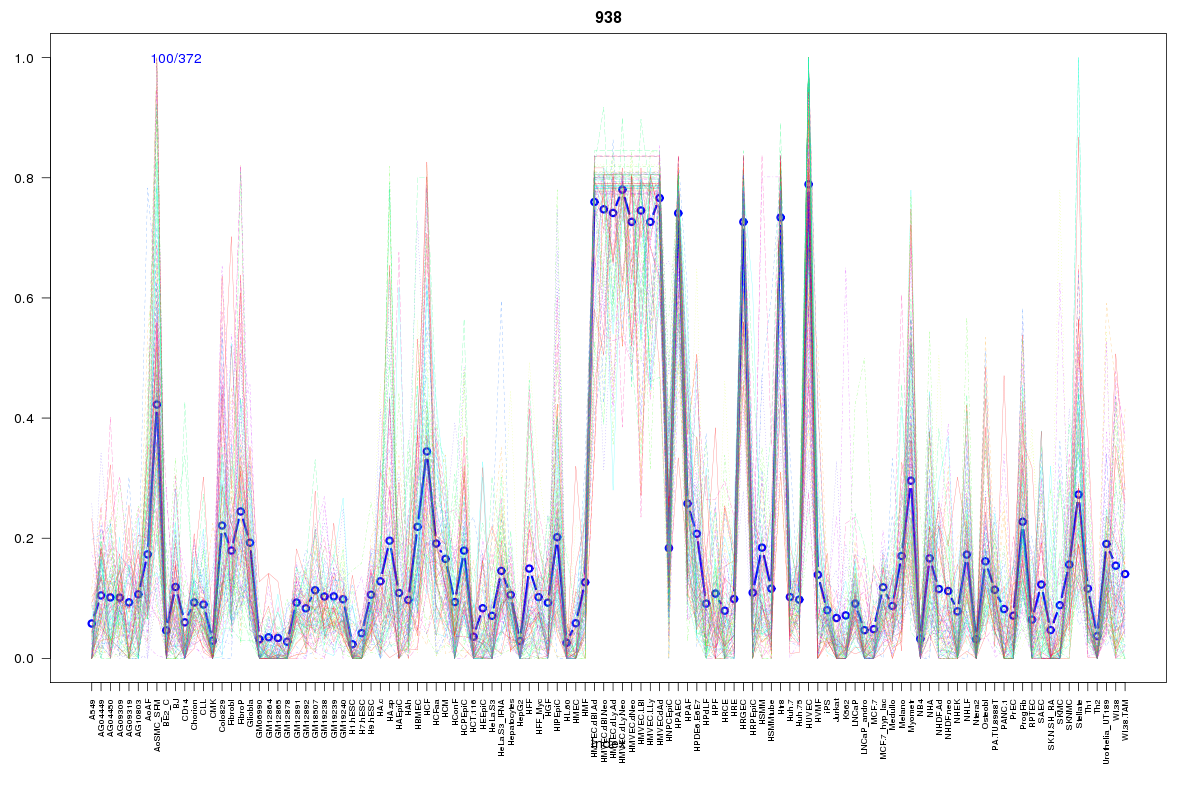 | 938 | 1 |
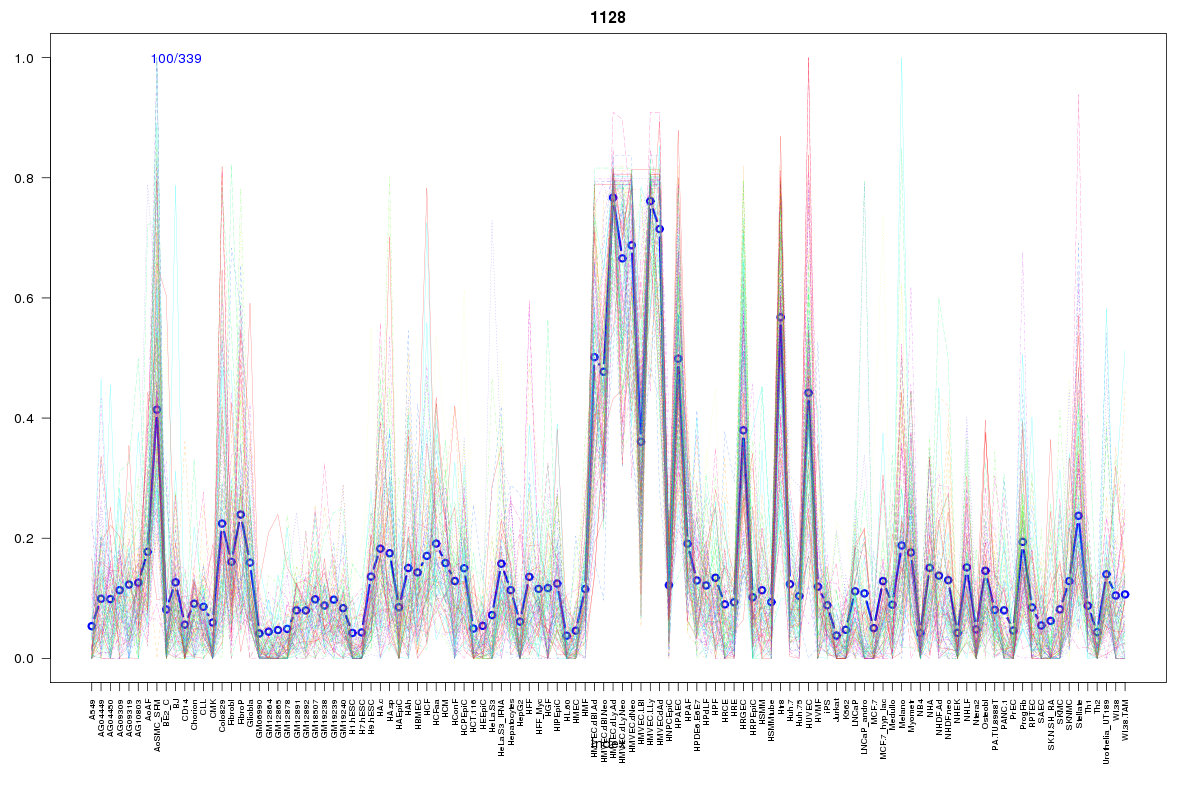 | 1128 | 1 |
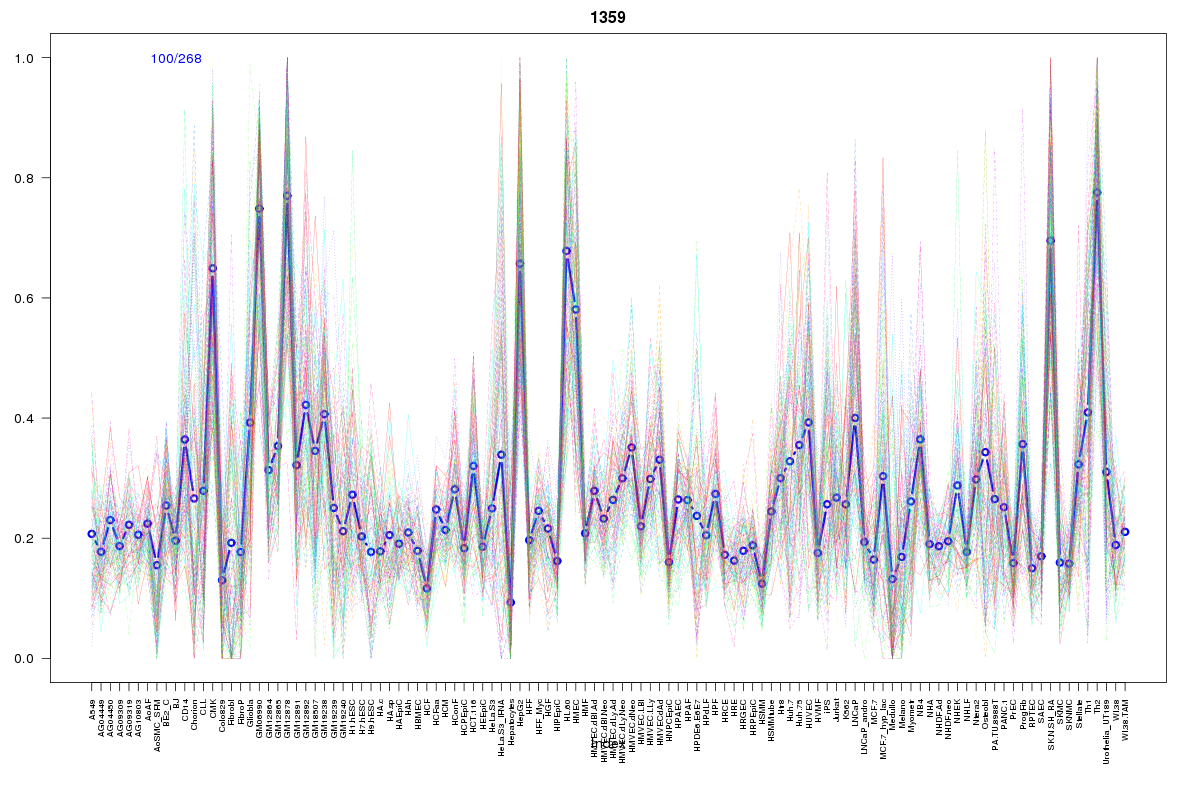 | 1359 | 1 |
 | 934 | 1 |
 | 687 | 1 |
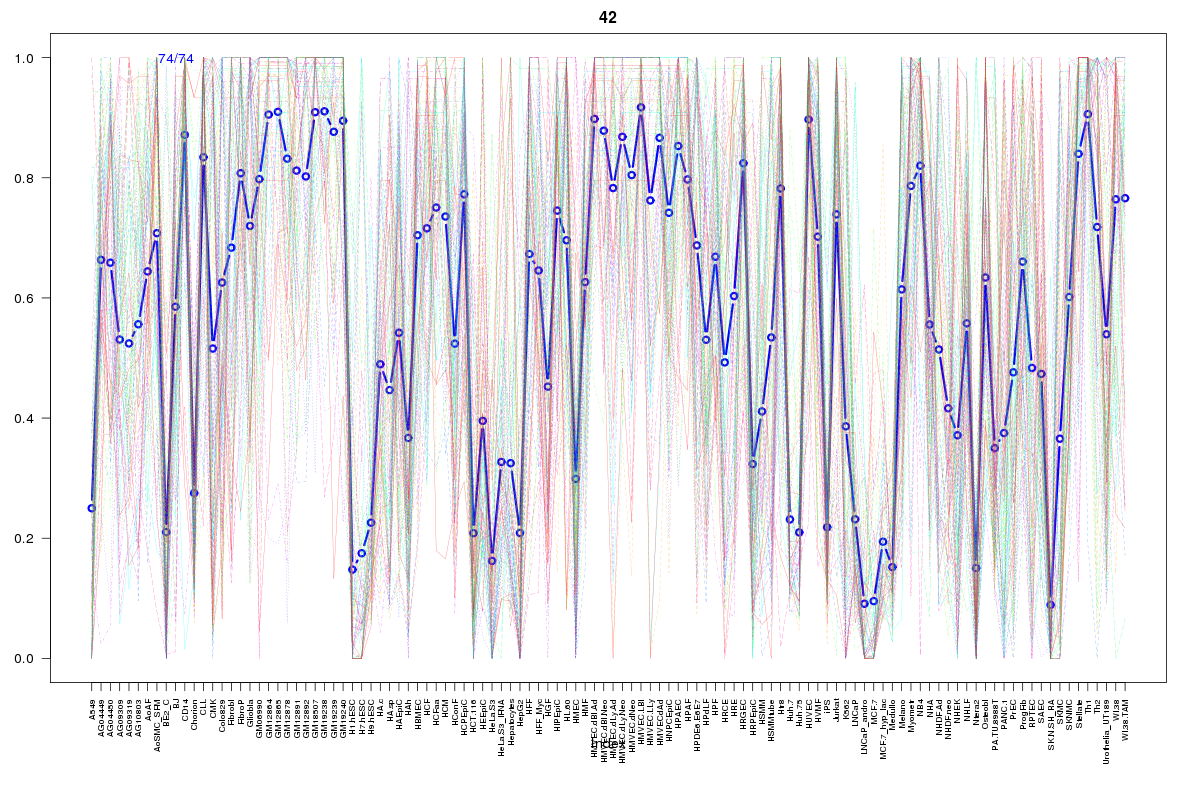 | 42 | 1 |
 | 935 | 1 |
Resources
BED file downloads
Connects to 10 DHS sitesTop 10 Correlated DHS Sites
p-values indiciate significant higher or lower correlation| Location | Cluster | P-value |
|---|---|---|
| chr8:52796800-52796950 | 938 | 0 |
| chr8:52797140-52797290 | 1128 | 0 |
| chr8:52874840-52874990 | 42 | 0.006 |
| chr8:52886500-52886650 | 935 | 0.014 |
| chr8:52763160-52763310 | 1291 | 0.015 |
| chr8:52771600-52771750 | 1783 | 0.015 |
| chr8:52862680-52862830 | 687 | 0.016 |
| chr8:52856520-52856670 | 934 | 0.019 |
| chr8:52771420-52771570 | 1795 | 0.023 |
| chr8:52812100-52812250 | 1359 | 0.013 |
External Databases
UCSCEnsembl (ENSG00000168300)