Gene: ZEB1-AS1
chr10: 31495206-31608620Expression Profile
(log scale)
Graphical Connections
Distribution of linked clusters:
You may find it interesting if many of the connected DHS sites belong to the same cluster.| Cluster Profile | Cluster ID | Number of DHS sites in this cluster |
|---|---|---|
 | 66 | 1 |
 | 15 | 1 |
 | 264 | 1 |
 | 220 | 1 |
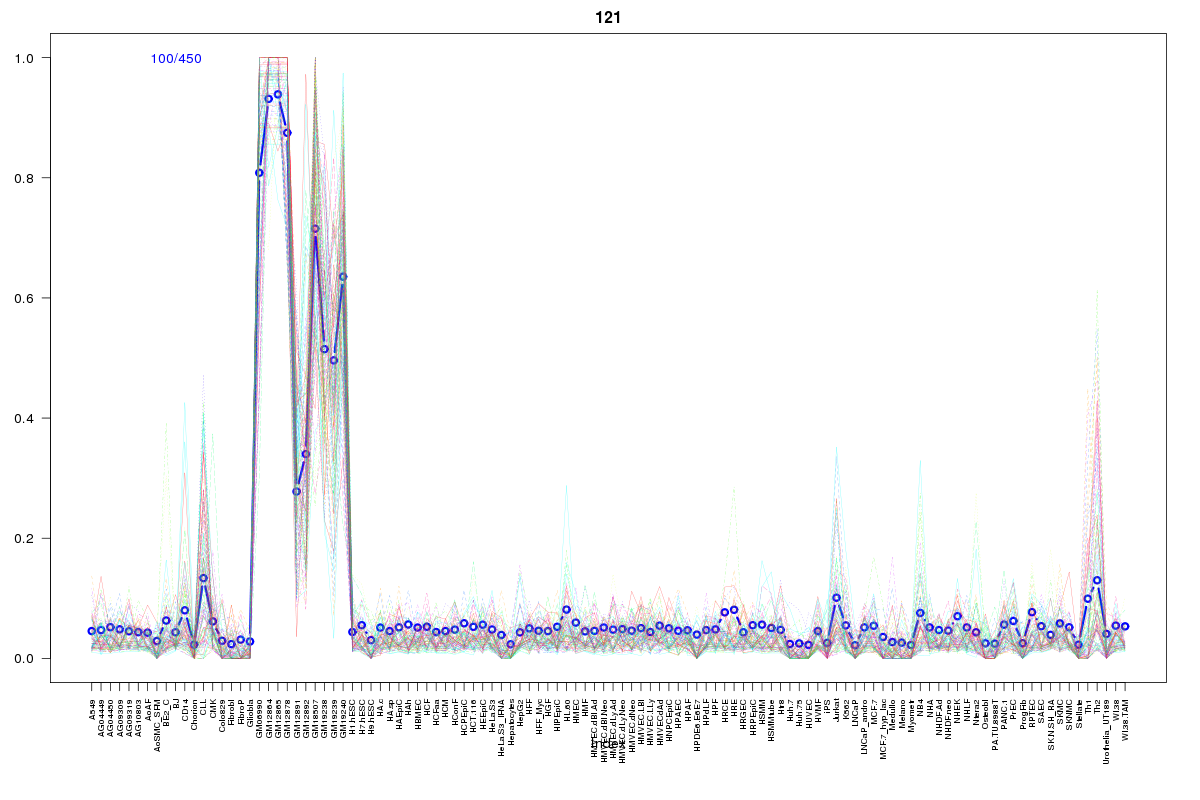 | 121 | 1 |
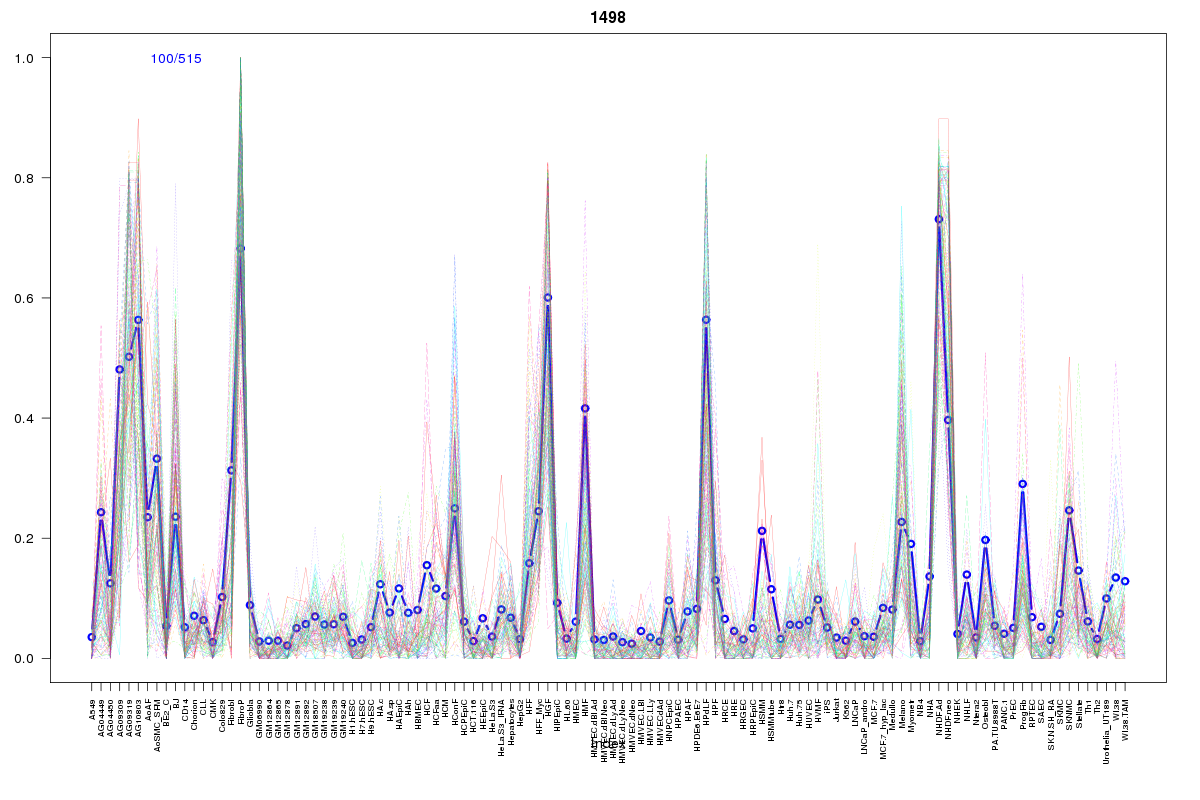 | 1498 | 1 |
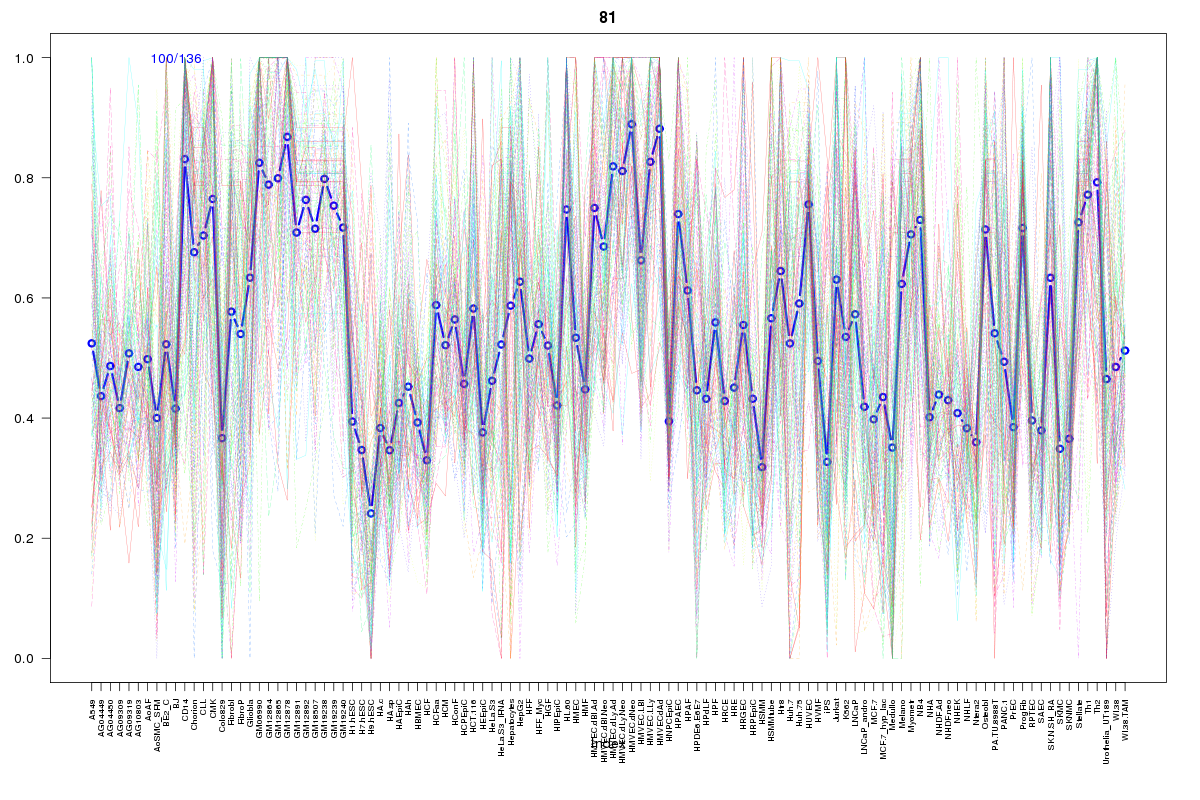 | 81 | 1 |
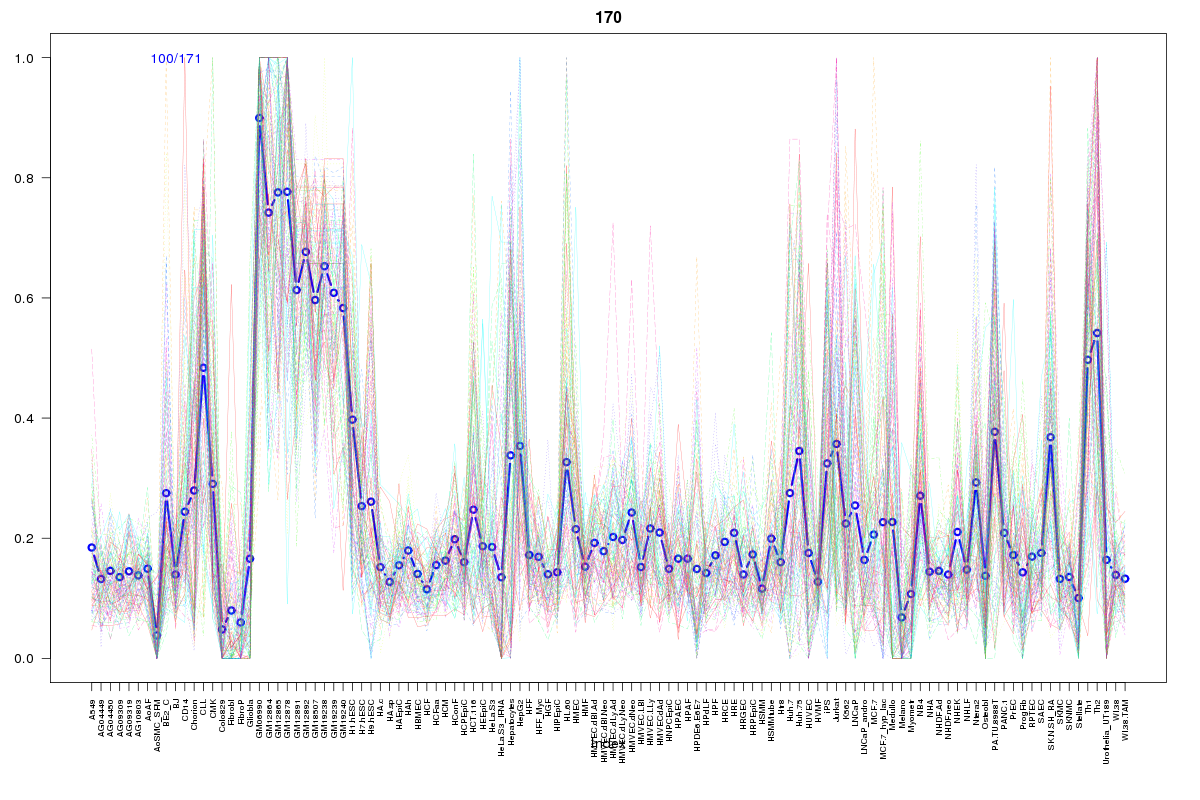 | 170 | 1 |
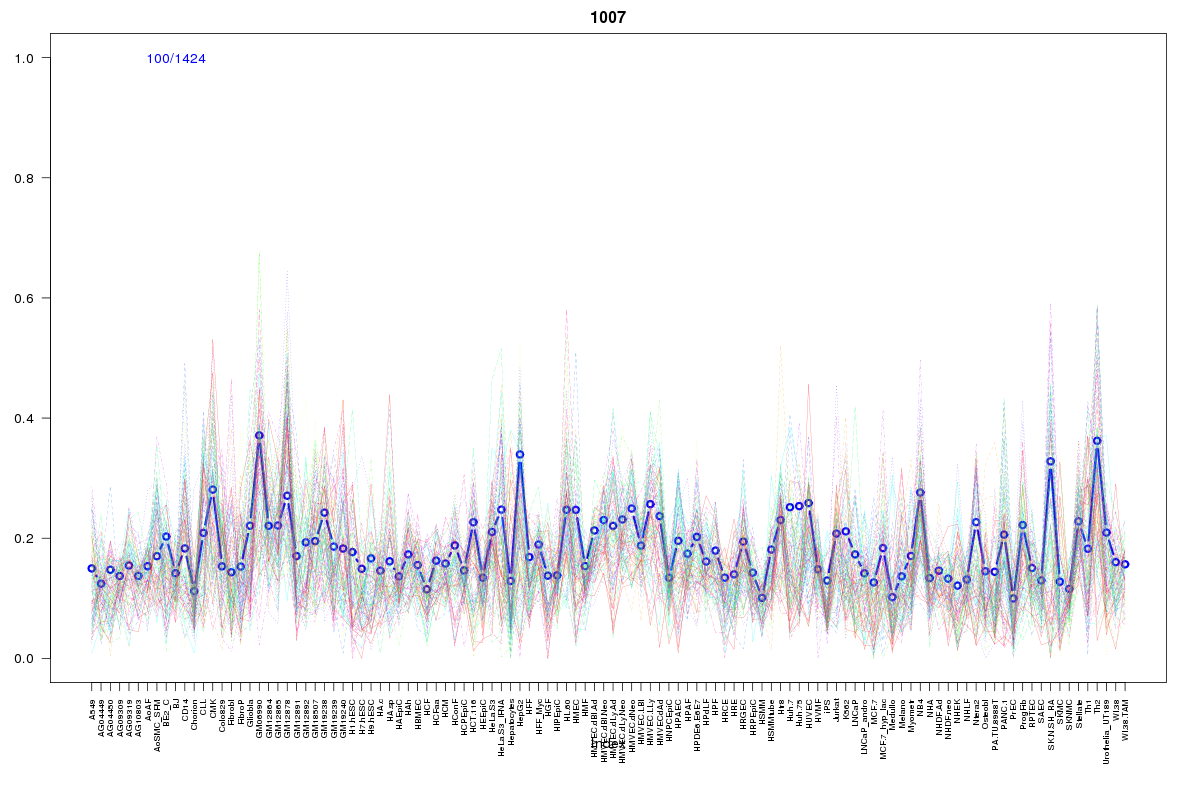 | 1007 | 1 |
 | 518 | 1 |
Resources
BED file downloads
Connects to 10 DHS sitesTop 10 Correlated DHS Sites
p-values indiciate significant higher or lower correlation| Location | Cluster | P-value |
|---|---|---|
| chr10:31637540-31637690 | 66 | 0 |
| chr10:31611740-31611890 | 1007 | 0.001 |
| chr10:31638440-31638590 | 15 | 0.005 |
| chr10:31673160-31673310 | 220 | 0.009 |
| chr10:31630500-31630650 | 518 | 0.009 |
| chr10:31673340-31673490 | 121 | 0.013 |
| chr10:31578020-31578170 | 1498 | 0.017 |
| chr10:31609260-31609410 | 170 | 0.019 |
| chr10:31607260-31607410 | 81 | 0.02 |
| chr10:31671000-31671150 | 264 | 0.024 |
External Databases
UCSCEnsembl (ENSG00000237036)