Gene: CTD-2647E9.1
chr15: 50086442-50088294Expression Profile
(log scale)
Graphical Connections
Distribution of linked clusters:
You may find it interesting if many of the connected DHS sites belong to the same cluster.| Cluster Profile | Cluster ID | Number of DHS sites in this cluster |
|---|---|---|
 | 2186 | 2 |
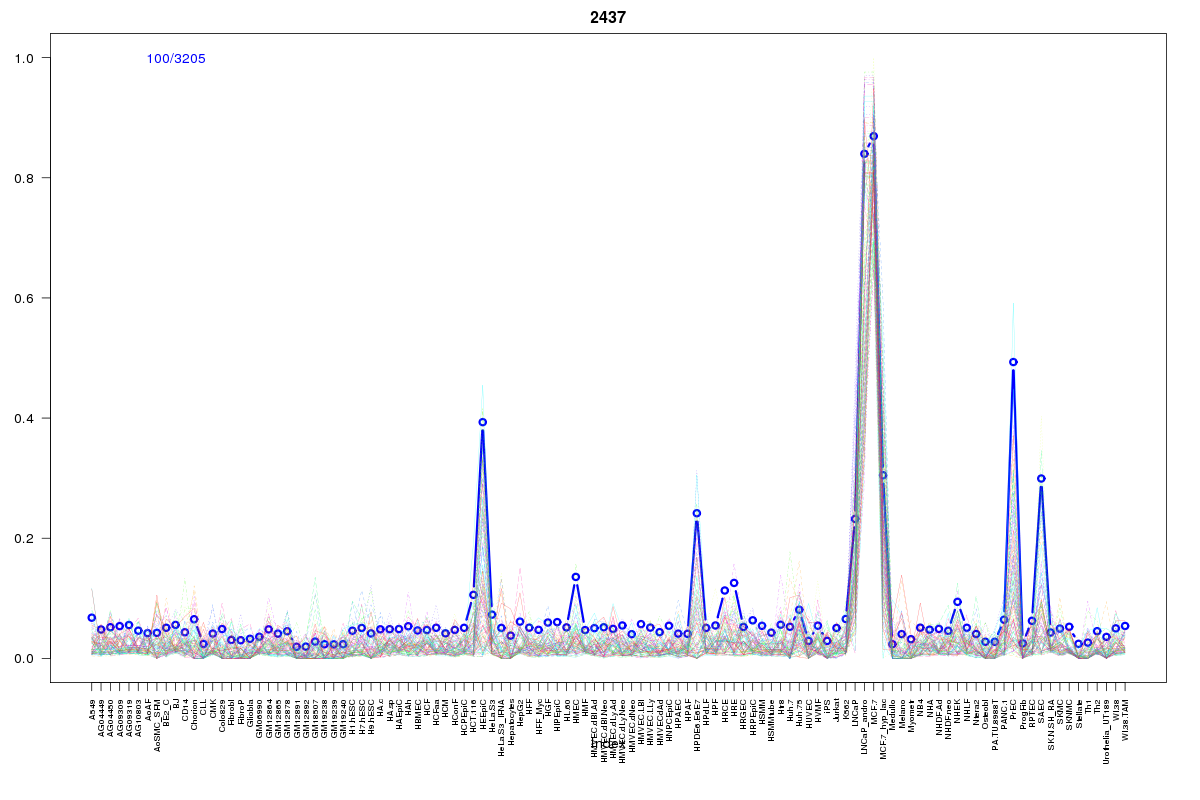 | 2437 | 1 |
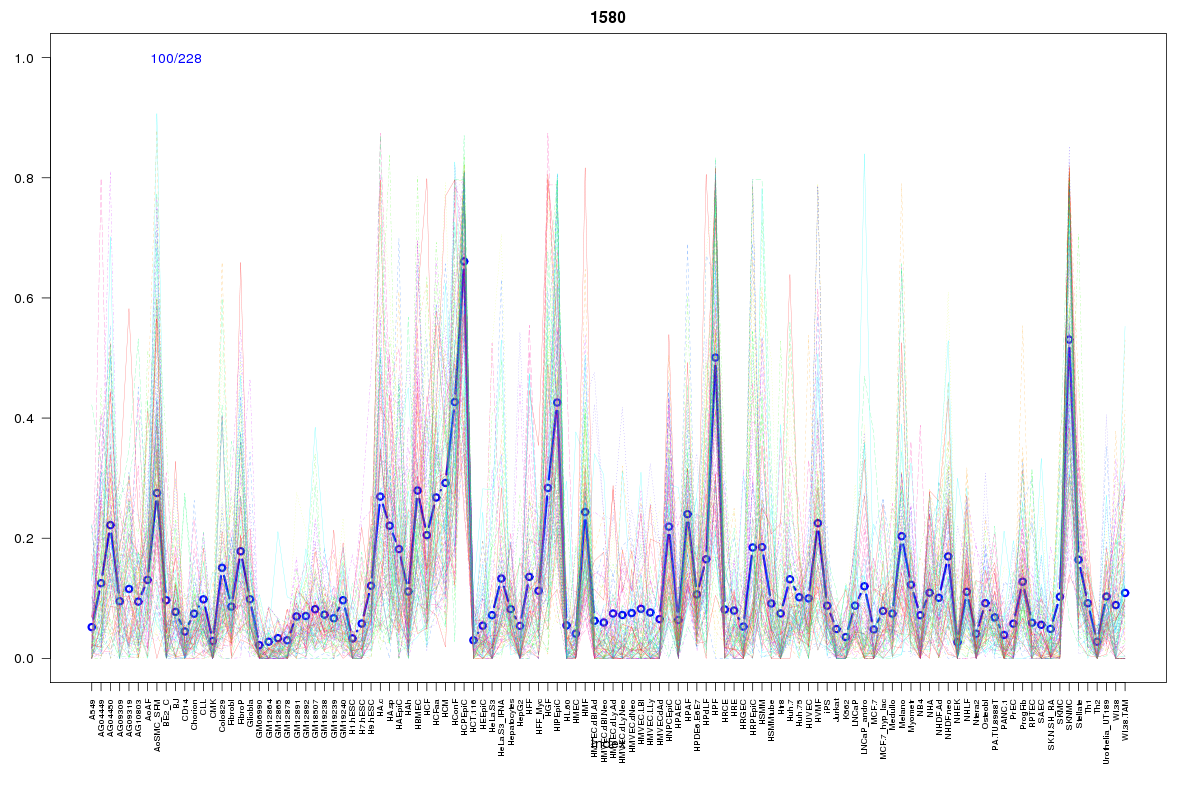 | 1580 | 1 |
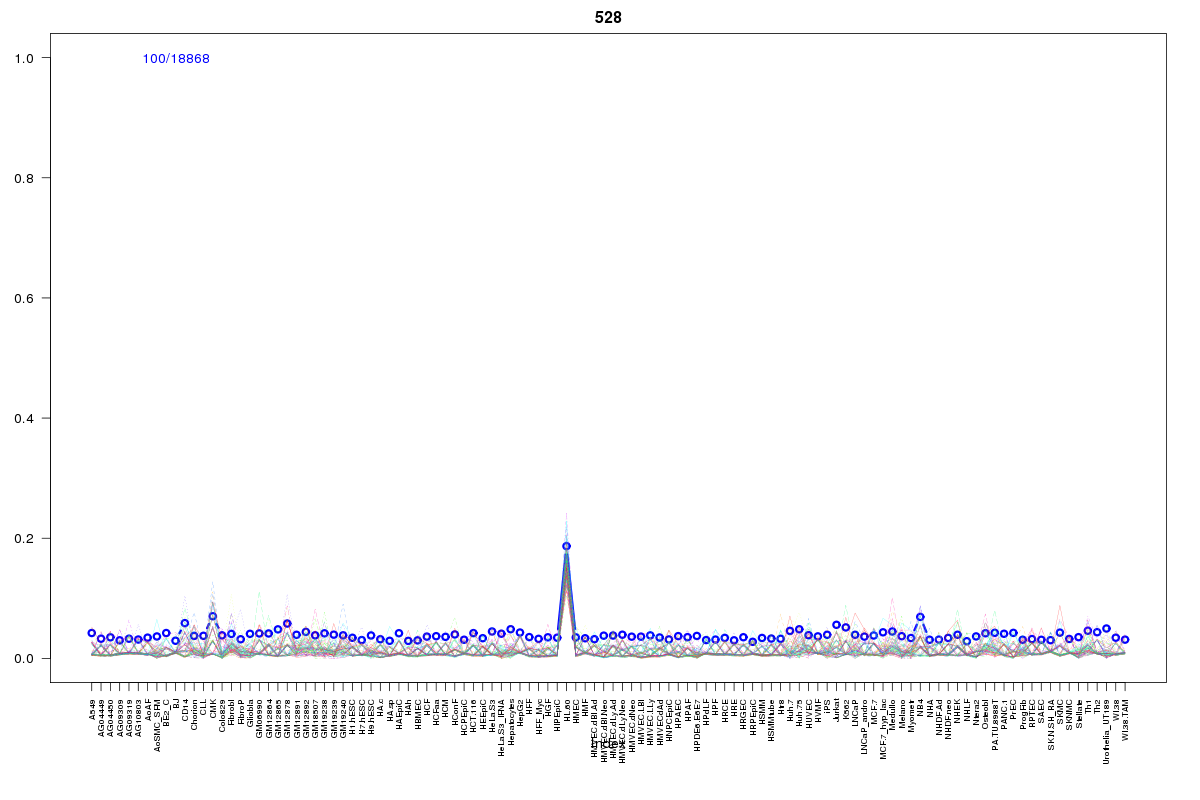 | 528 | 1 |
 | 862 | 1 |
Resources
BED file downloads
Connects to 6 DHS sitesTop 10 Correlated DHS Sites
p-values indiciate significant higher or lower correlation| Location | Cluster | P-value |
|---|---|---|
| chr15:50041340-50041490 | 2186 | 0.023 |
| chr15:50172200-50172350 | 862 | 0.023 |
| chr15:50166525-50166675 | 528 | 0.013 |
| chr15:50026440-50026590 | 2437 | 0.01 |
| chr15:50122640-50122790 | 1580 | 0.005 |
| chr15:50076965-50077115 | 2186 | 0.003 |
External Databases
UCSCEnsembl (ENSG00000259388)