Gene: PCAT1
chr8: 127859299-128025958Expression Profile
(log scale)
Graphical Connections
Distribution of linked clusters:
You may find it interesting if many of the connected DHS sites belong to the same cluster.| Cluster Profile | Cluster ID | Number of DHS sites in this cluster |
|---|---|---|
 | 1820 | 5 |
 | 946 | 3 |
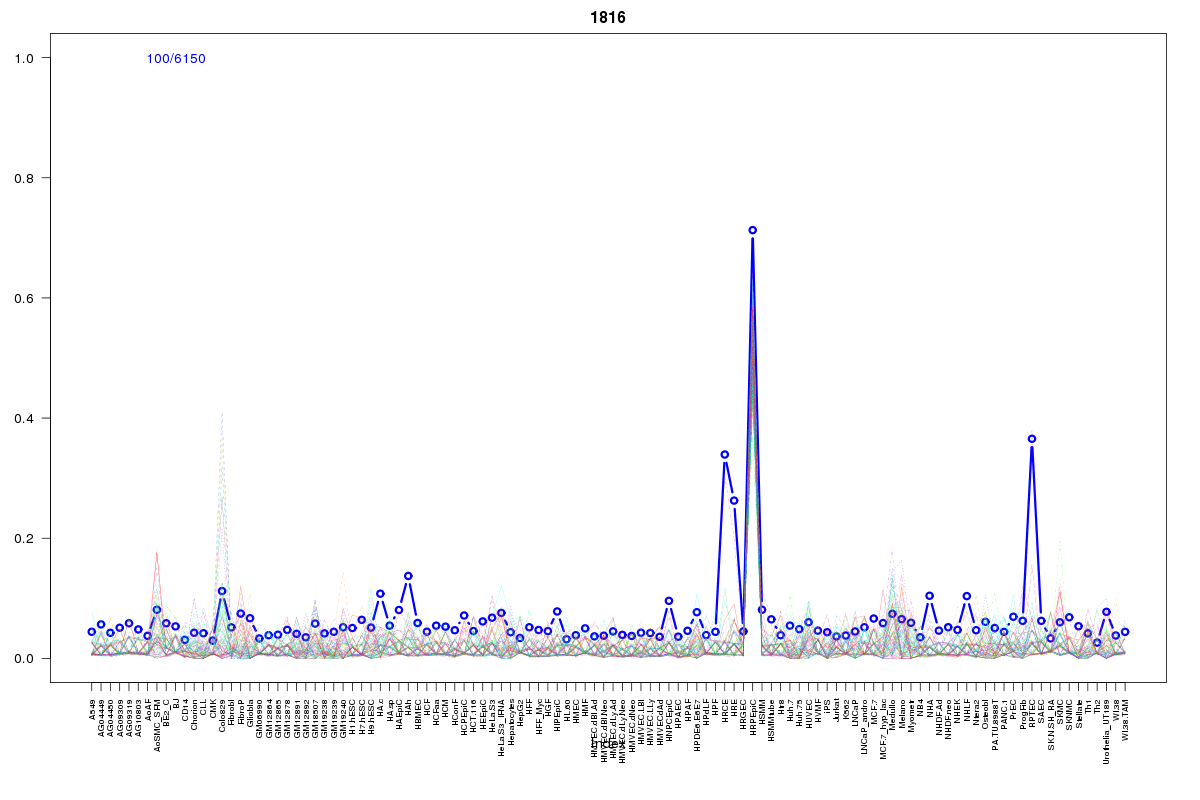 | 1816 | 2 |
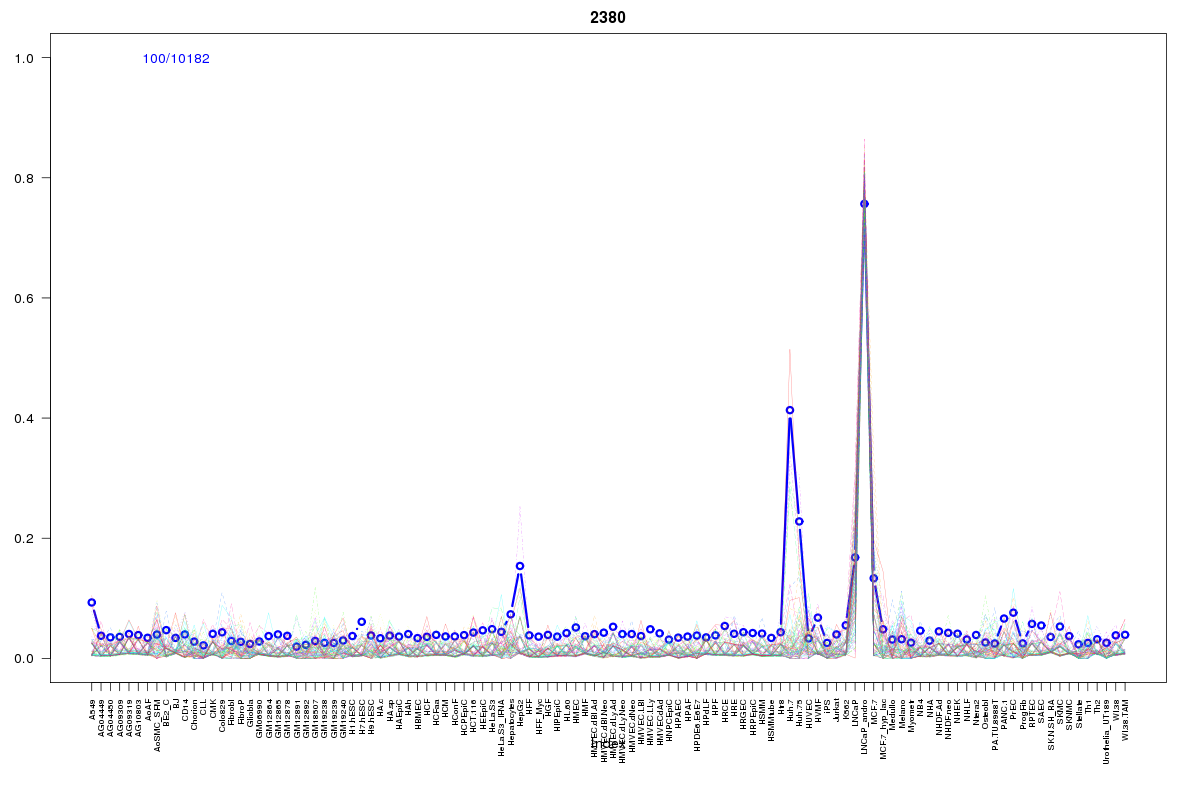 | 2380 | 2 |
 | 1890 | 1 |
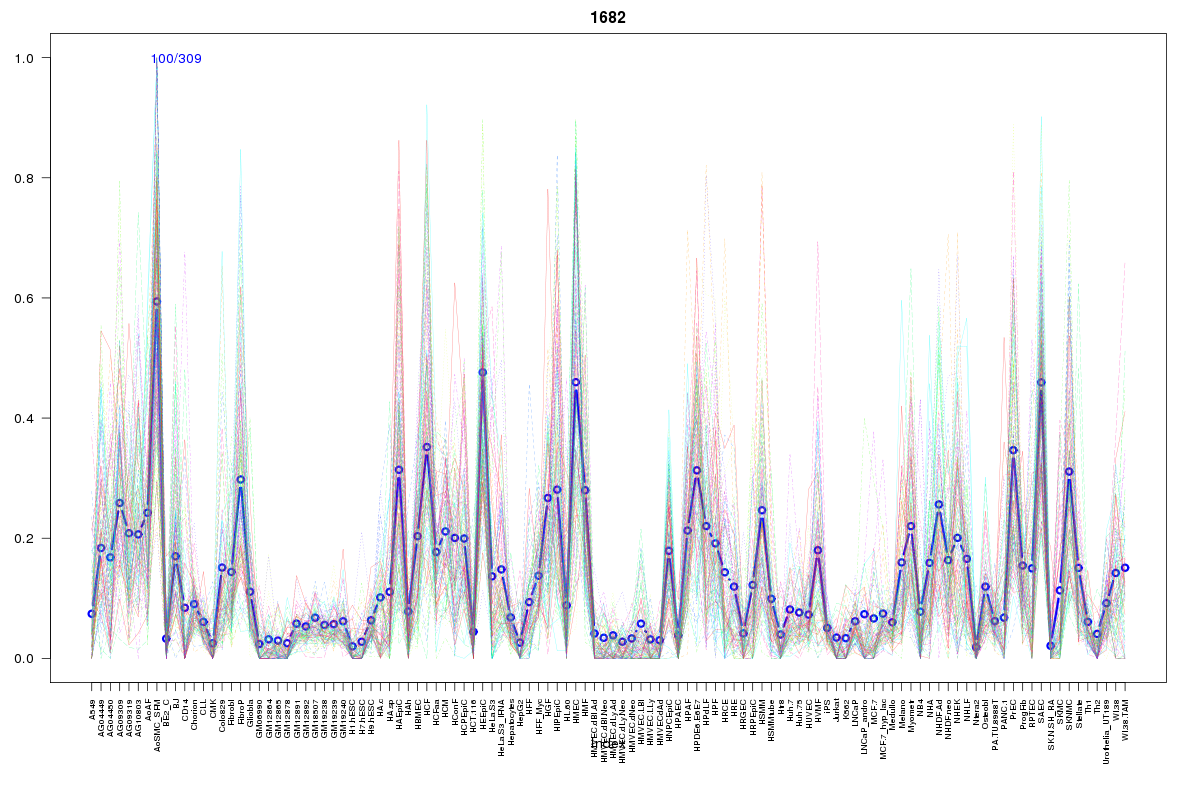 | 1682 | 1 |
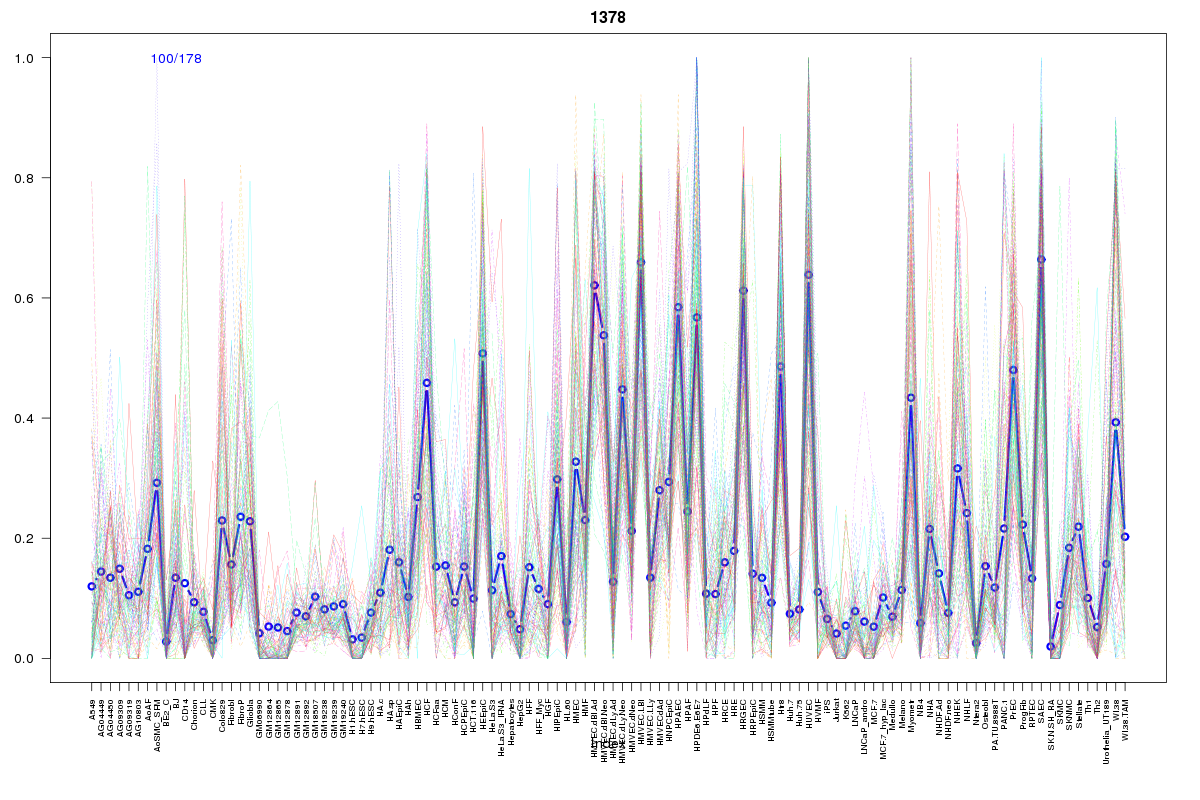 | 1378 | 1 |
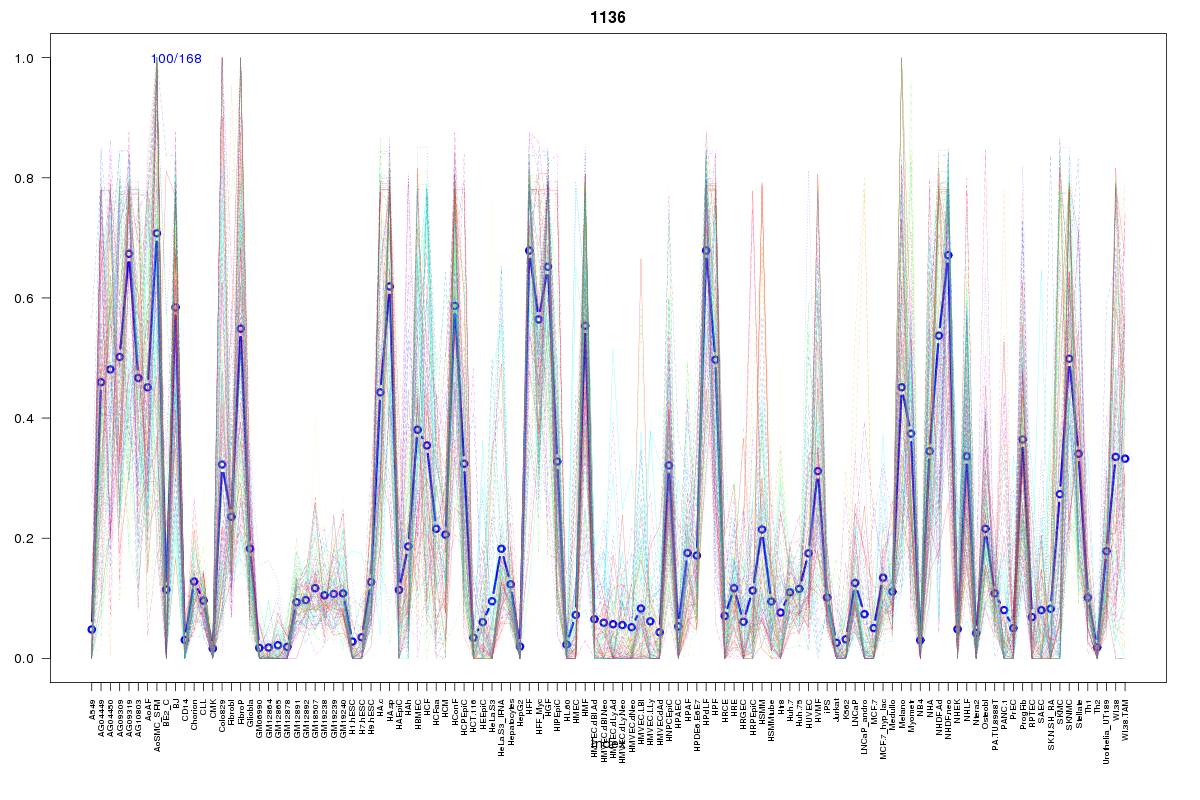 | 1136 | 1 |
 | 2186 | 1 |
 | 1942 | 1 |
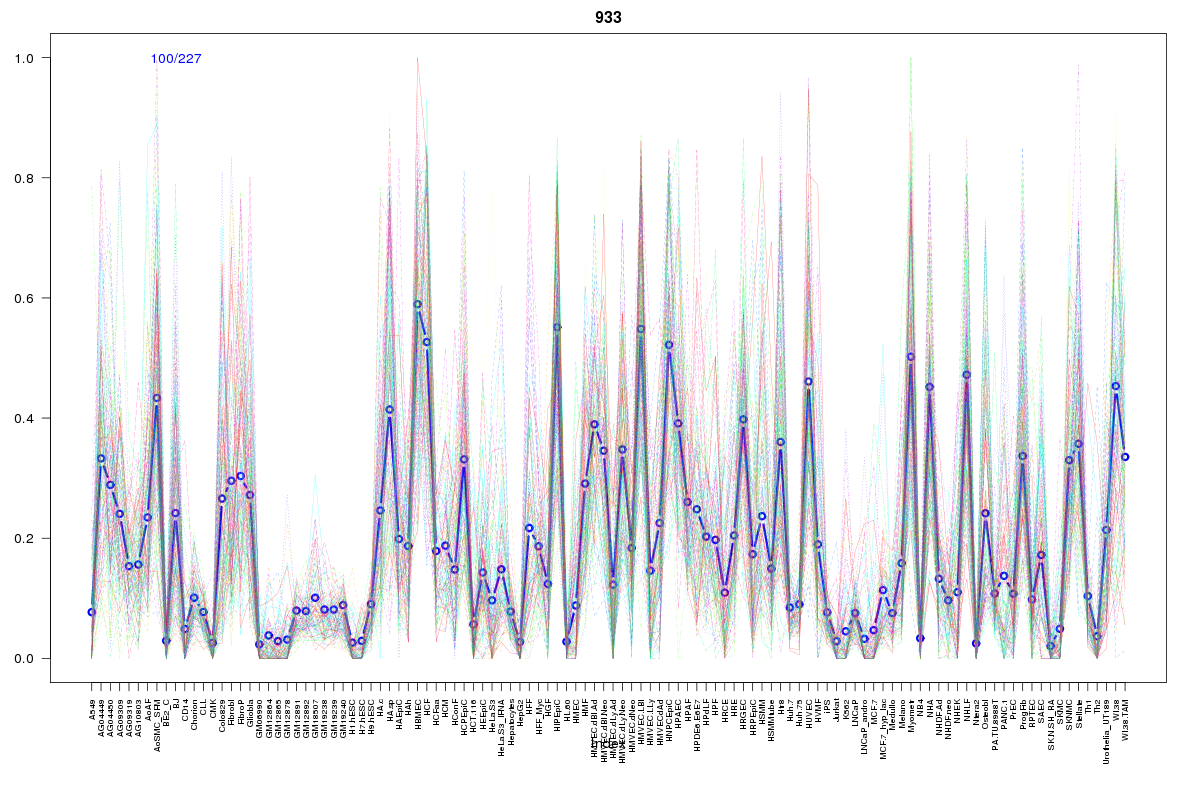 | 933 | 1 |
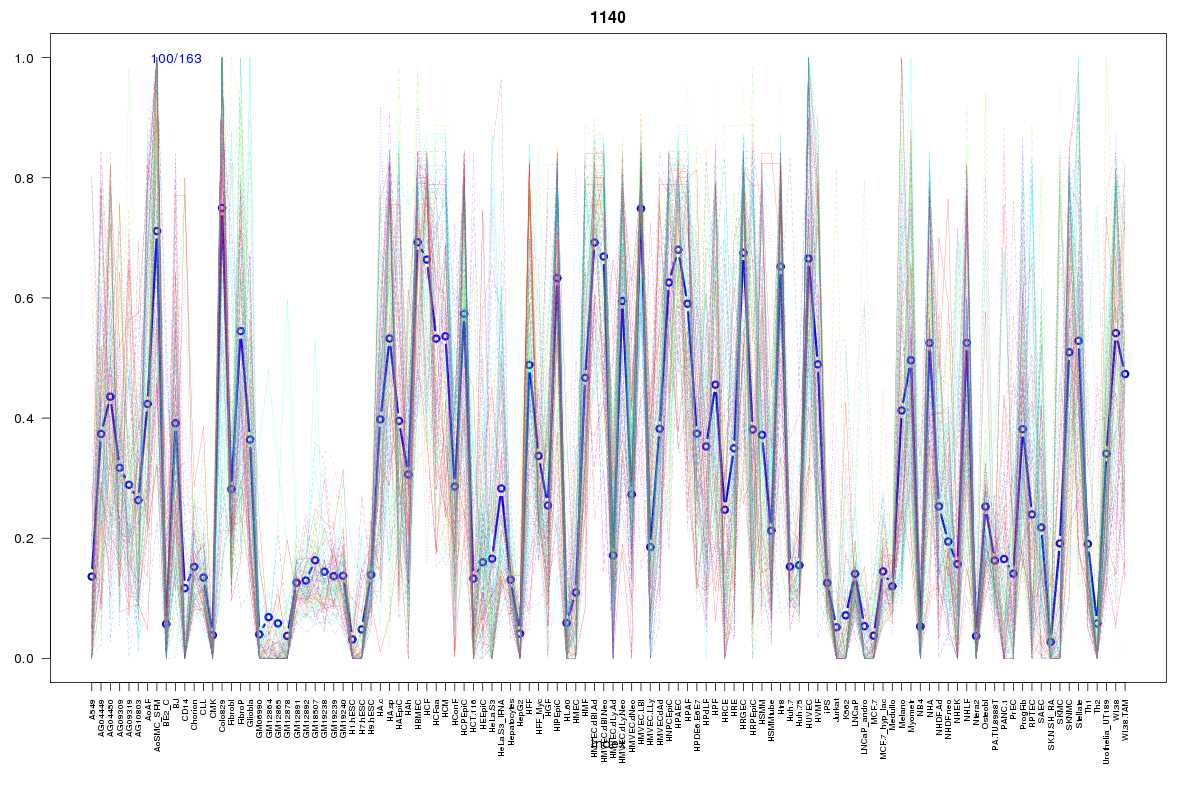 | 1140 | 1 |
 | 1595 | 1 |
 | 1834 | 1 |
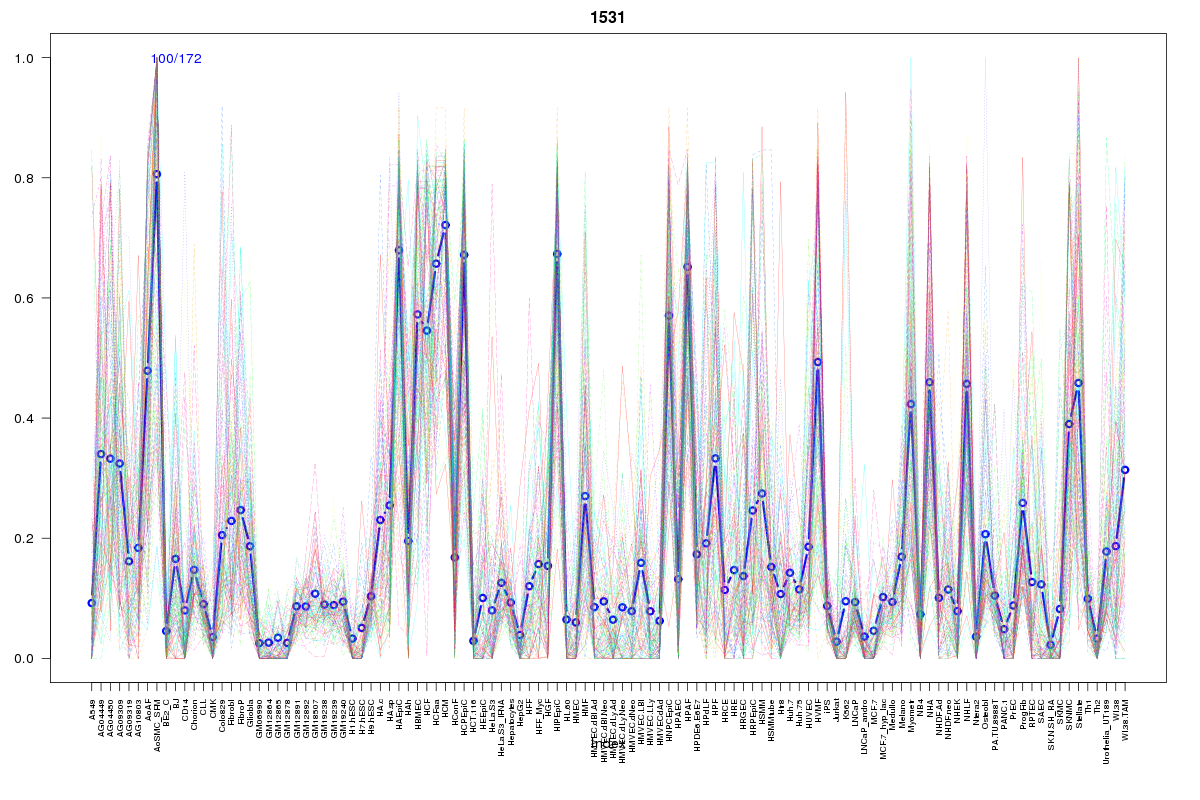 | 1531 | 1 |
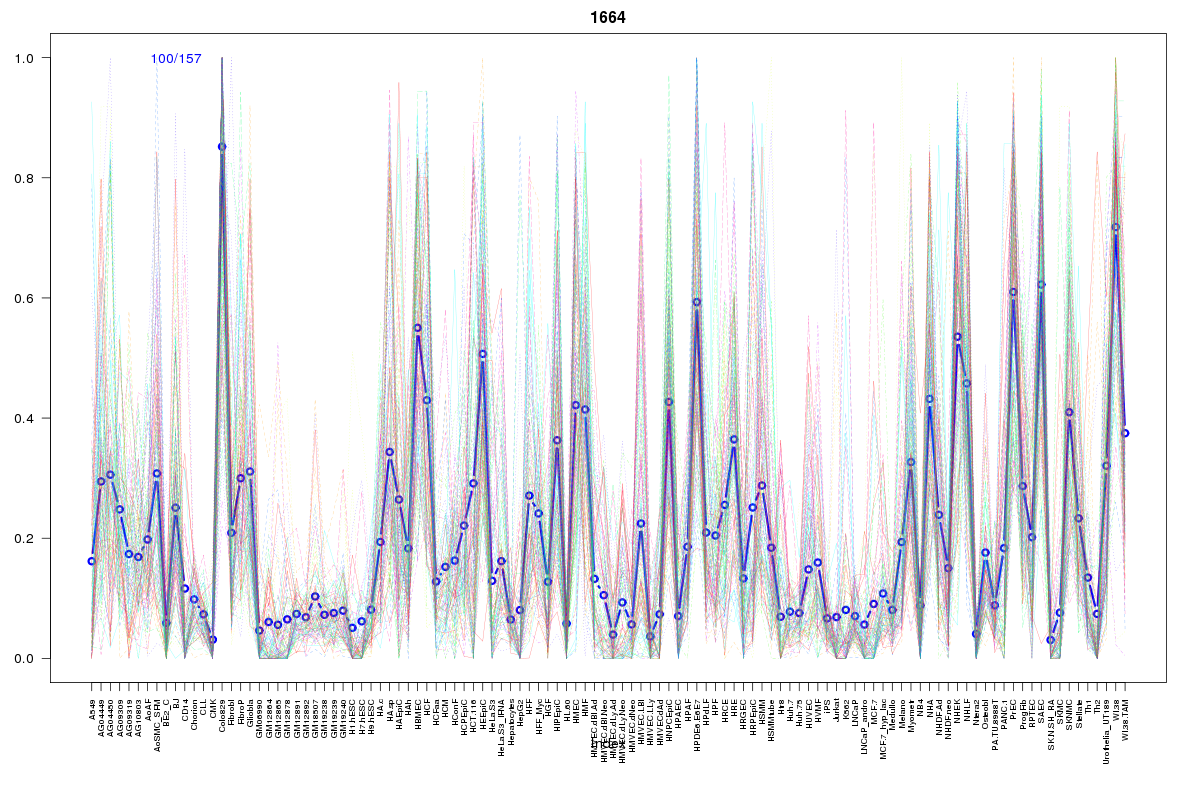 | 1664 | 1 |
 | 520 | 1 |
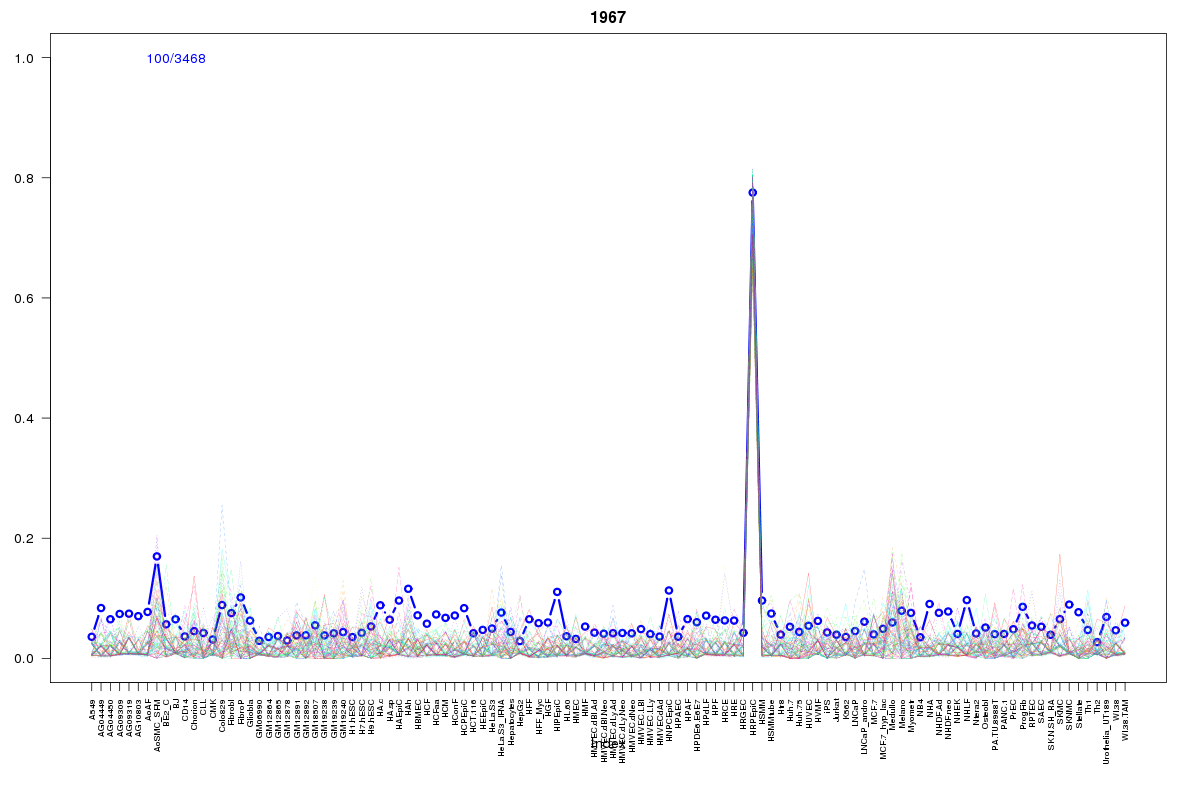 | 1967 | 1 |
 | 2107 | 1 |
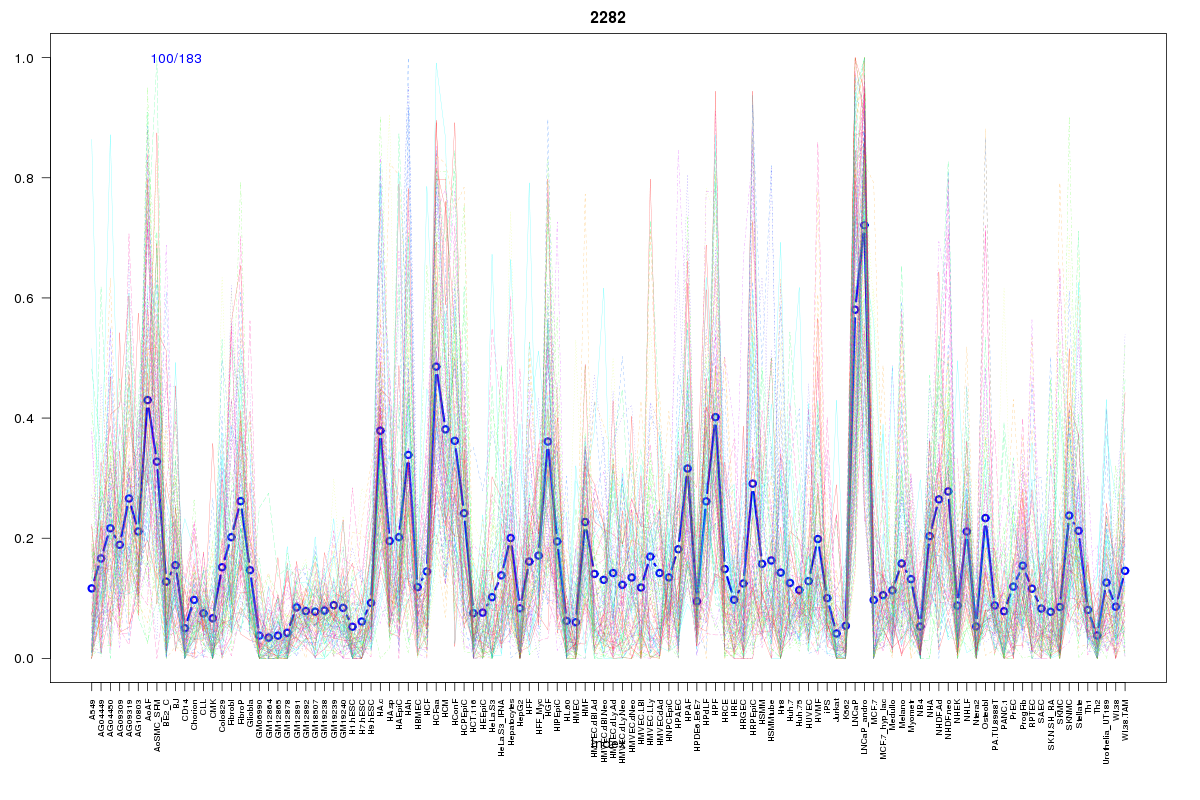 | 2282 | 1 |
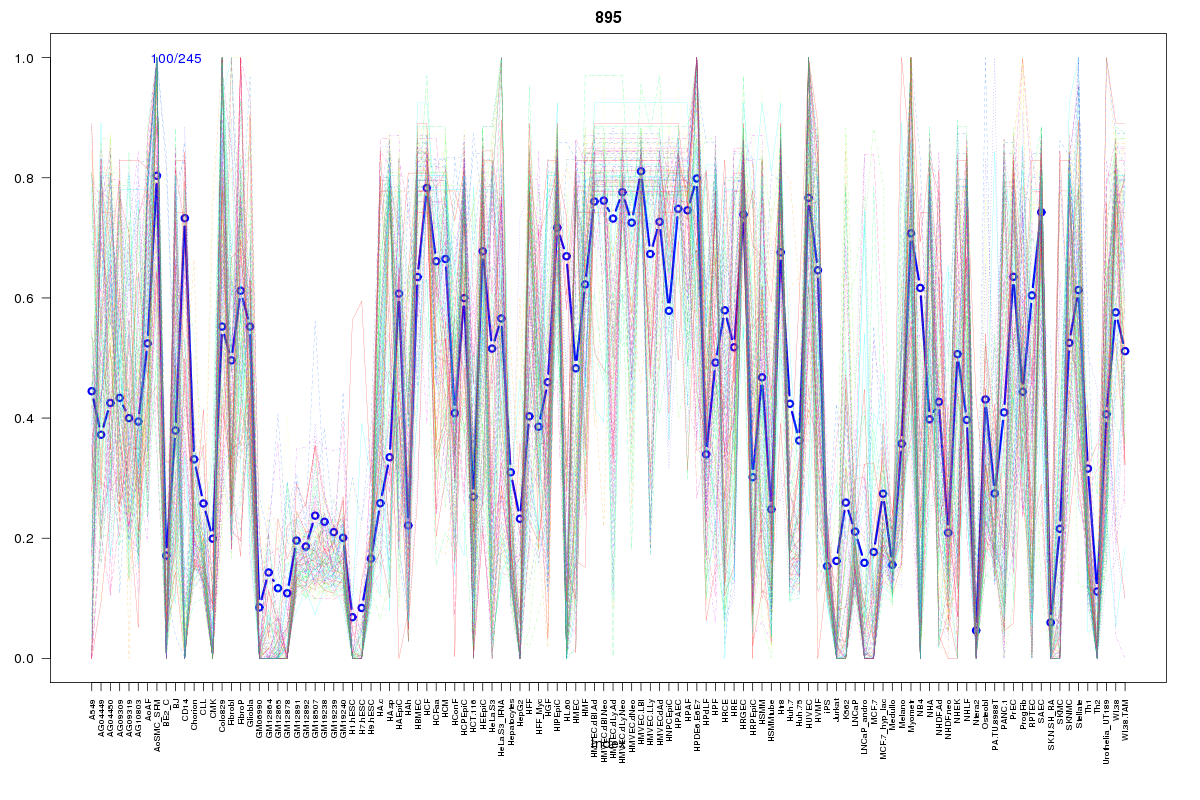 | 895 | 1 |
Resources
BED file downloads
Connects to 29 DHS sitesTop 10 Correlated DHS Sites
p-values indiciate significant higher or lower correlation| Location | Cluster | P-value |
|---|---|---|
| chr8:128018060-128018210 | 1820 | 0 |
| chr8:127971260-127971410 | 1820 | 0.002 |
| chr8:127793840-127793990 | 1820 | 0.003 |
| chr8:128001320-128001470 | 1820 | 0.004 |
| chr8:128095760-128095910 | 1967 | 0.009 |
| chr8:127916780-127916930 | 1820 | 0.012 |
| chr8:127848180-127848330 | 1890 | 0.012 |
| chr8:127852420-127852570 | 1816 | 0.012 |
| chr8:128069100-128069250 | 1816 | 0.013 |
| chr8:128030880-128031030 | 2380 | 0.019 |
| chr8:128114000-128114150 | 2282 | 0.022 |
External Databases
UCSCEnsembl (ENSG00000253438)