Gene: APITD1-CORT
chr1: 10490158-10512210Expression Profile
(log scale)
Graphical Connections
Distribution of linked clusters:
You may find it interesting if many of the connected DHS sites belong to the same cluster.| Cluster Profile | Cluster ID | Number of DHS sites in this cluster |
|---|---|---|
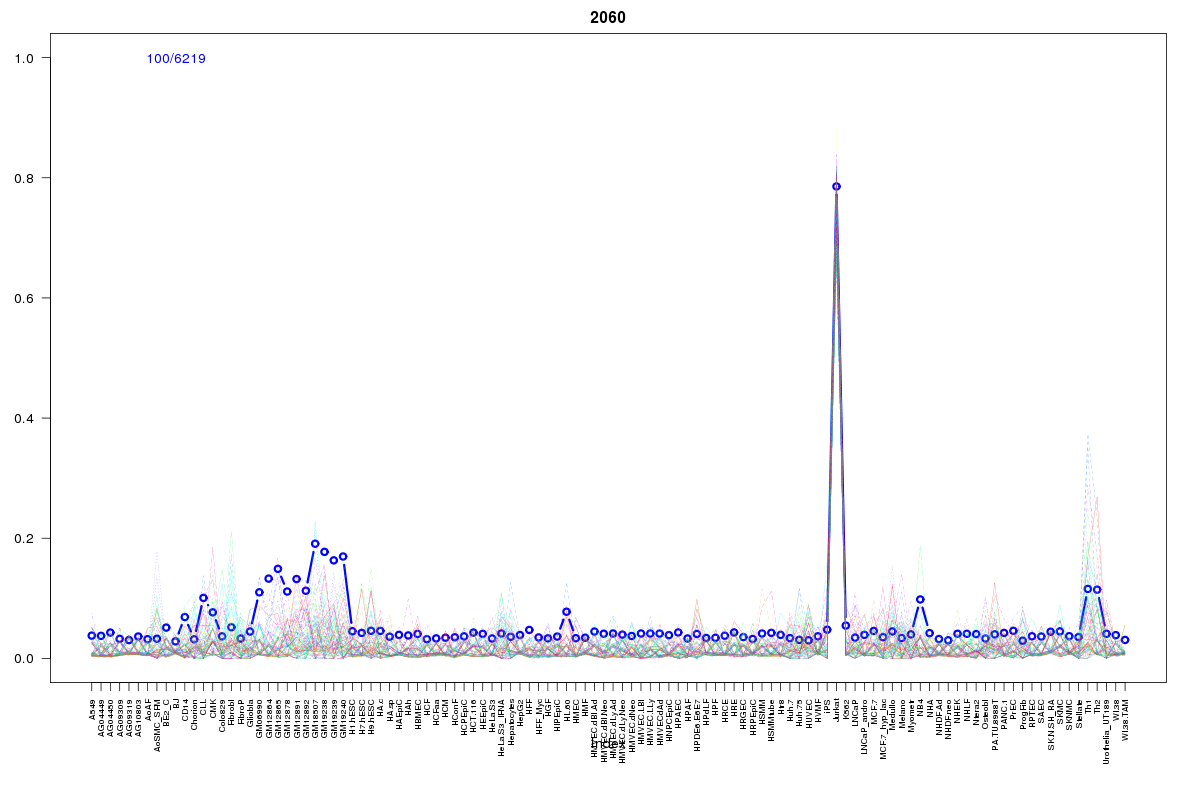 | 2060 | 3 |
 | 2017 | 2 |
 | 2114 | 2 |
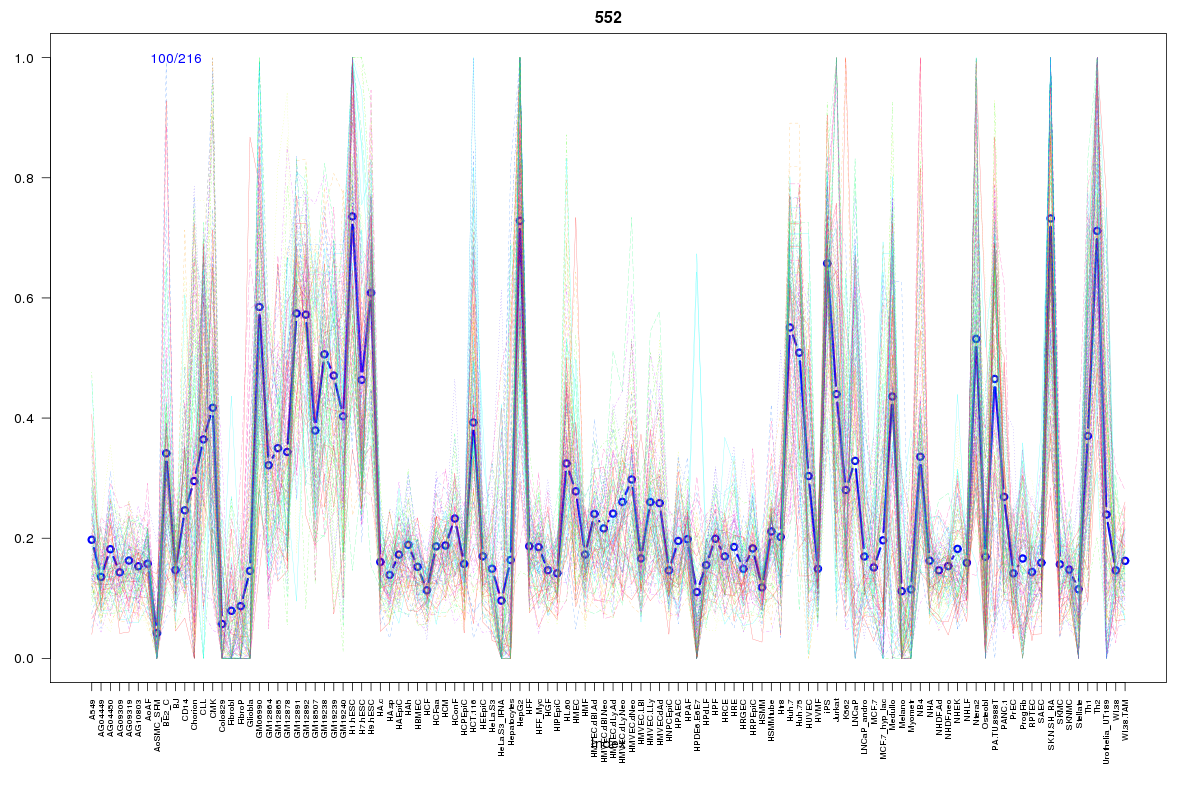 | 552 | 1 |
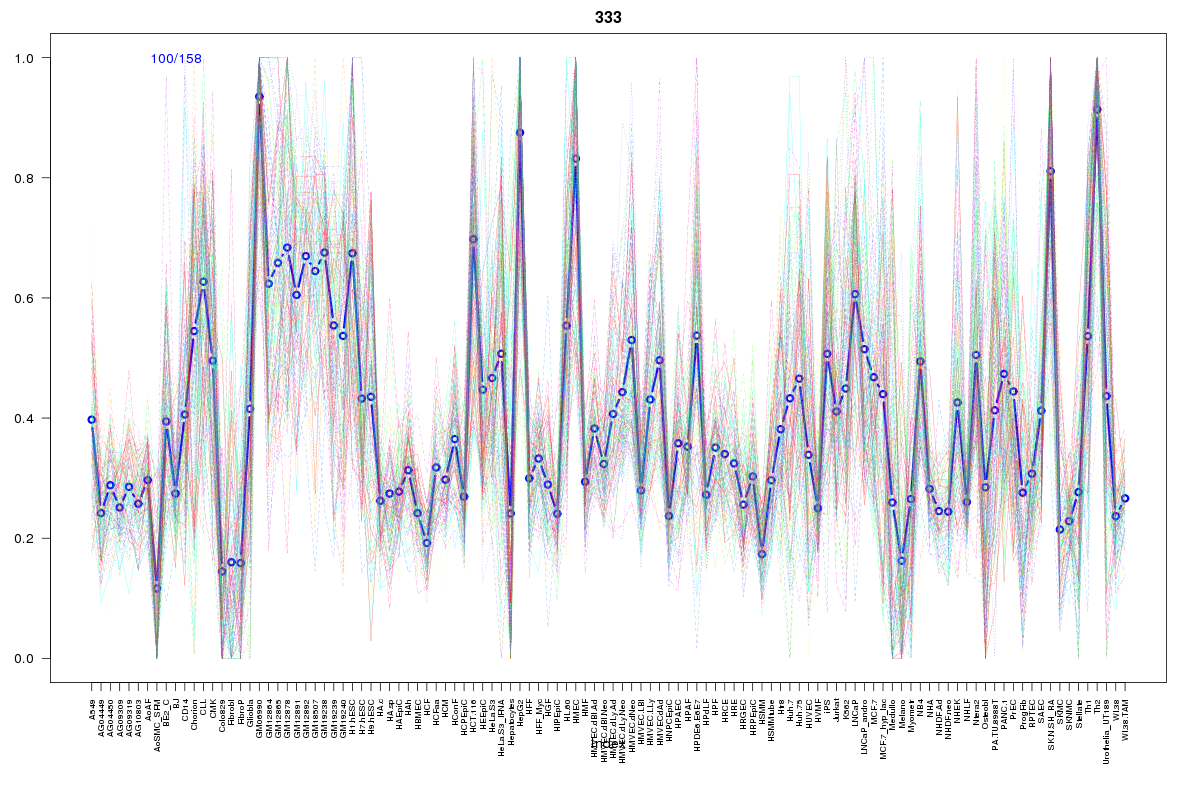 | 333 | 1 |
 | 862 | 1 |
 | 1404 | 1 |
 | 860 | 1 |
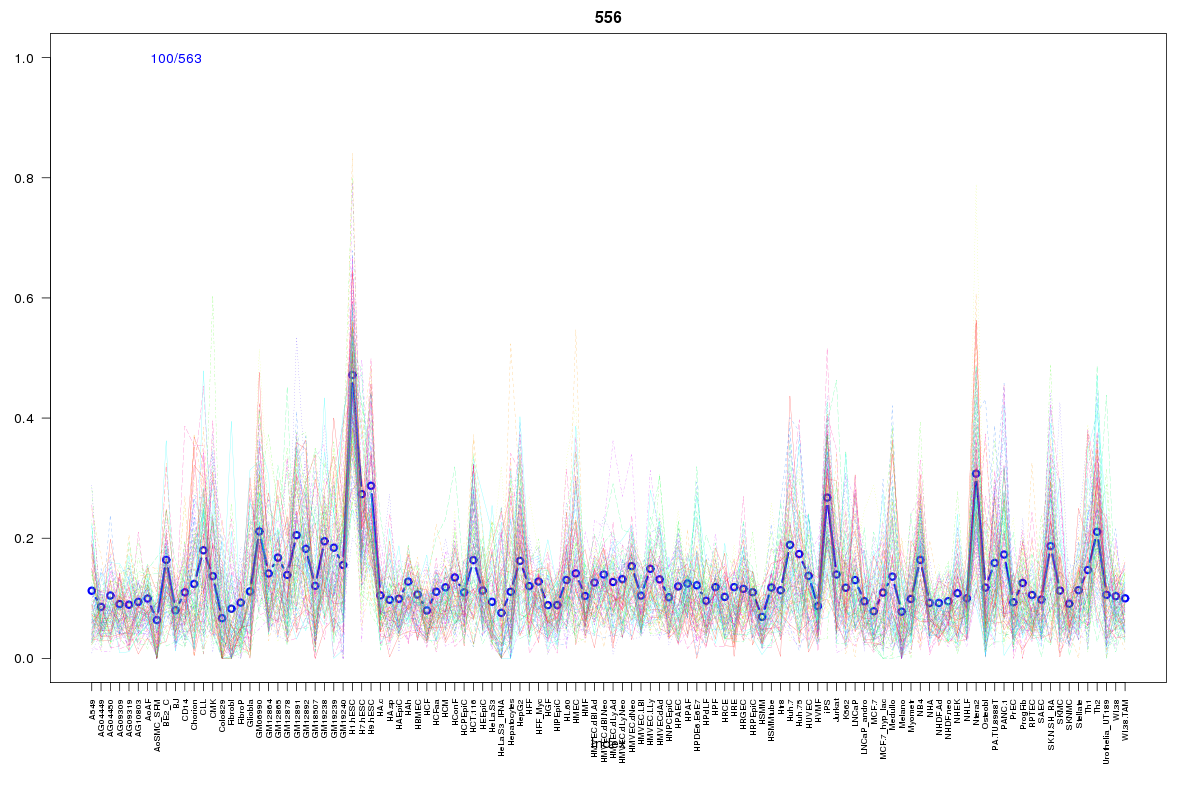 | 556 | 1 |
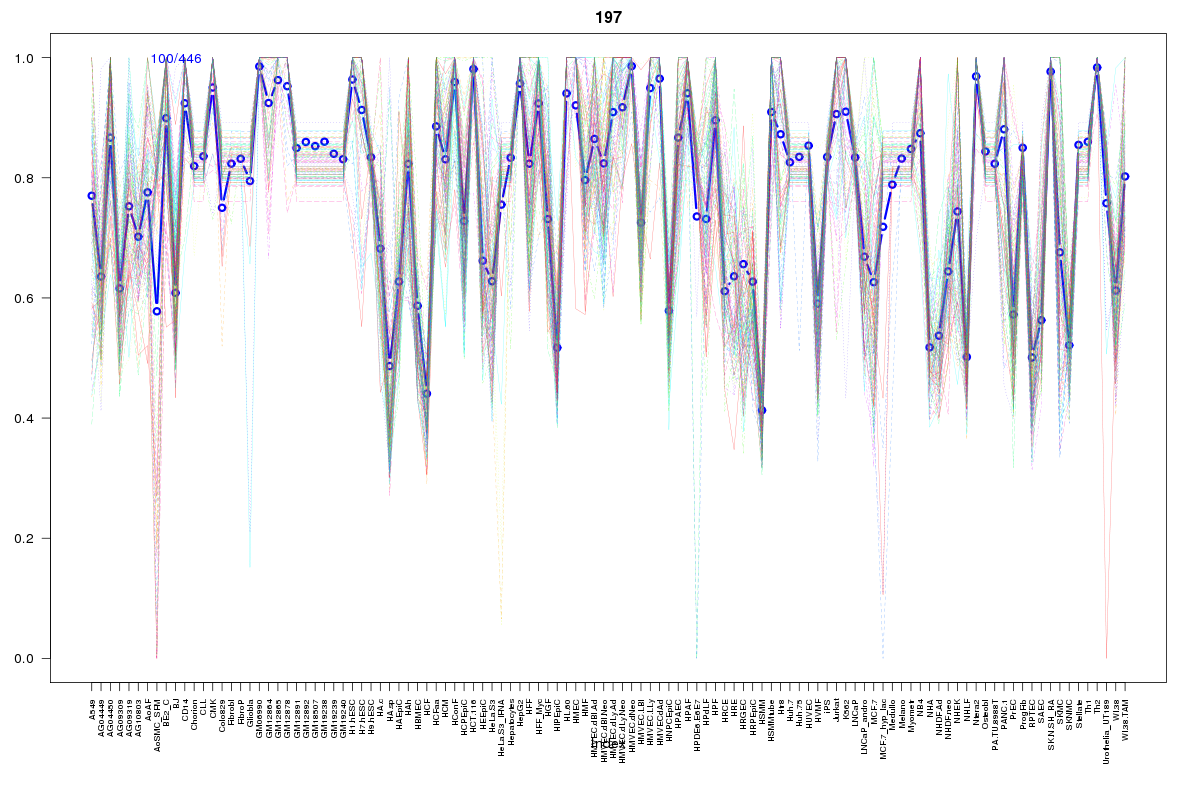 | 197 | 1 |
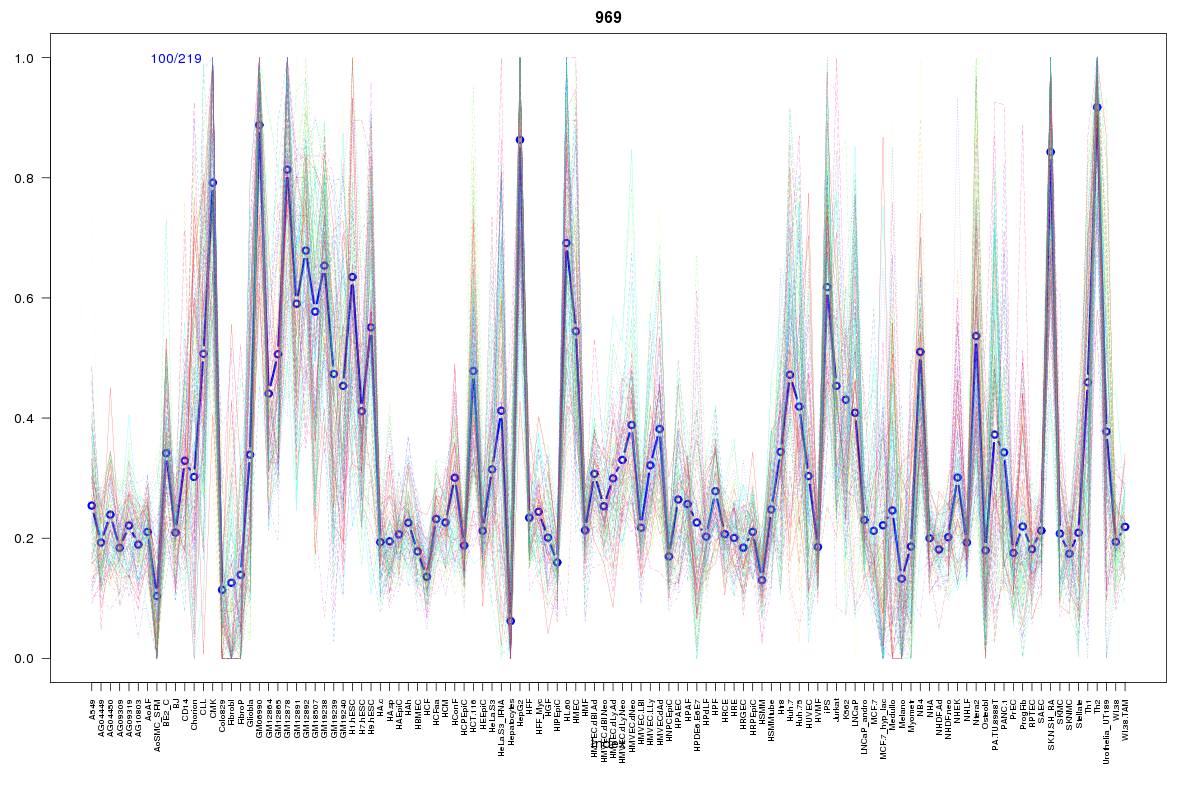 | 969 | 1 |
 | 421 | 1 |
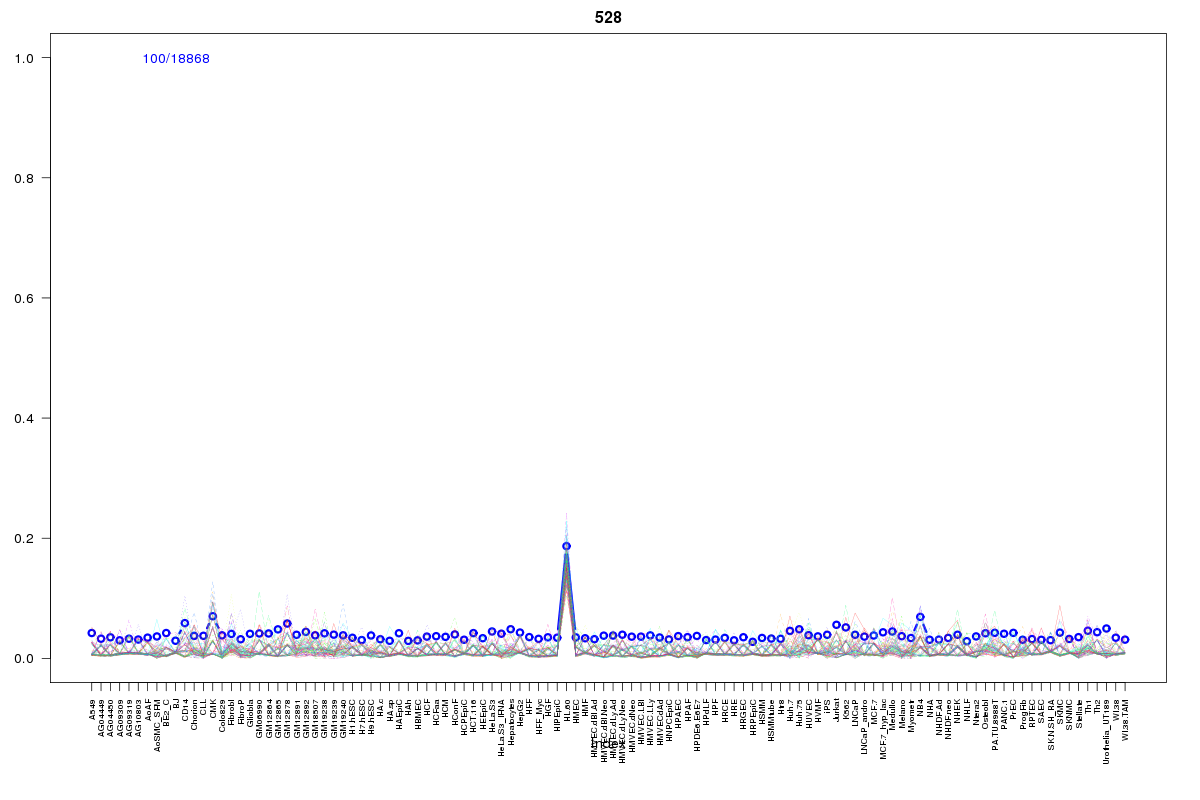 | 528 | 1 |
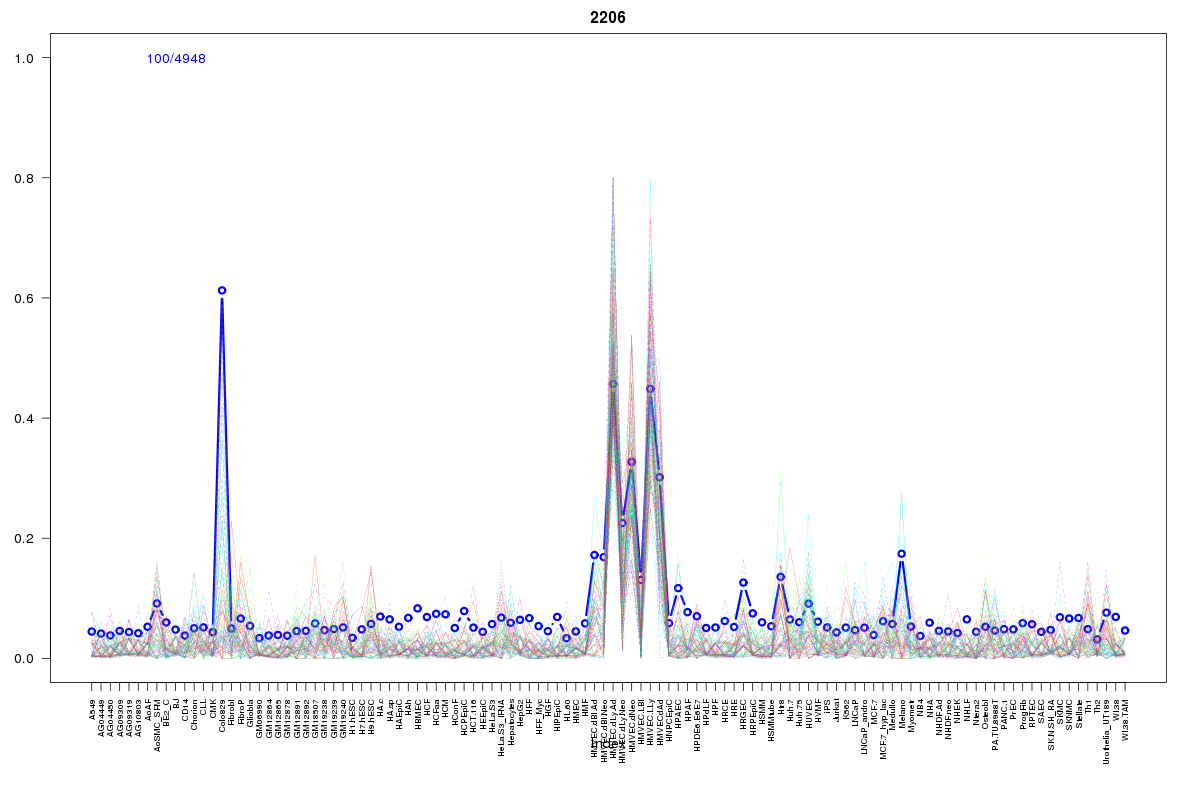 | 2206 | 1 |
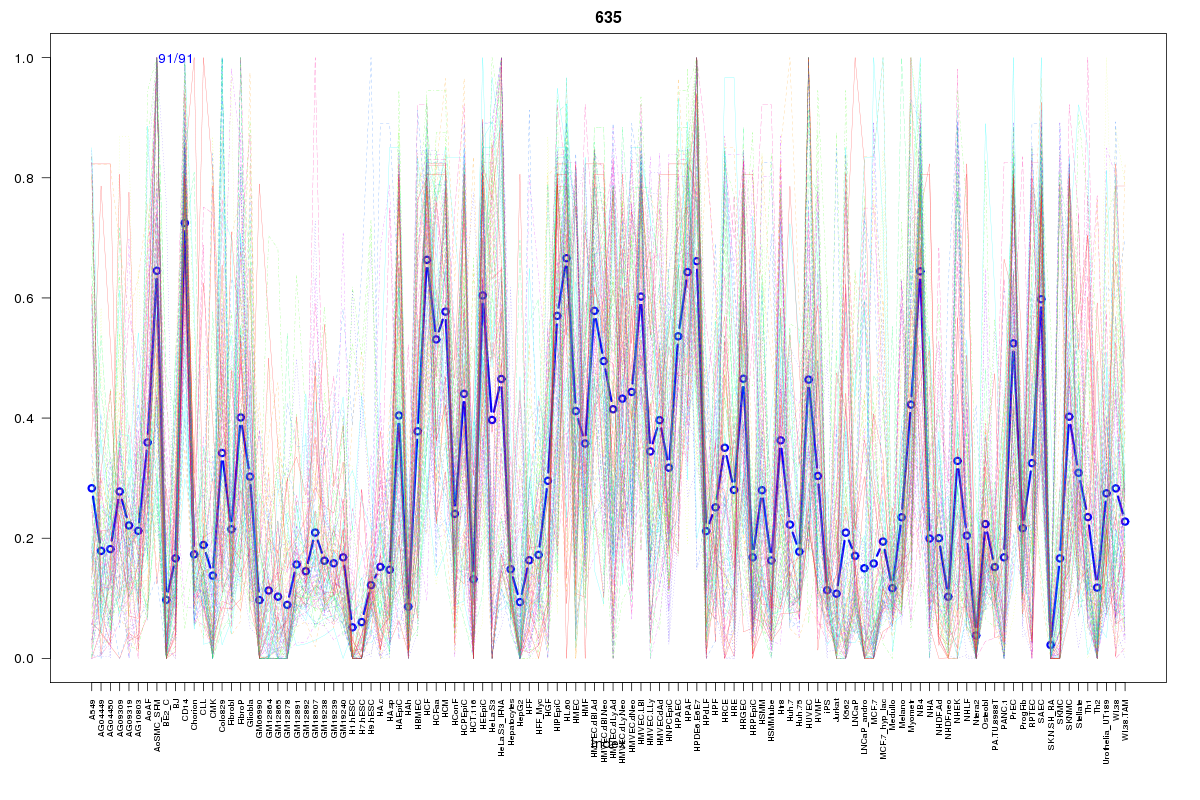 | 635 | 1 |
 | 2468 | 1 |
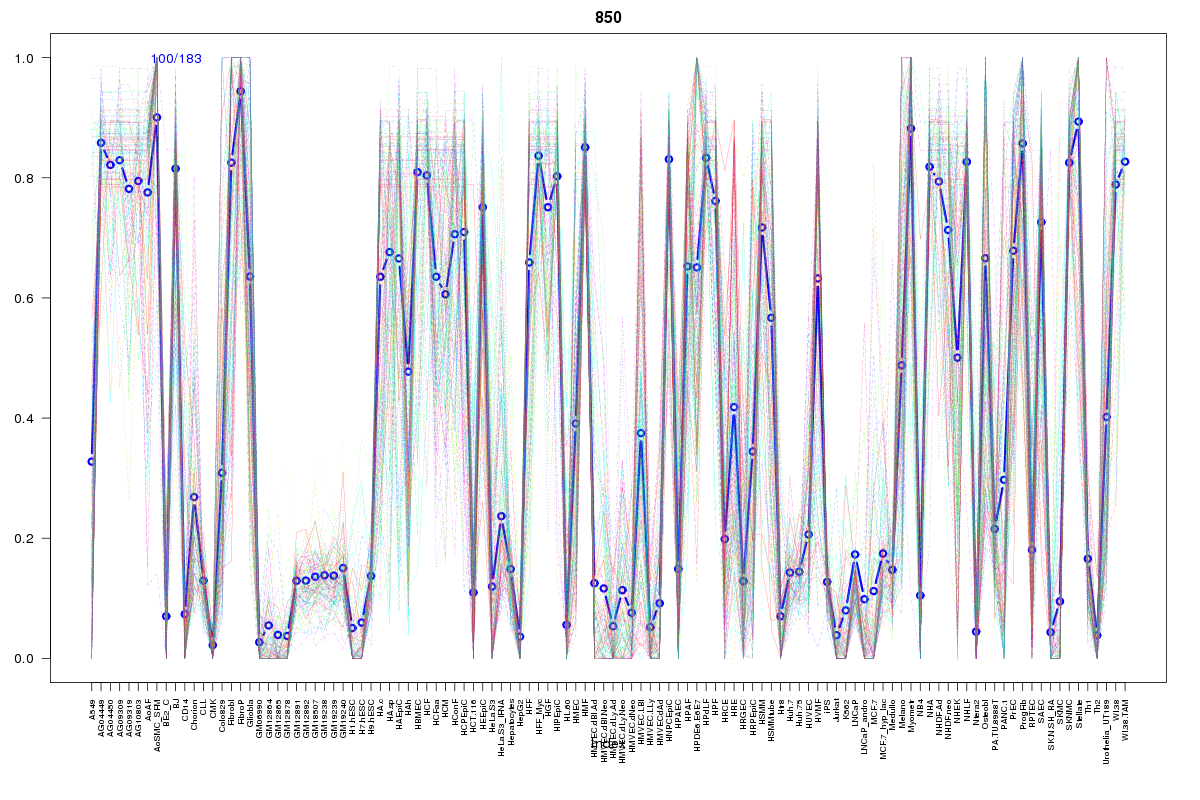 | 850 | 1 |
 | 2211 | 1 |
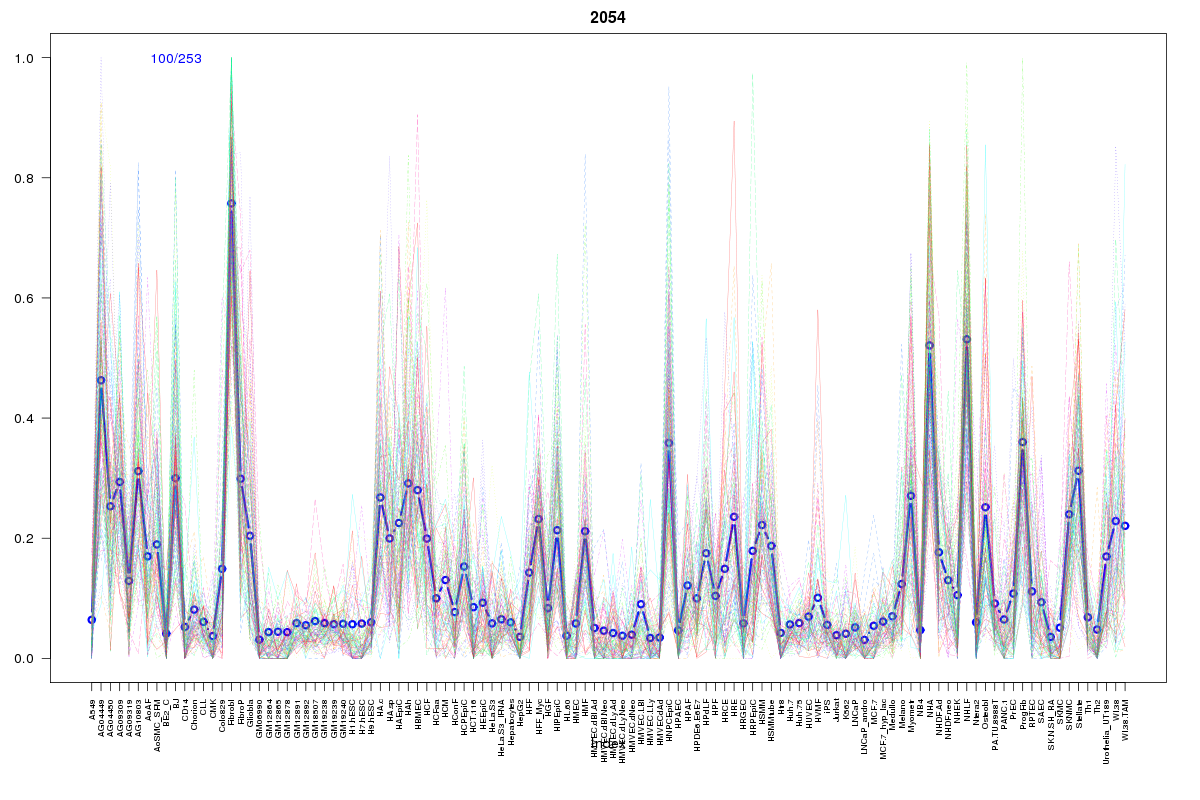 | 2054 | 1 |
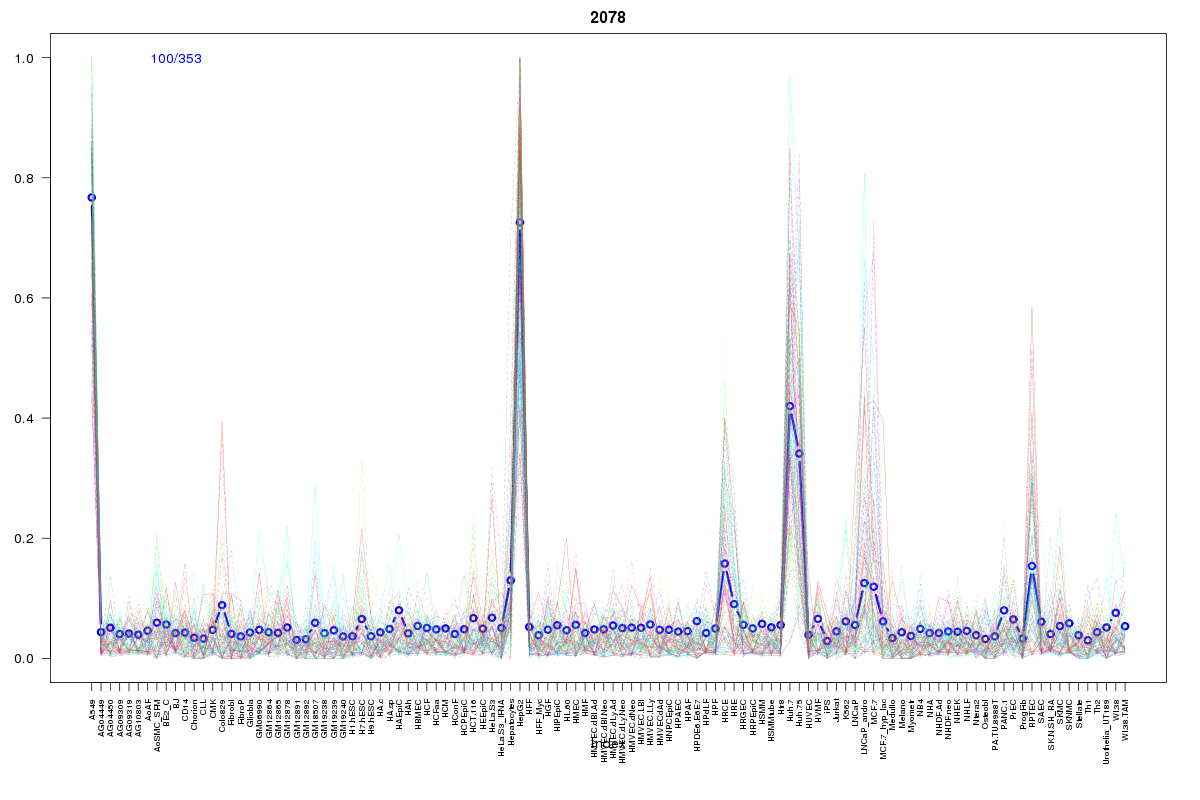 | 2078 | 1 |
 | 882 | 1 |
Resources
BED file downloads
Connects to 25 DHS sitesTop 10 Correlated DHS Sites
p-values indiciate significant higher or lower correlation| Location | Cluster | P-value |
|---|---|---|
| chr1:10571625-10571775 | 2017 | 0.001 |
| chr1:10459320-10459470 | 333 | 0.002 |
| chr1:10445360-10445510 | 2114 | 0.004 |
| chr1:10574280-10574430 | 2211 | 0.005 |
| chr1:10568000-10568150 | 2114 | 0.005 |
| chr1:10570240-10570390 | 2017 | 0.006 |
| chr1:10535380-10535530 | 421 | 0.006 |
| chr1:10531840-10531990 | 556 | 0.012 |
| chr1:10490180-10490330 | 1404 | 0.012 |
| chr1:10535200-10535350 | 969 | 0.012 |
| chr1:10534880-10535030 | 197 | 0.014 |
External Databases
UCSCEnsembl (ENSG00000251503)