Gene: CTD-2090I13.3
chr1: 227618226-227618677Expression Profile
(log scale)
Graphical Connections
Distribution of linked clusters:
You may find it interesting if many of the connected DHS sites belong to the same cluster.| Cluster Profile | Cluster ID | Number of DHS sites in this cluster |
|---|---|---|
 | 15 | 1 |
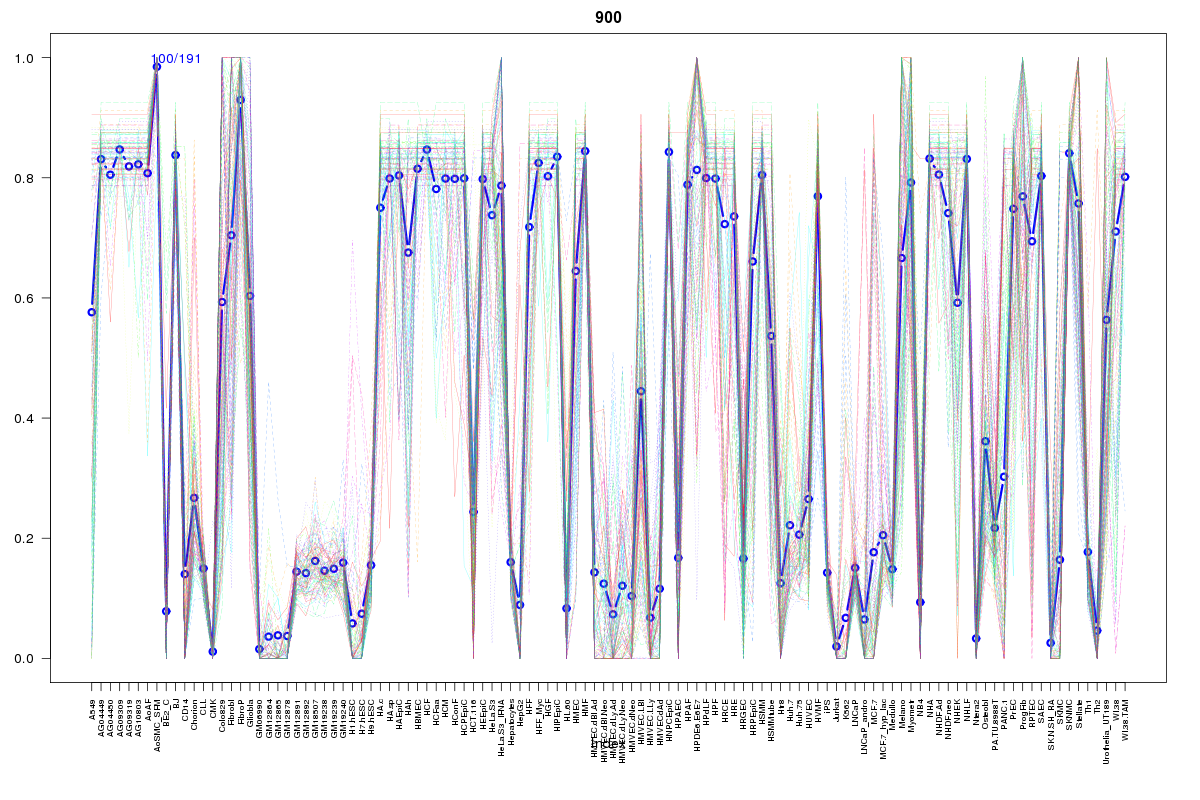 | 900 | 1 |
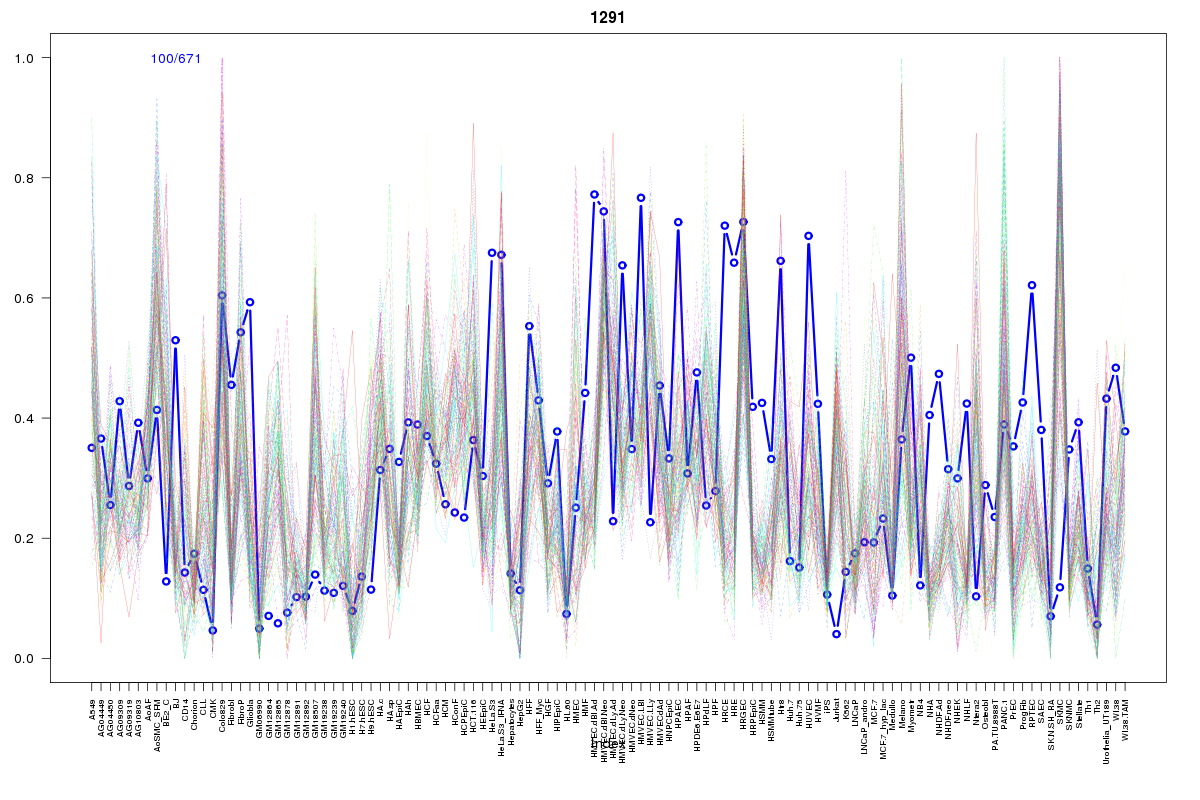 | 1291 | 1 |
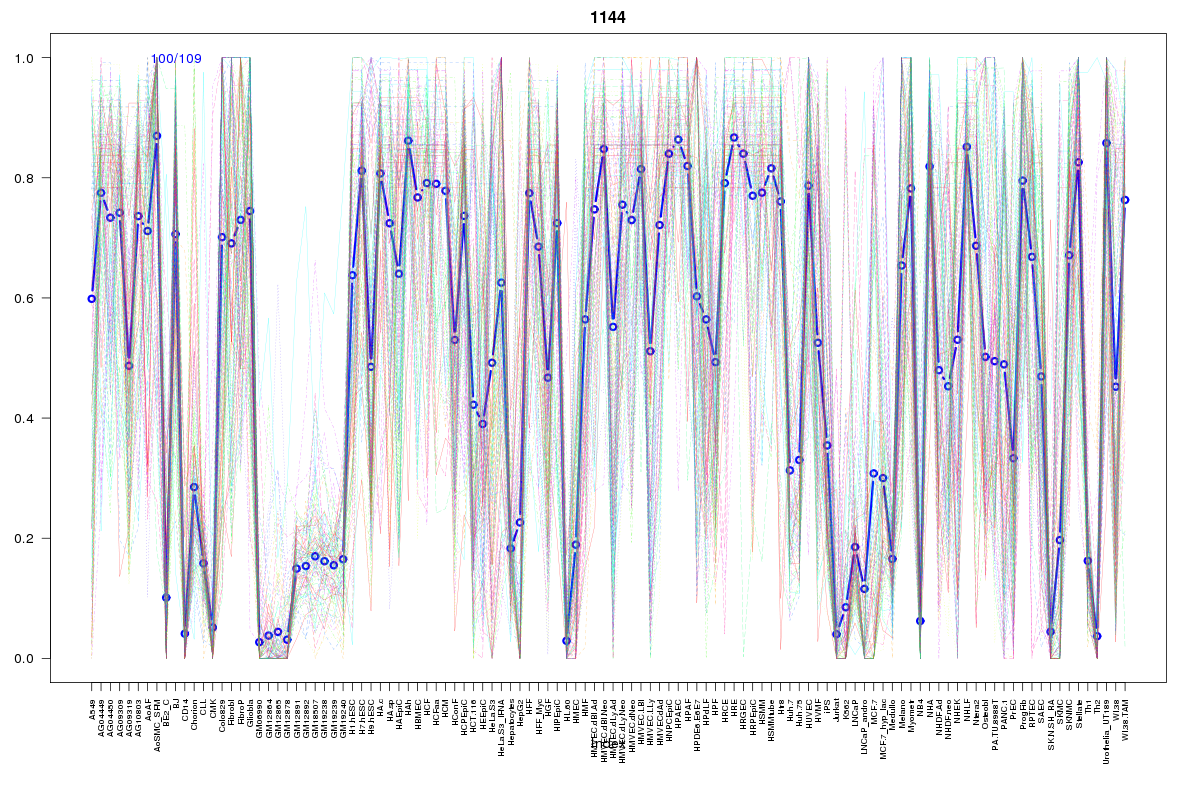 | 1144 | 1 |
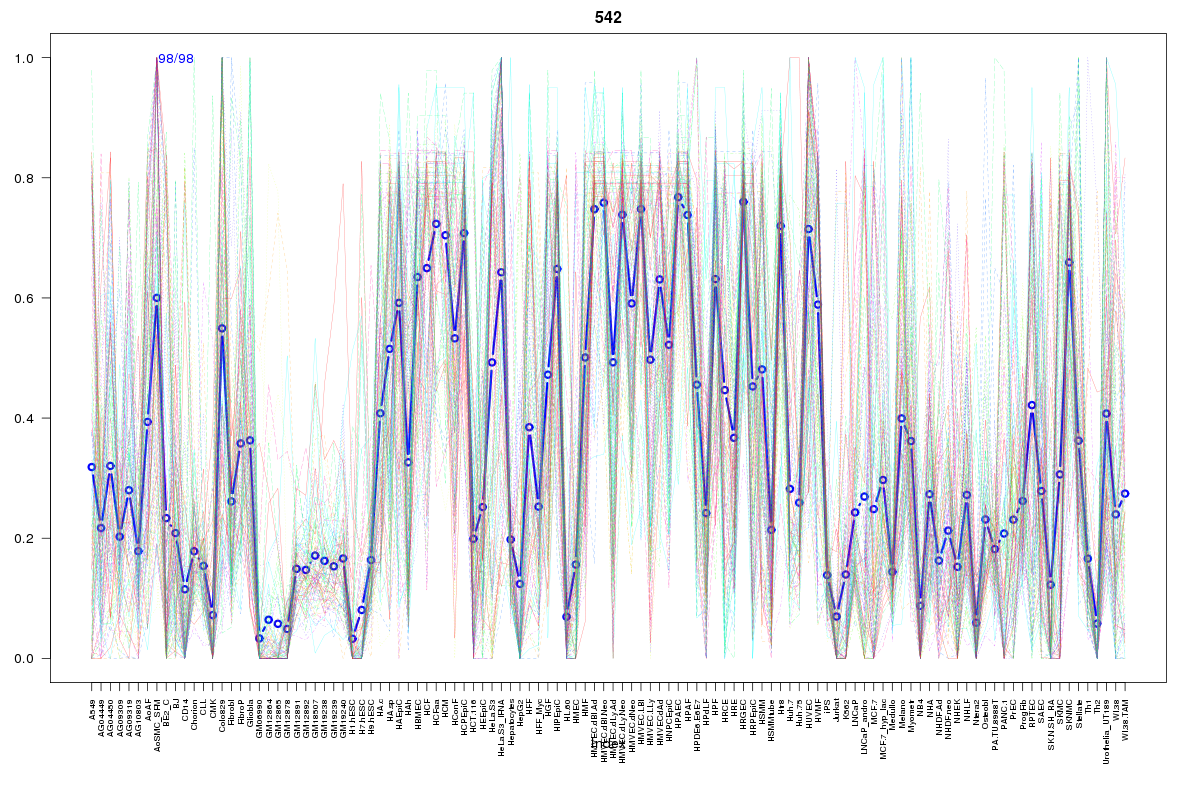 | 542 | 1 |
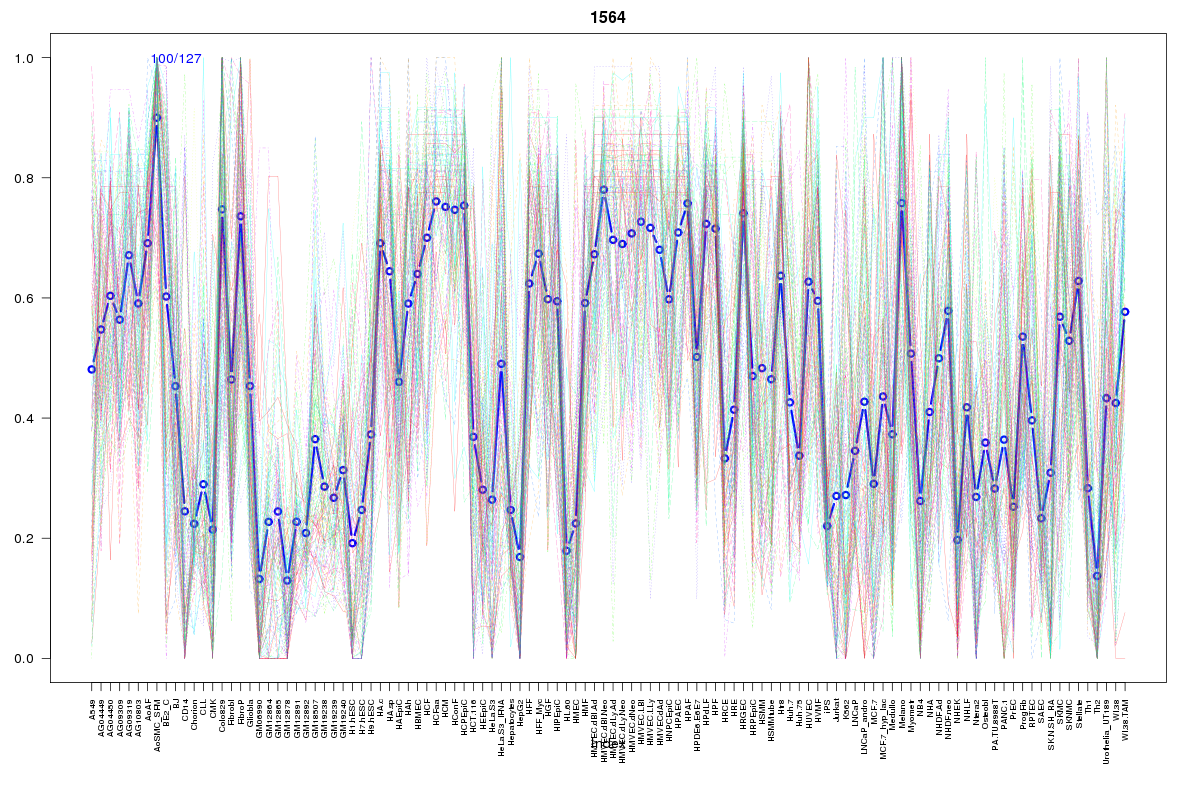 | 1564 | 1 |
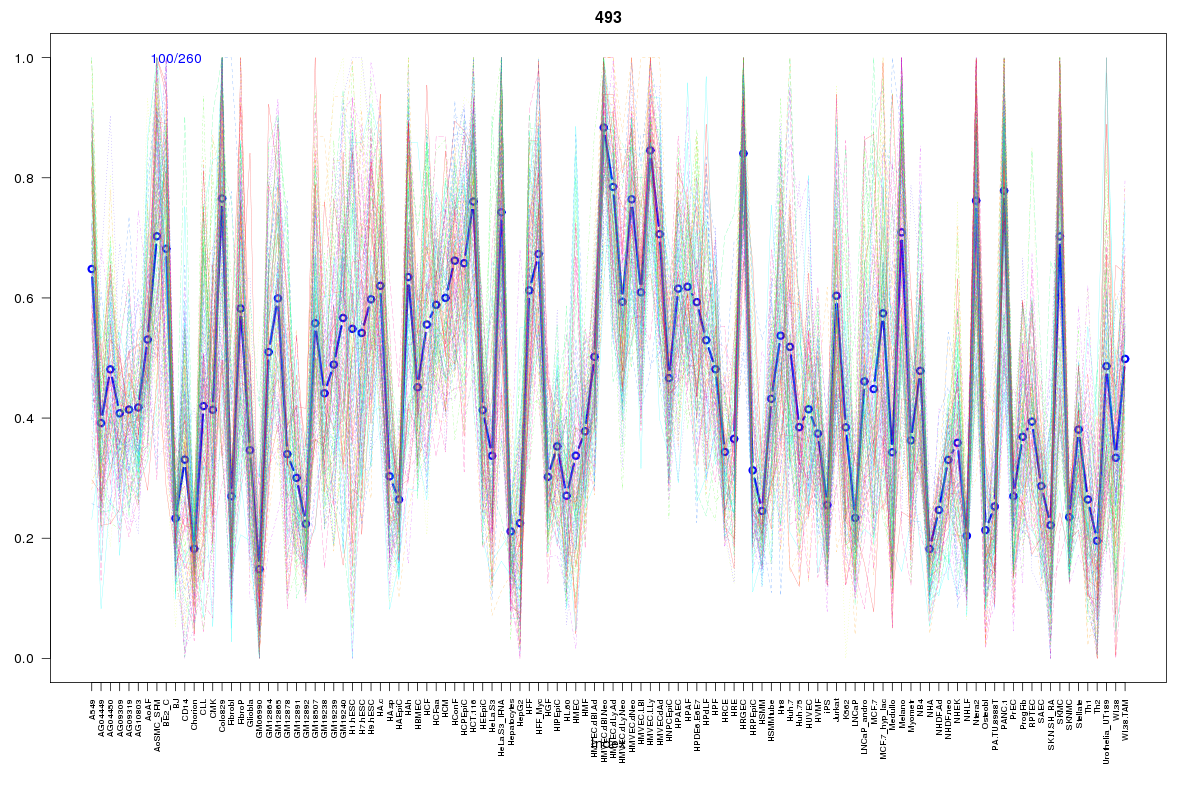 | 493 | 1 |
Resources
BED file downloads
Connects to 7 DHS sitesTop 10 Correlated DHS Sites
p-values indiciate significant higher or lower correlation| Location | Cluster | P-value |
|---|---|---|
| chr1:227698725-227698875 | 15 | 0.011 |
| chr1:227616620-227616770 | 542 | 0.019 |
| chr1:227544960-227545110 | 1291 | 0.011 |
| chr1:227531820-227531970 | 900 | 0.01 |
| chr1:227625460-227625610 | 493 | 0.006 |
| chr1:227545240-227545390 | 1144 | 0.001 |
| chr1:227619620-227619770 | 1564 | 0.001 |
External Databases
UCSCEnsembl (ENSG00000242757)