Gene: GYG1P3
chr1: 55688051-55689045Expression Profile
(log scale)
Graphical Connections
Distribution of linked clusters:
You may find it interesting if many of the connected DHS sites belong to the same cluster.| Cluster Profile | Cluster ID | Number of DHS sites in this cluster |
|---|---|---|
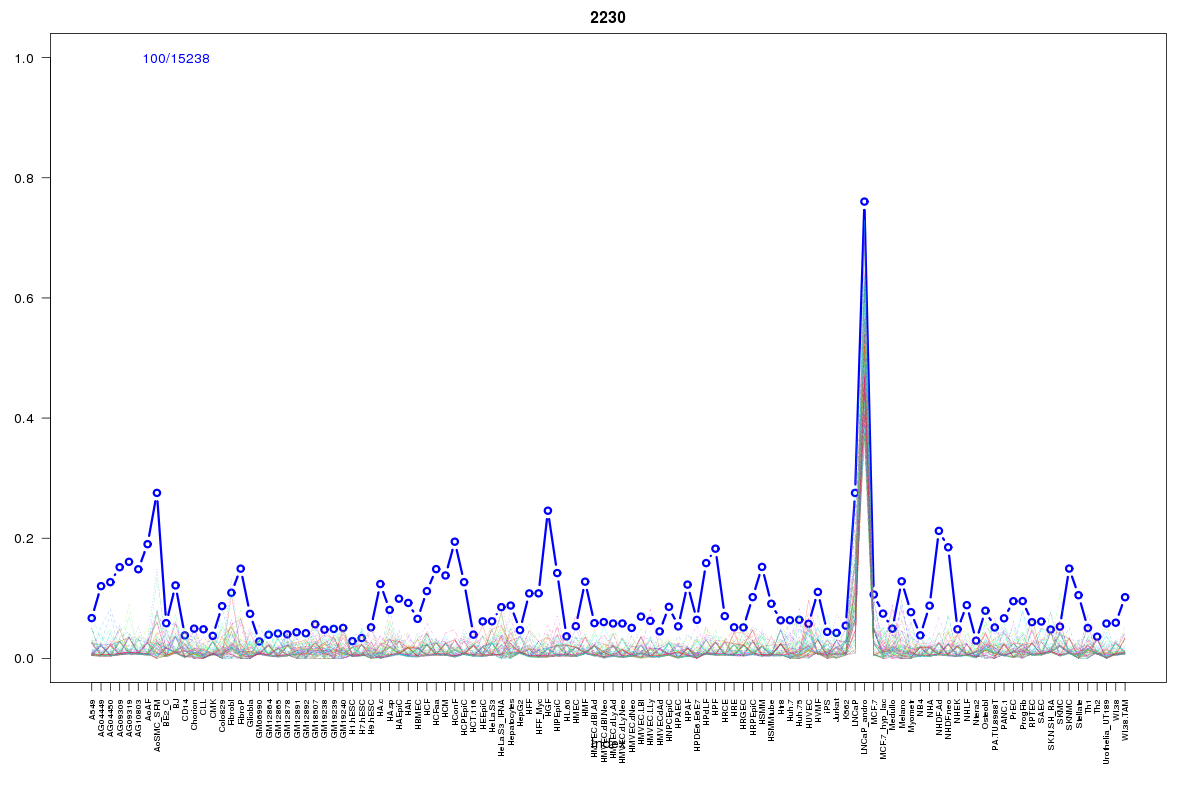 | 2230 | 4 |
 | 2186 | 2 |
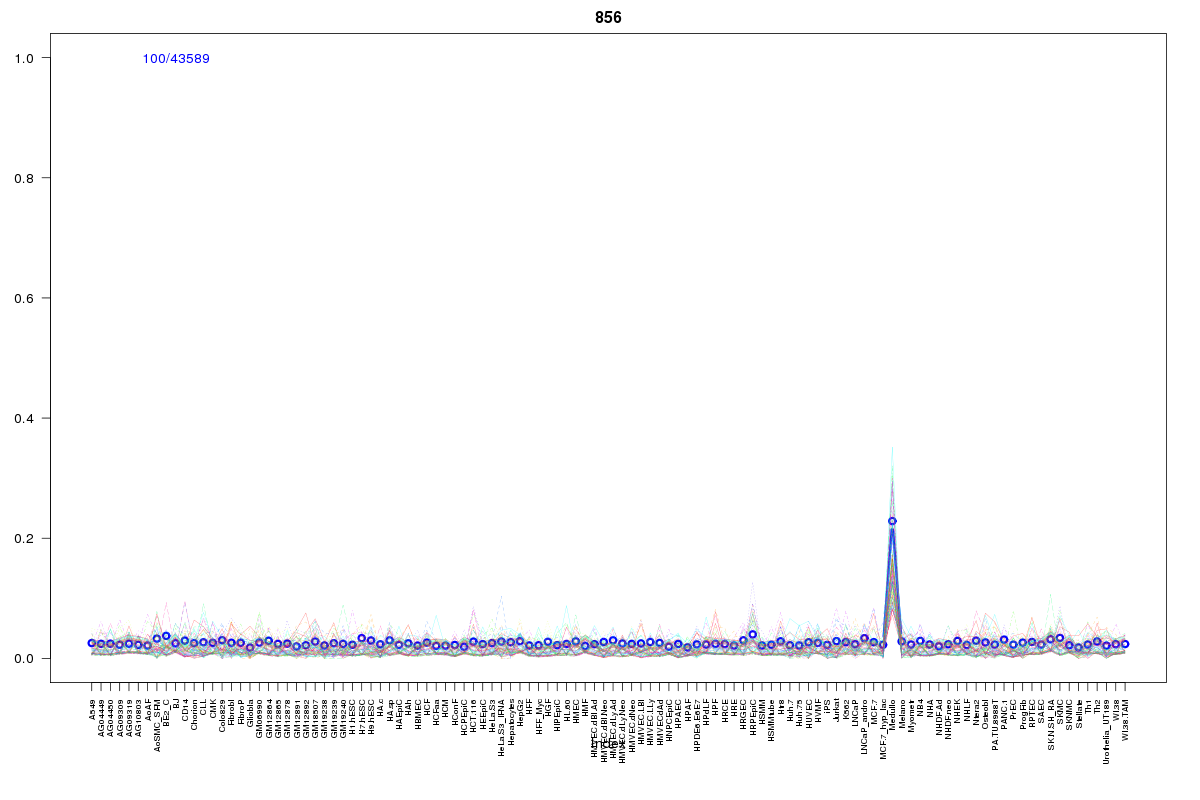 | 856 | 1 |
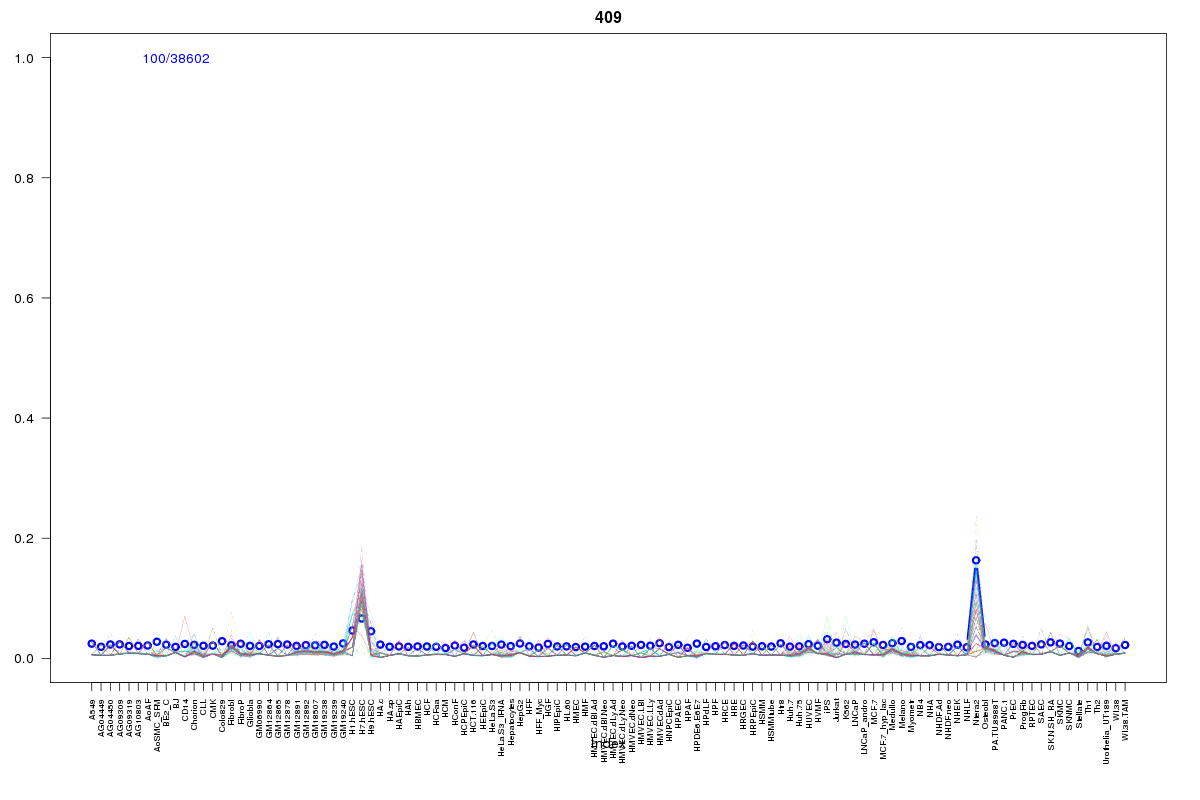 | 409 | 1 |
 | 2326 | 1 |
 | 2017 | 1 |
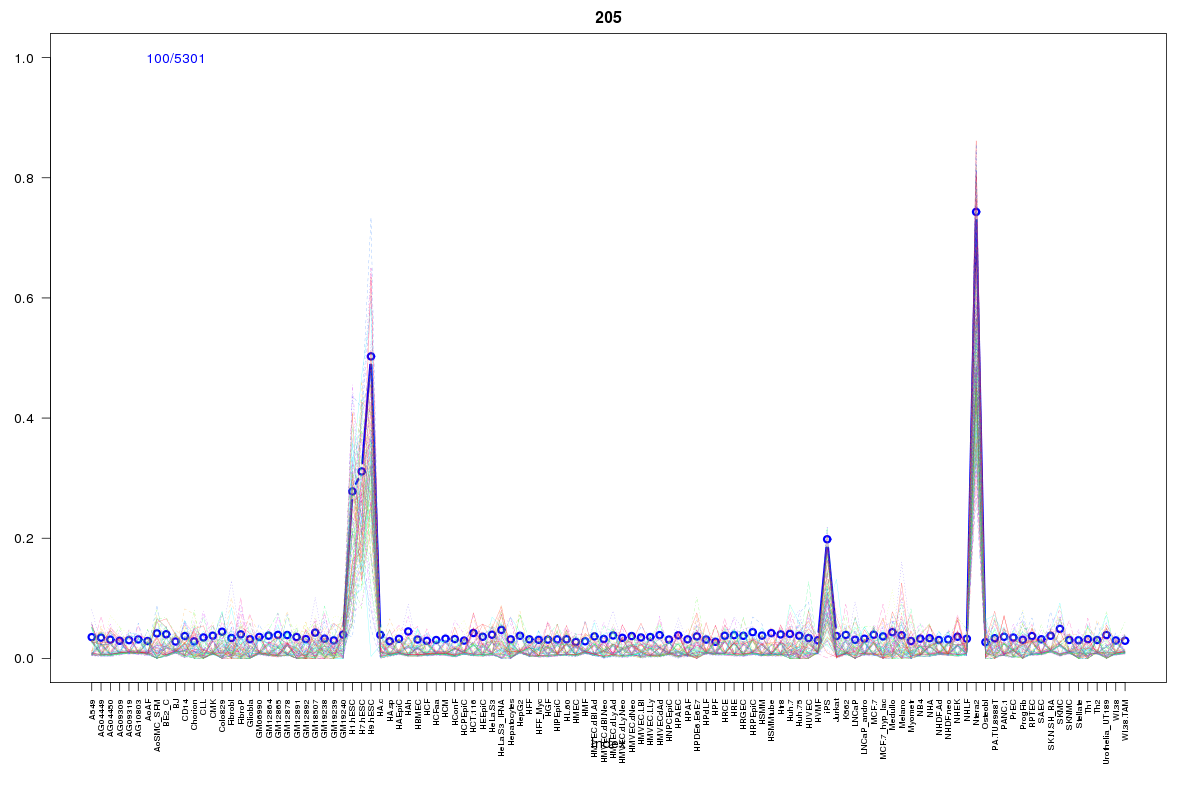 | 205 | 1 |
Resources
BED file downloads
Connects to 11 DHS sitesTop 10 Correlated DHS Sites
p-values indiciate significant higher or lower correlation| Location | Cluster | P-value |
|---|---|---|
| chr1:55676740-55676890 | 2326 | 0 |
| chr1:55599120-55599270 | 2186 | 0.001 |
| chr1:55599940-55600090 | 2230 | 0.001 |
| chr1:55682860-55683010 | 2230 | 0.012 |
| chr1:55721640-55721790 | 2230 | 0.016 |
| chr1:55616060-55616210 | 2186 | 0.019 |
| chr1:55682620-55682770 | 2230 | 0.023 |
| chr1:55618780-55618930 | 409 | 0.023 |
| chr1:55768425-55768575 | 856 | 0.021 |
| chr1:55764240-55764390 | 205 | 0.017 |
| chr1:55678285-55678435 | 2017 | 0.005 |
External Databases
UCSCEnsembl (ENSG00000231095)