Gene: GCNT1P3
chr3: 190342383-190342958Expression Profile
(log scale)
Graphical Connections
Distribution of linked clusters:
You may find it interesting if many of the connected DHS sites belong to the same cluster.| Cluster Profile | Cluster ID | Number of DHS sites in this cluster |
|---|---|---|
 | 2107 | 2 |
 | 1605 | 2 |
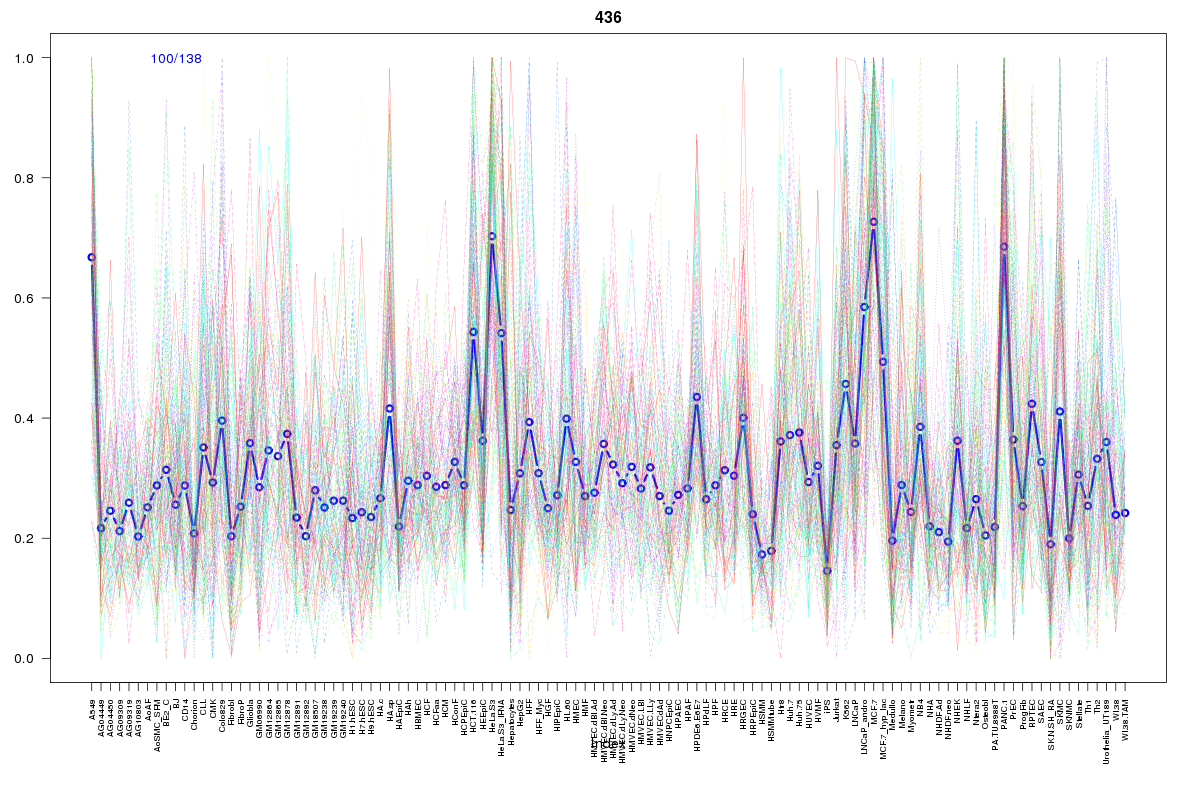 | 436 | 1 |
 | 1820 | 1 |
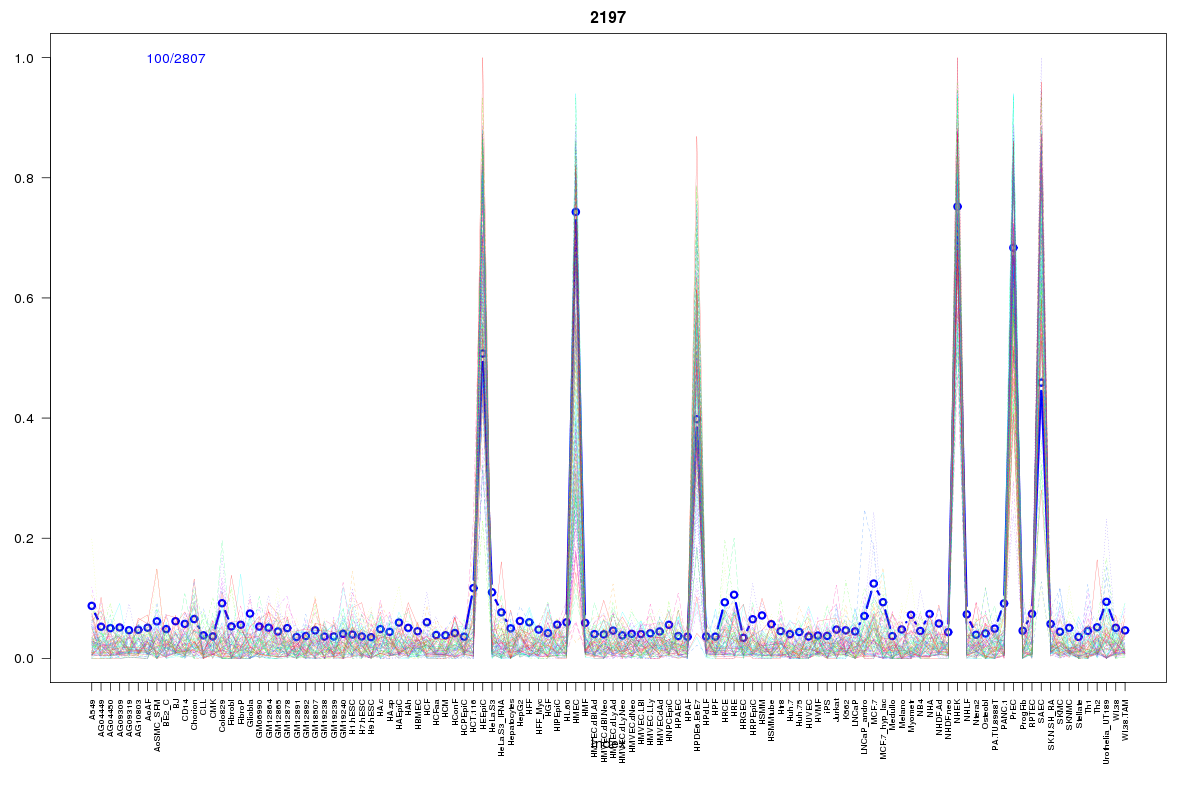 | 2197 | 1 |
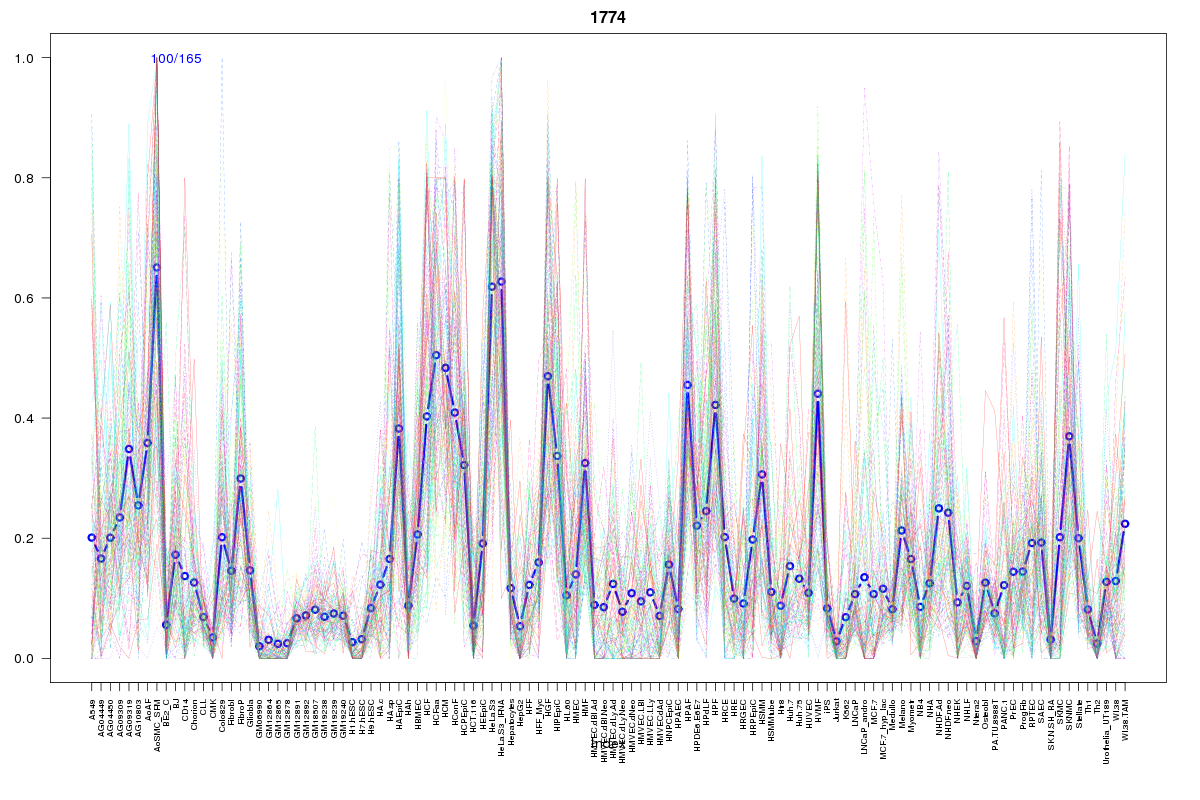 | 1774 | 1 |
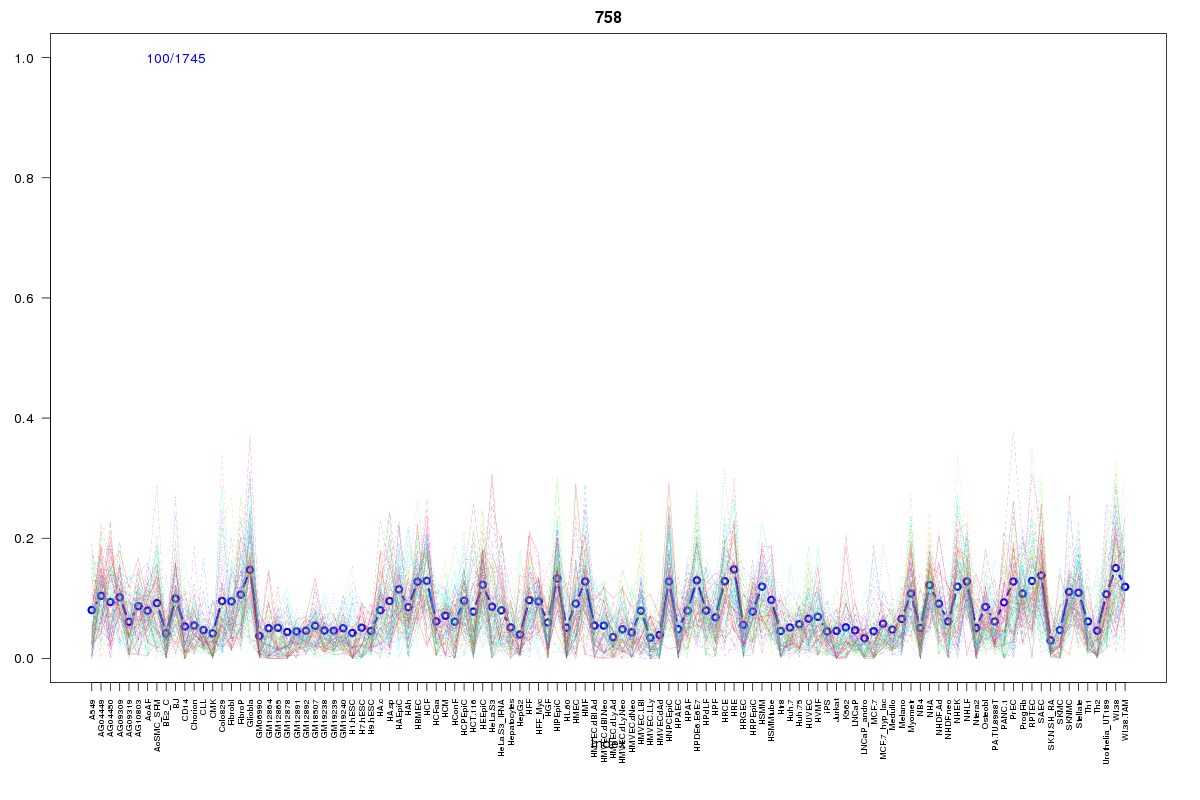 | 758 | 1 |
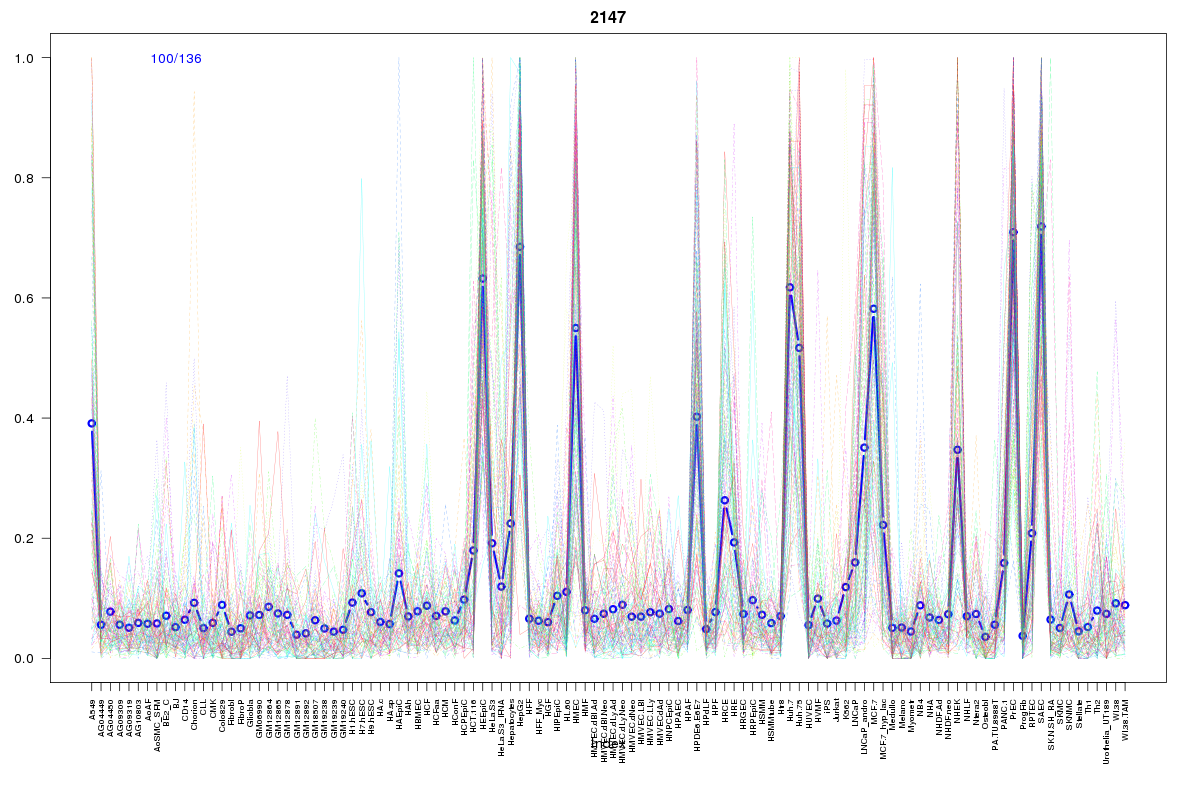 | 2147 | 1 |
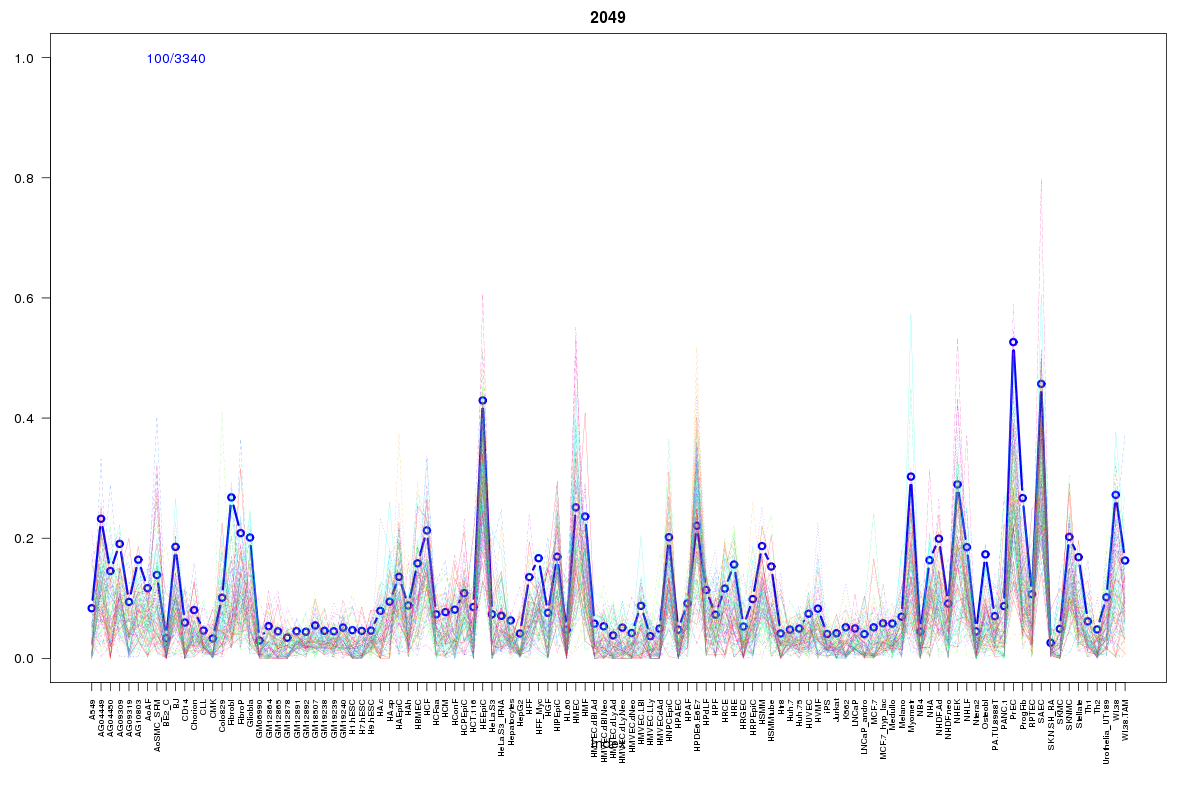 | 2049 | 1 |
 | 2195 | 1 |
 | 2072 | 1 |
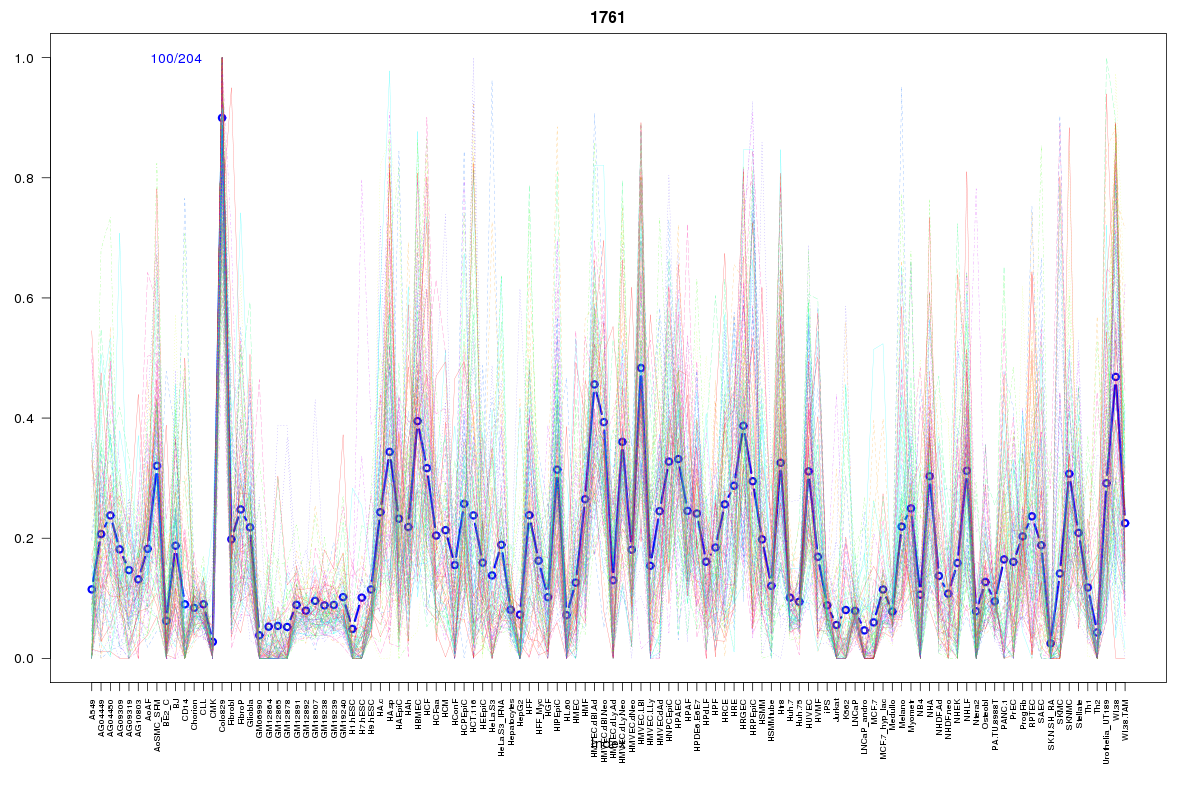 | 1761 | 1 |
 | 227 | 1 |
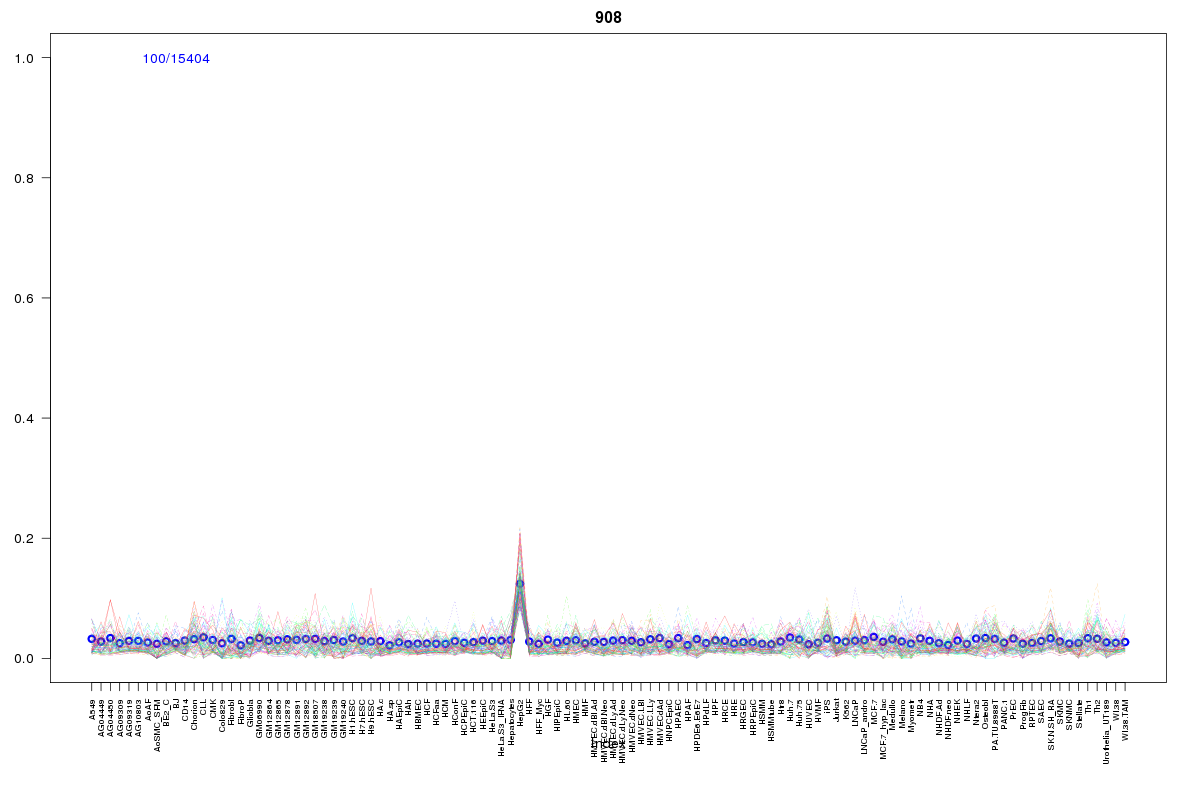 | 908 | 1 |
Resources
BED file downloads
Connects to 16 DHS sitesTop 10 Correlated DHS Sites
p-values indiciate significant higher or lower correlation| Location | Cluster | P-value |
|---|---|---|
| chr3:190249300-190249450 | 2197 | 0.004 |
| chr3:190304460-190304610 | 227 | 0.005 |
| chr3:190418960-190419110 | 436 | 0.008 |
| chr3:190252900-190253050 | 2147 | 0.008 |
| chr3:190255020-190255170 | 2049 | 0.008 |
| chr3:190297660-190297810 | 1605 | 0.009 |
| chr3:190261560-190261710 | 2195 | 0.009 |
| chr3:190332440-190332590 | 908 | 0.017 |
| chr3:190284060-190284210 | 1761 | 0.018 |
| chr3:190313700-190313850 | 1605 | 0.018 |
| chr3:190418800-190418950 | 2107 | 0.018 |
External Databases
UCSCEnsembl (ENSG00000231047)