Gene: ATP5G2P1
chr1: 209441142-209441568Expression Profile
(log scale)
Graphical Connections
Distribution of linked clusters:
You may find it interesting if many of the connected DHS sites belong to the same cluster.| Cluster Profile | Cluster ID | Number of DHS sites in this cluster |
|---|---|---|
 | 10 | 1 |
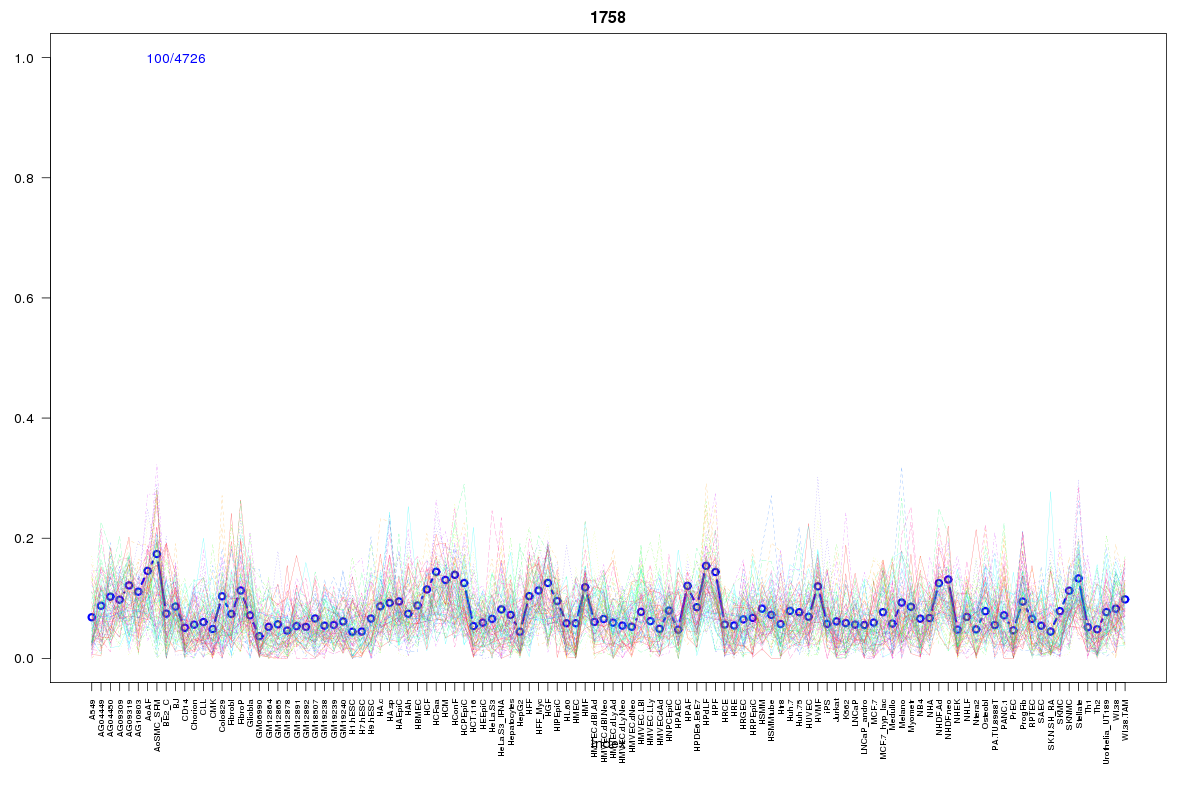 | 1758 | 1 |
 | 860 | 1 |
 | 1923 | 1 |
 | 396 | 1 |
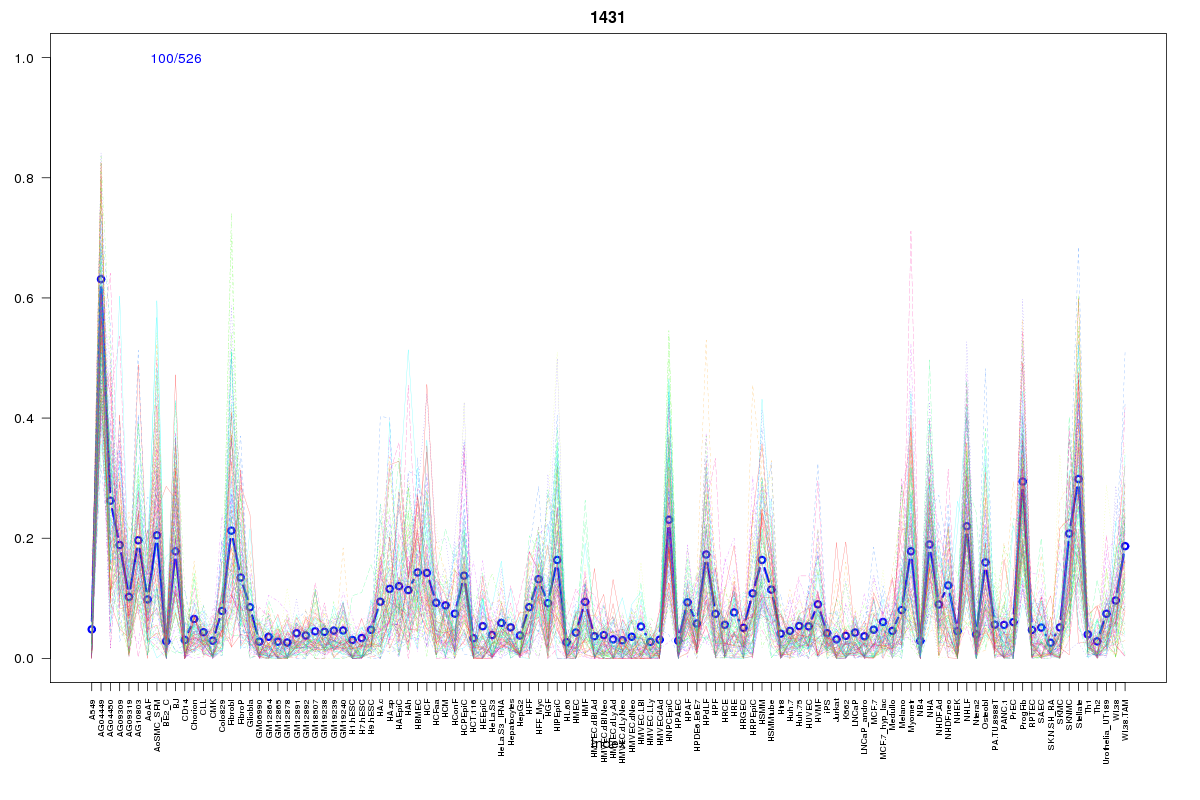 | 1431 | 1 |
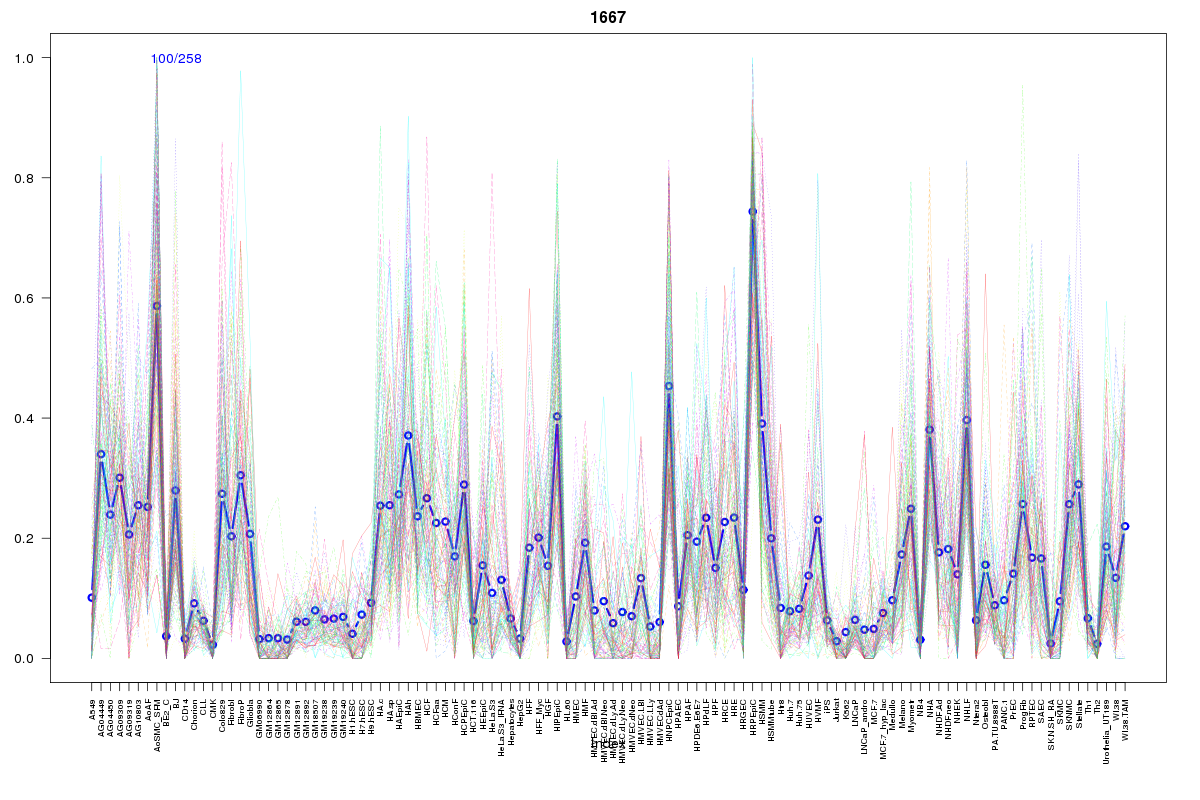 | 1667 | 1 |
Resources
BED file downloads
Connects to 7 DHS sitesTop 10 Correlated DHS Sites
p-values indiciate significant higher or lower correlation| Location | Cluster | P-value |
|---|---|---|
| chr1:209396965-209397115 | 860 | 0 |
| chr1:209369580-209369730 | 10 | 0.023 |
| chr1:209380840-209380990 | 1758 | 0.019 |
| chr1:209540580-209540730 | 1431 | 0.019 |
| chr1:209540860-209541010 | 1667 | 0.018 |
| chr1:209420120-209420270 | 1923 | 0.014 |
| chr1:209527720-209527870 | 396 | 0.003 |
External Databases
UCSCEnsembl (ENSG00000225712)