Gene: PTCHD3P1
chr10: 29698330-29747329Expression Profile
(log scale)
Graphical Connections
Distribution of linked clusters:
You may find it interesting if many of the connected DHS sites belong to the same cluster.| Cluster Profile | Cluster ID | Number of DHS sites in this cluster |
|---|---|---|
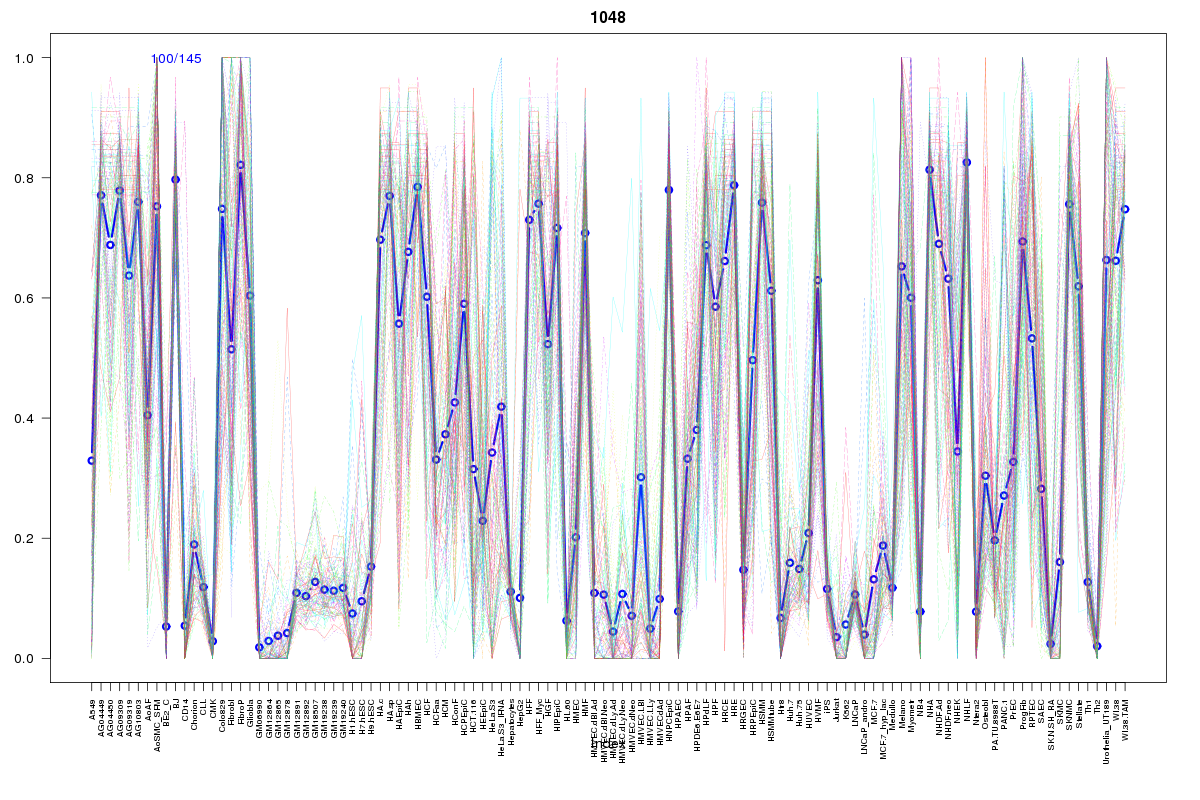 | 1048 | 2 |
 | 37 | 1 |
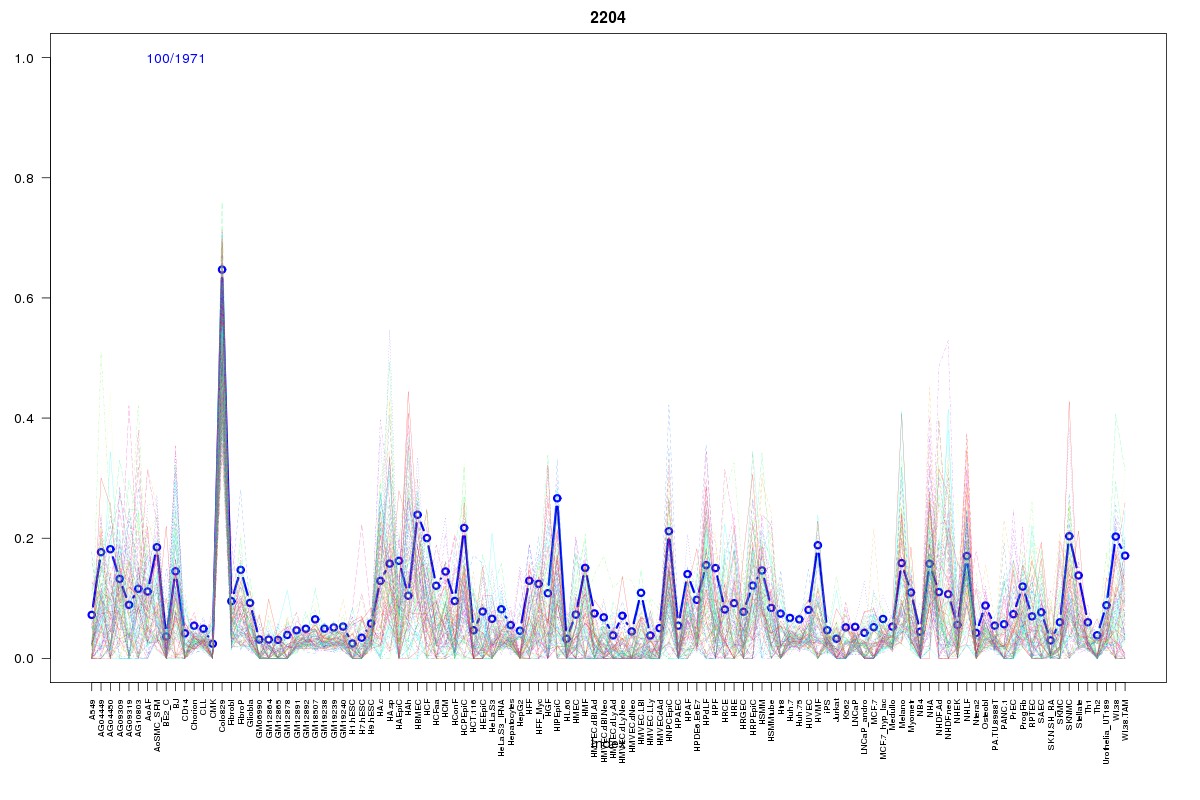 | 2204 | 1 |
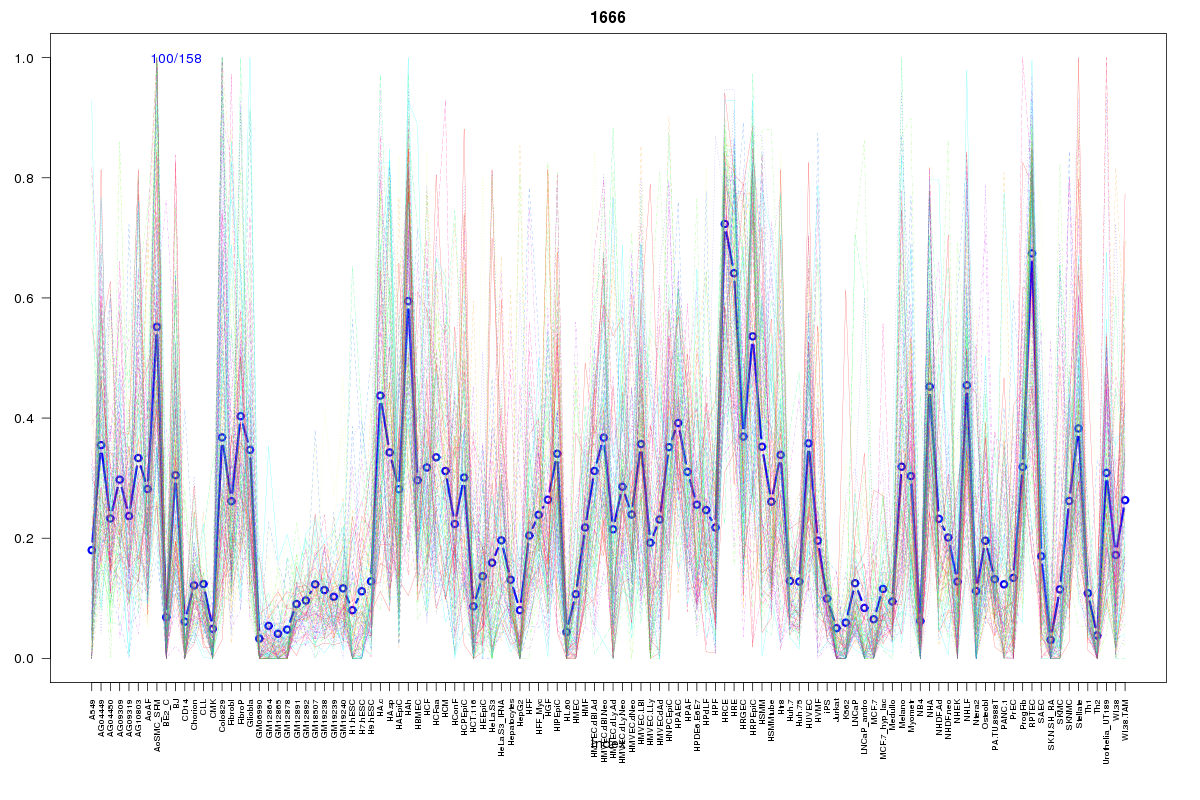 | 1666 | 1 |
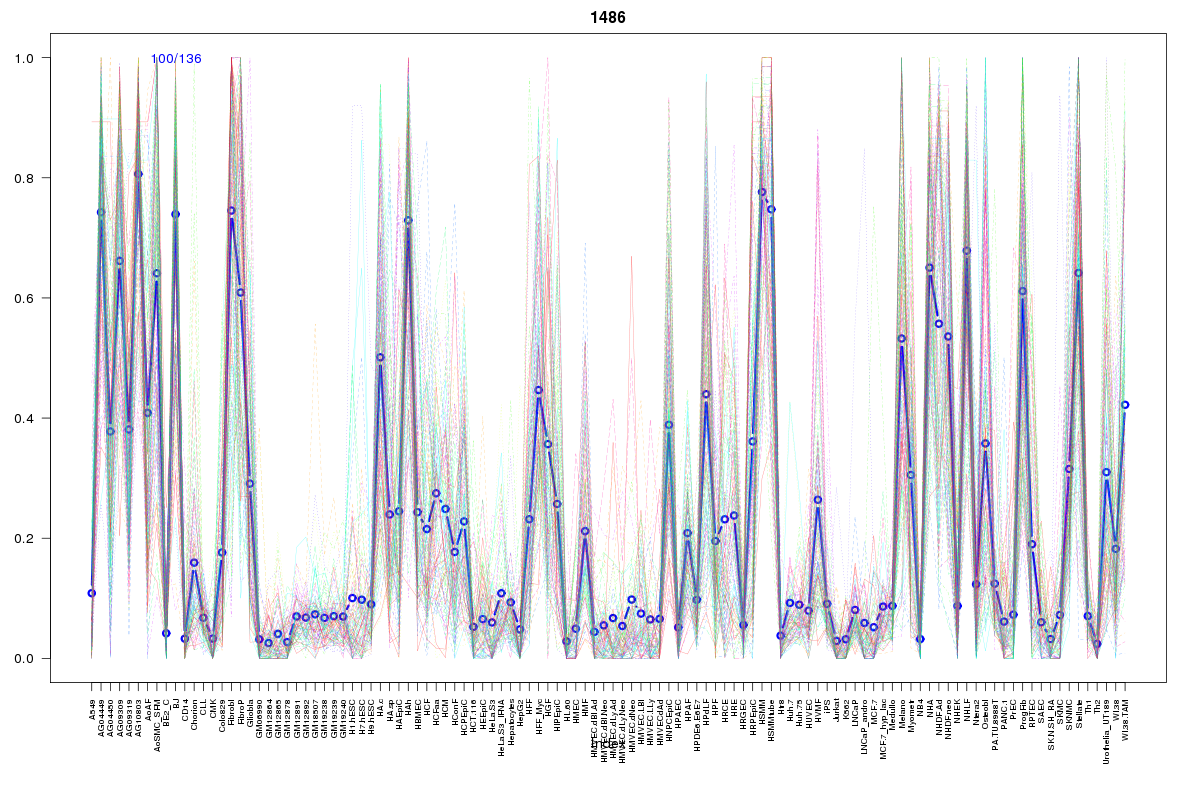 | 1486 | 1 |
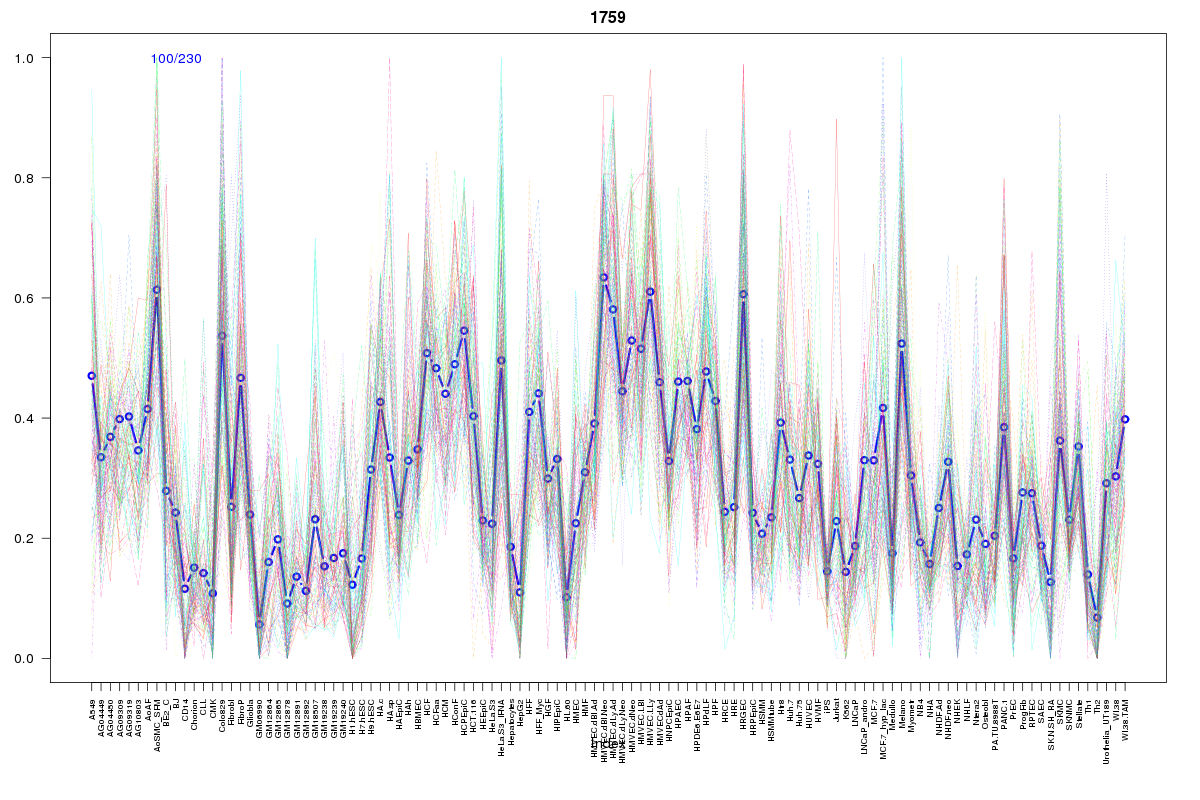 | 1759 | 1 |
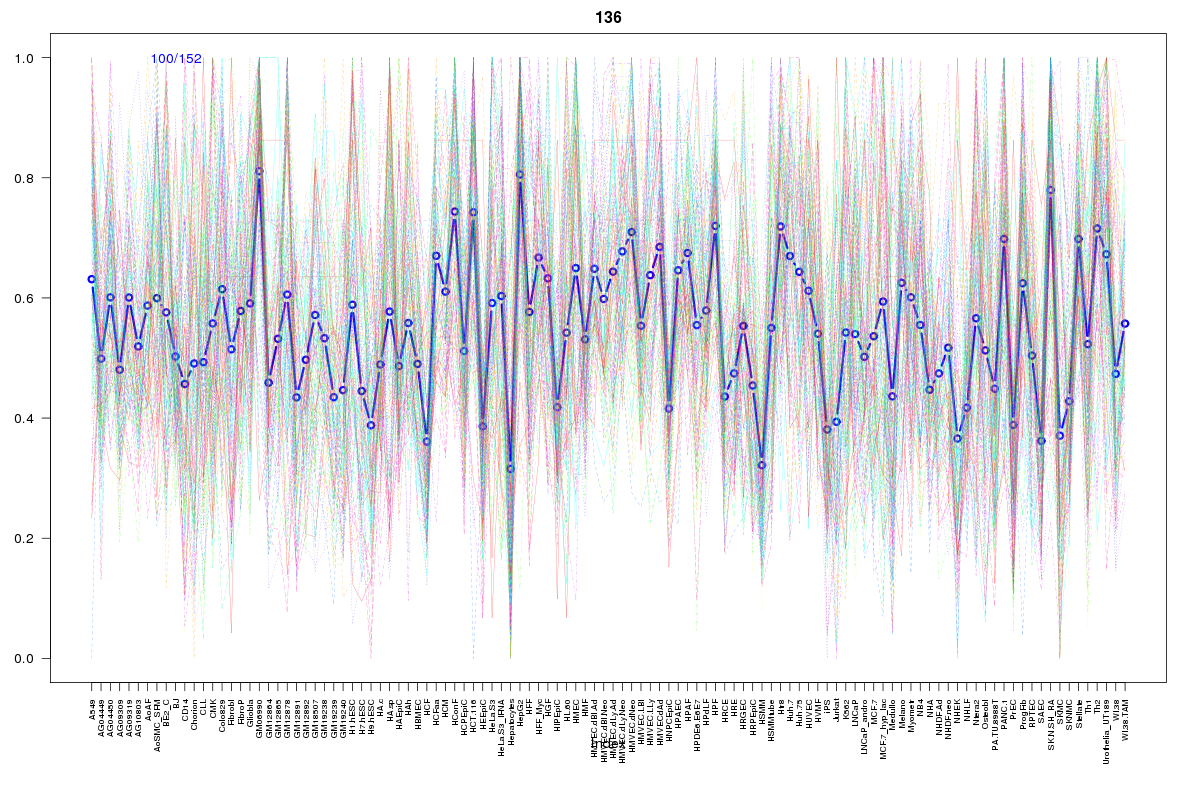 | 136 | 1 |
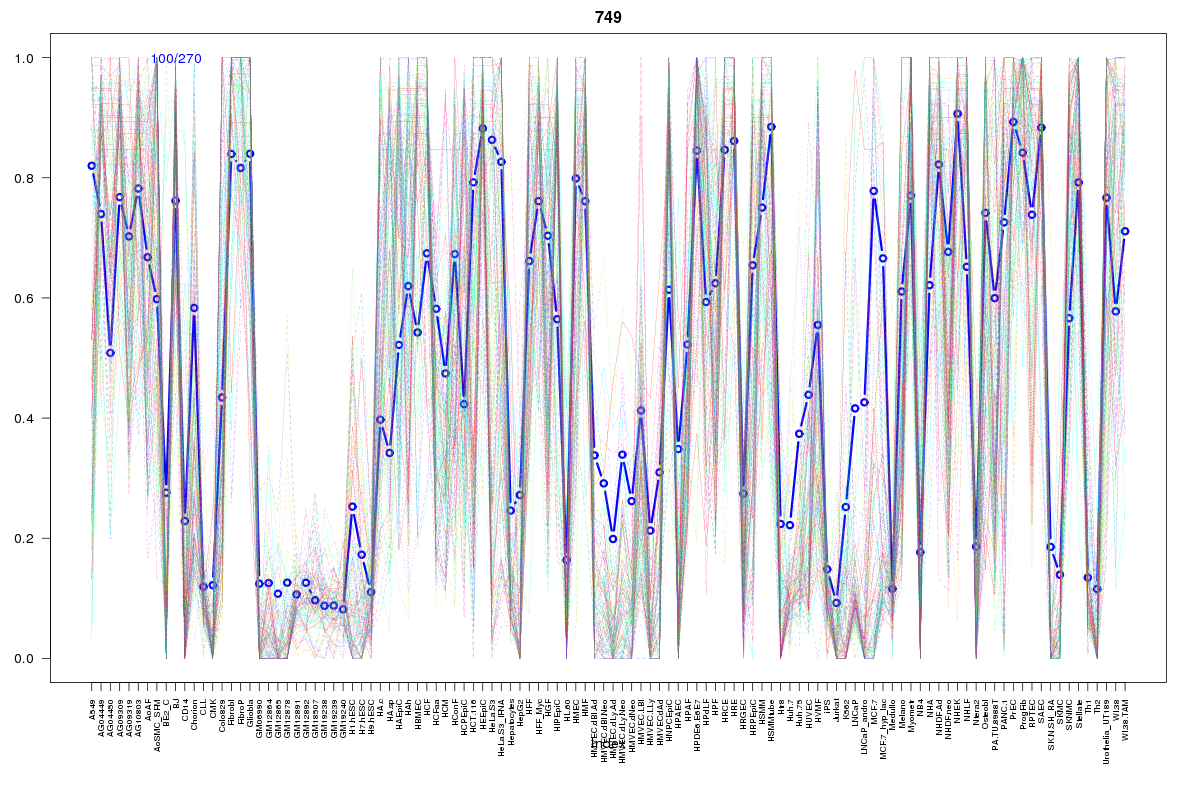 | 749 | 1 |
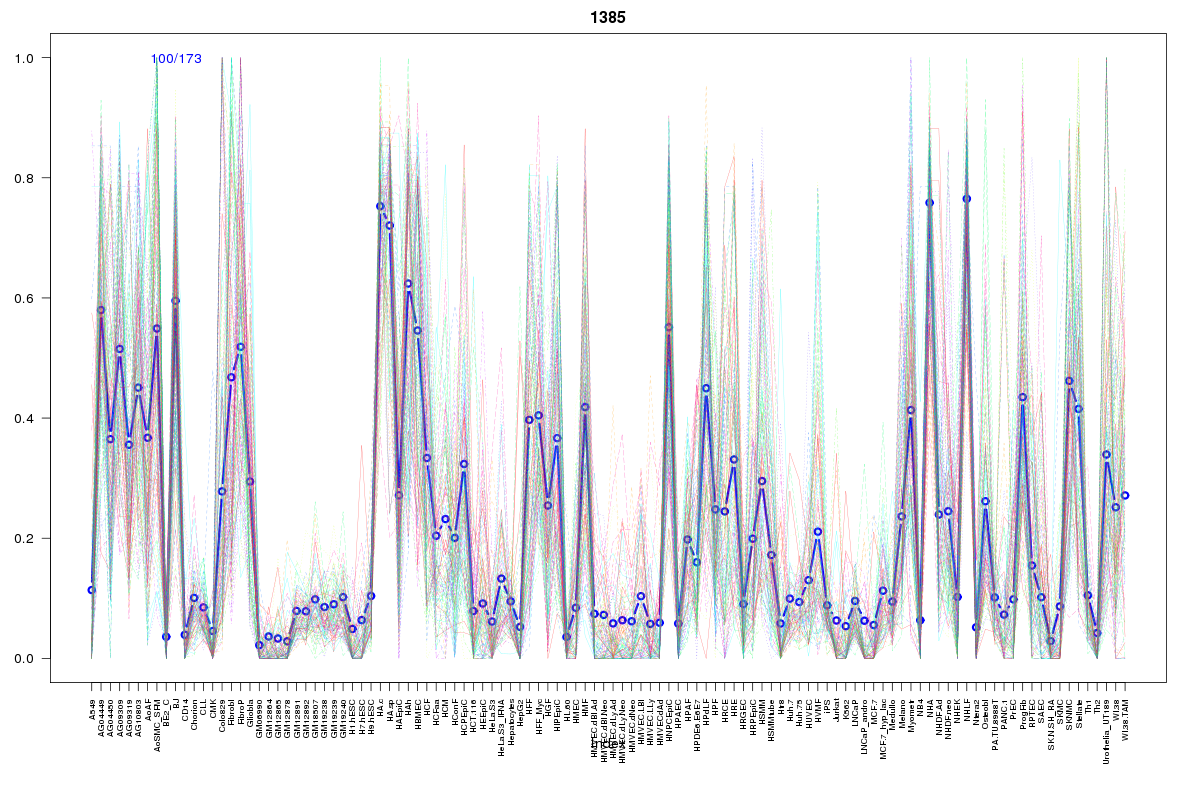 | 1385 | 1 |
Resources
BED file downloads
Connects to 10 DHS sitesTop 10 Correlated DHS Sites
p-values indiciate significant higher or lower correlation| Location | Cluster | P-value |
|---|---|---|
| chr10:29760500-29760650 | 1048 | 0.003 |
| chr10:29790740-29790890 | 749 | 0.003 |
| chr10:29845240-29845390 | 1666 | 0.005 |
| chr10:29824540-29824690 | 37 | 0.006 |
| chr10:29824380-29824530 | 1048 | 0.006 |
| chr10:29824160-29824310 | 1385 | 0.006 |
| chr10:29666445-29666595 | 1759 | 0.006 |
| chr10:29618040-29618190 | 1486 | 0.011 |
| chr10:29845045-29845195 | 2204 | 0.018 |
| chr10:29698400-29698550 | 136 | 0.02 |
External Databases
UCSCEnsembl (ENSG00000224597)