Gene: TIAF1
chr17: 27400536-27418537Expression Profile
(log scale)
Graphical Connections
Distribution of linked clusters:
You may find it interesting if many of the connected DHS sites belong to the same cluster.| Cluster Profile | Cluster ID | Number of DHS sites in this cluster |
|---|---|---|
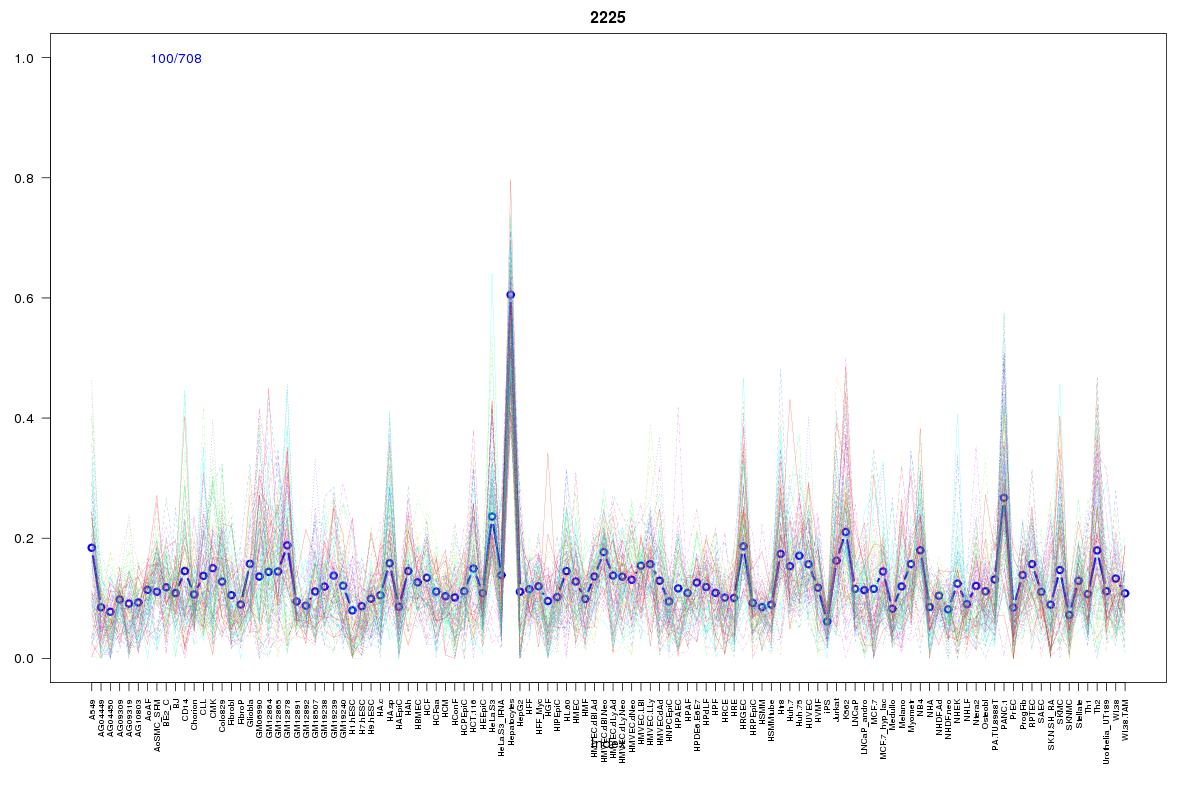 | 2225 | 2 |
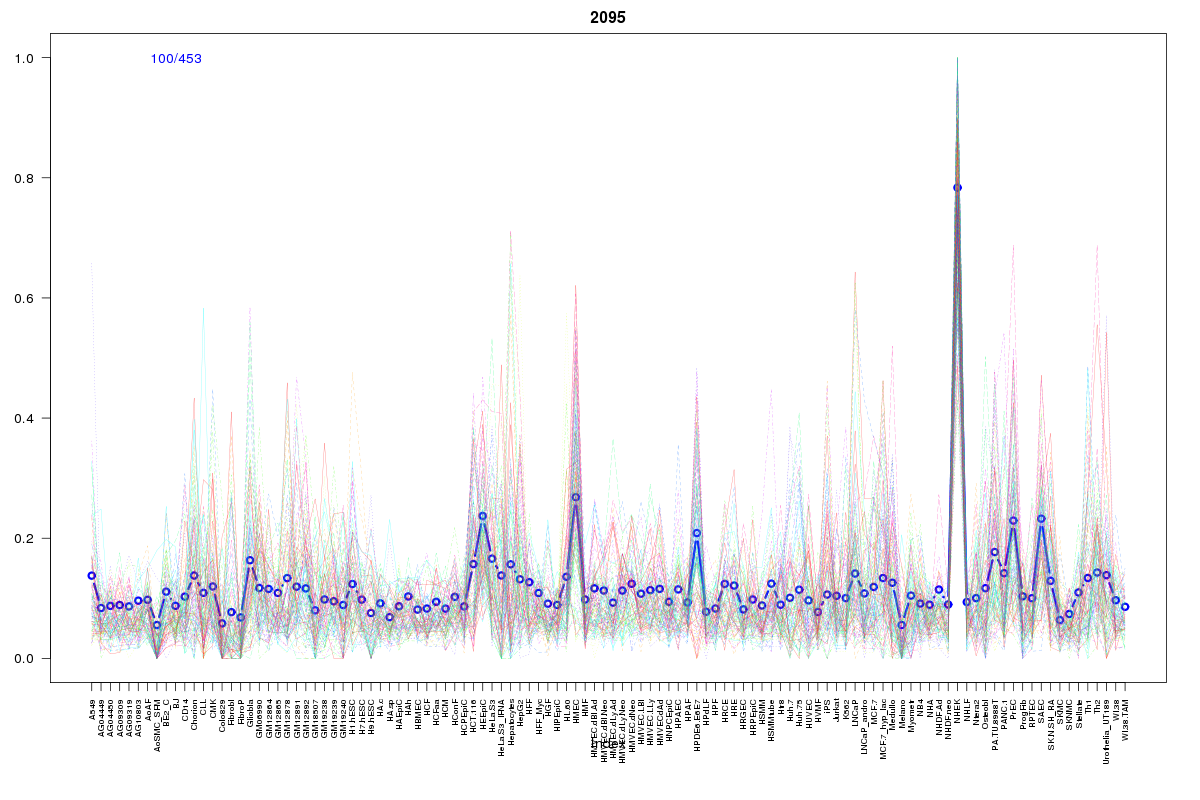 | 2095 | 2 |
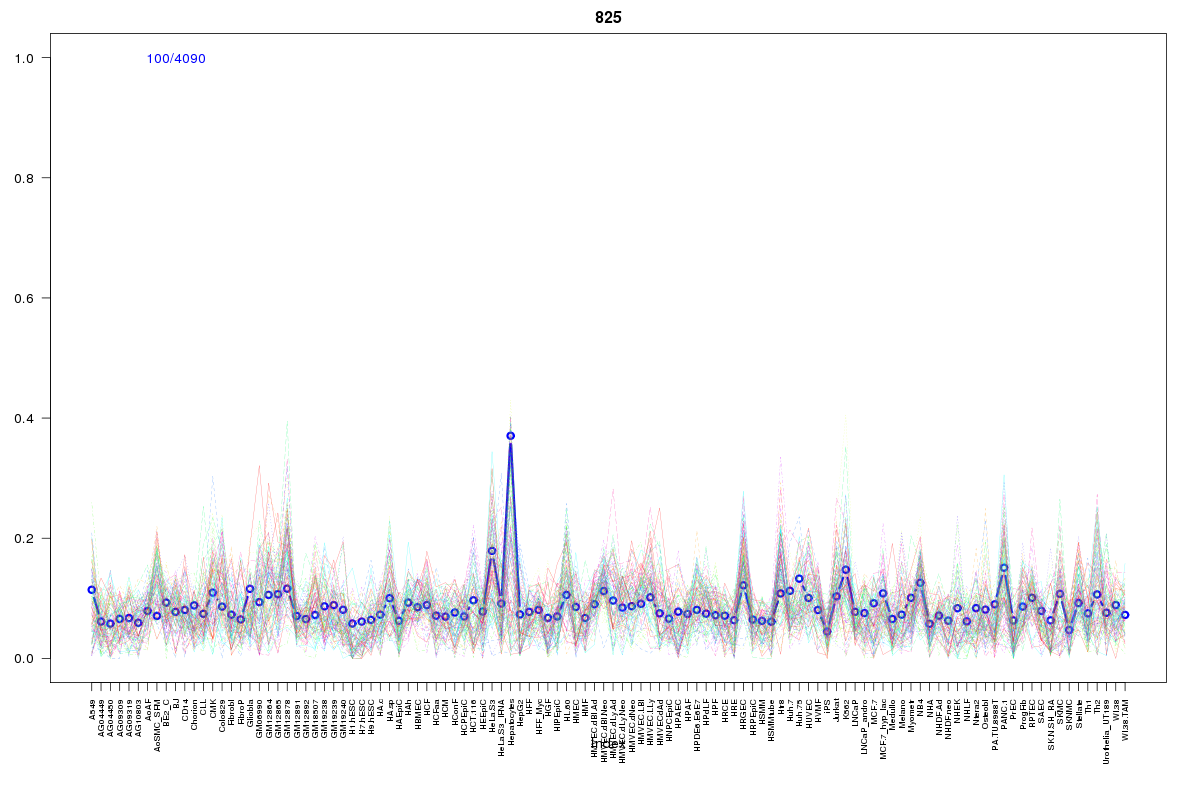 | 825 | 2 |
 | 2055 | 1 |
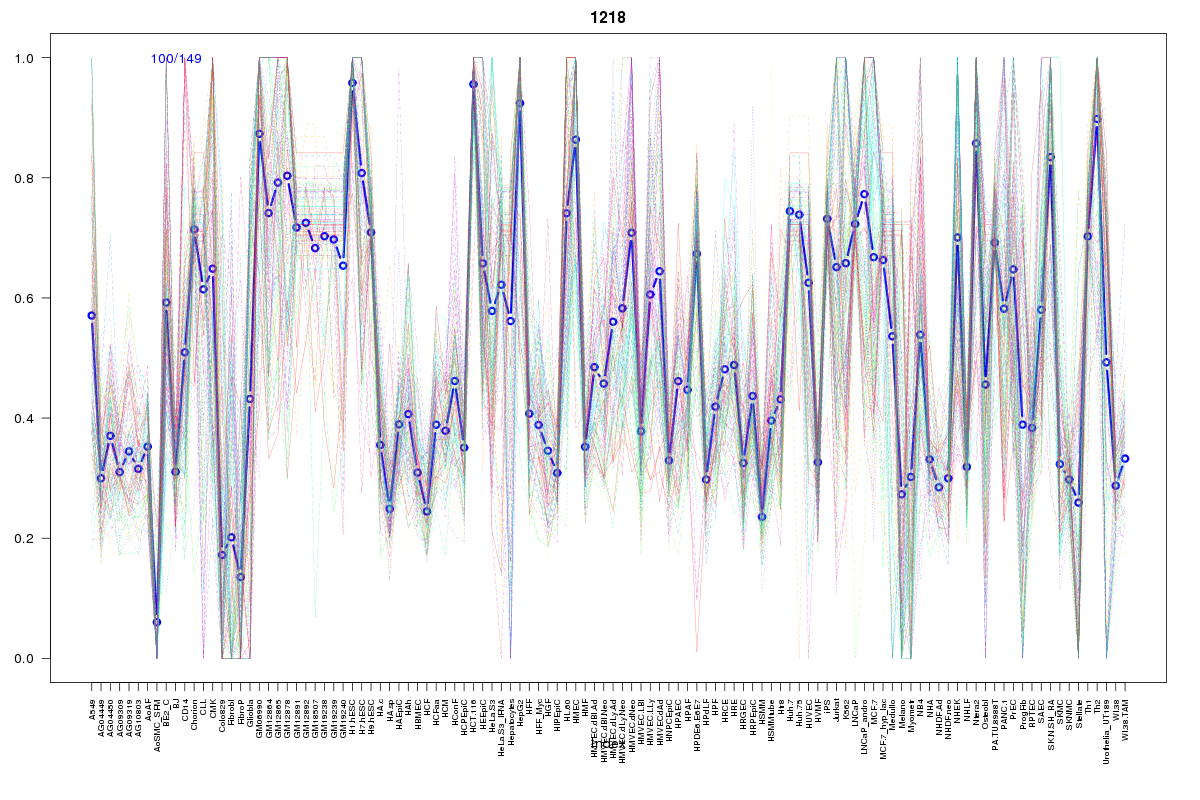 | 1218 | 1 |
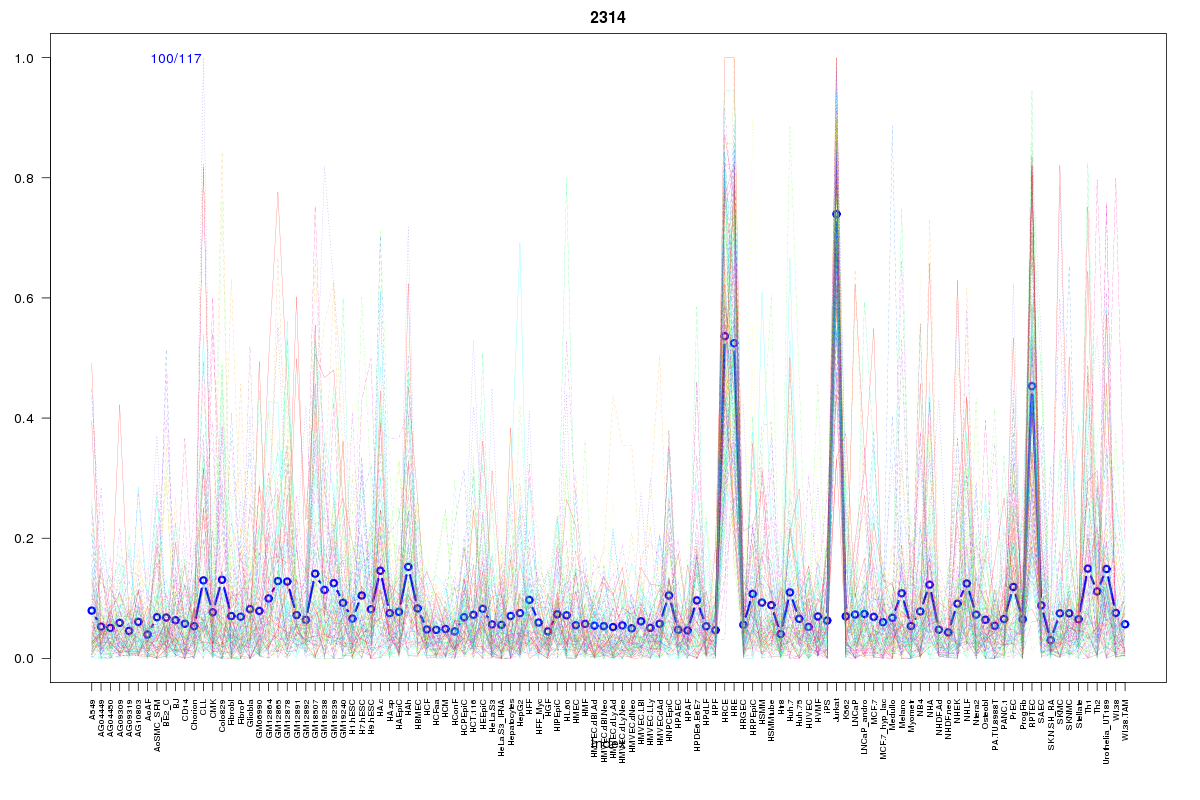 | 2314 | 1 |
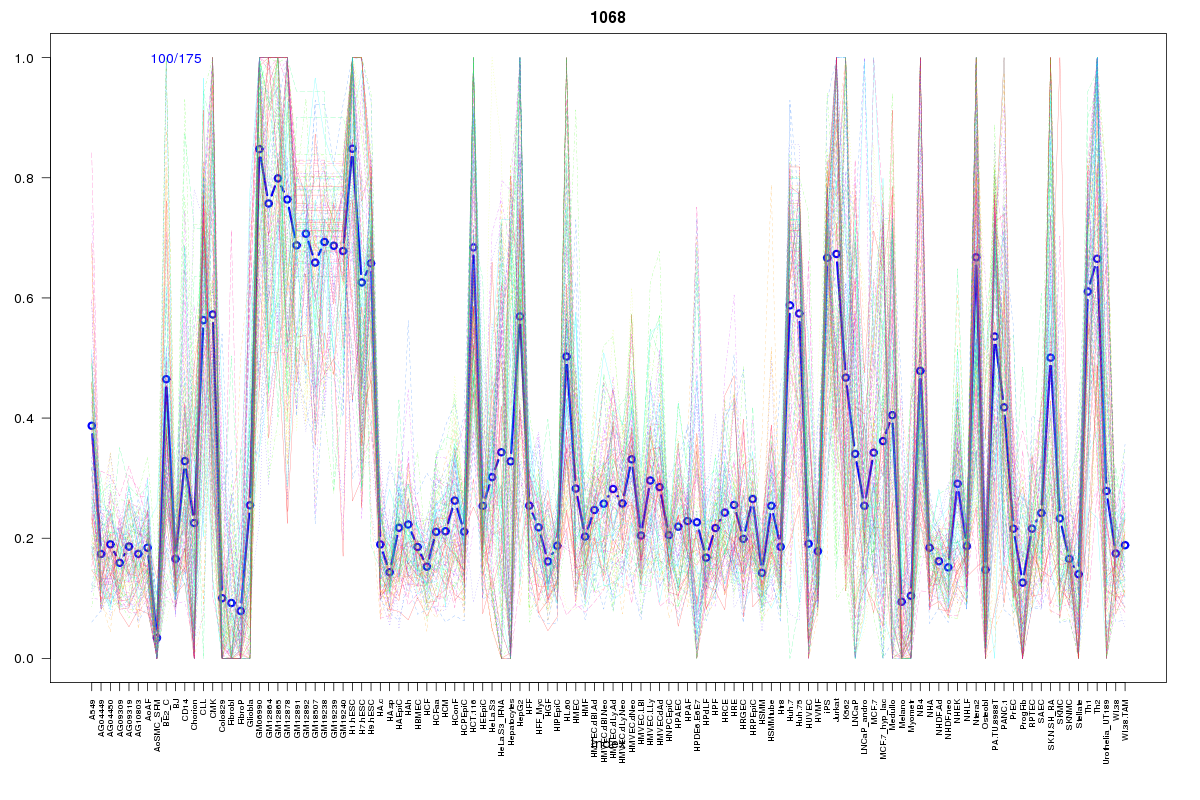 | 1068 | 1 |
 | 2216 | 1 |
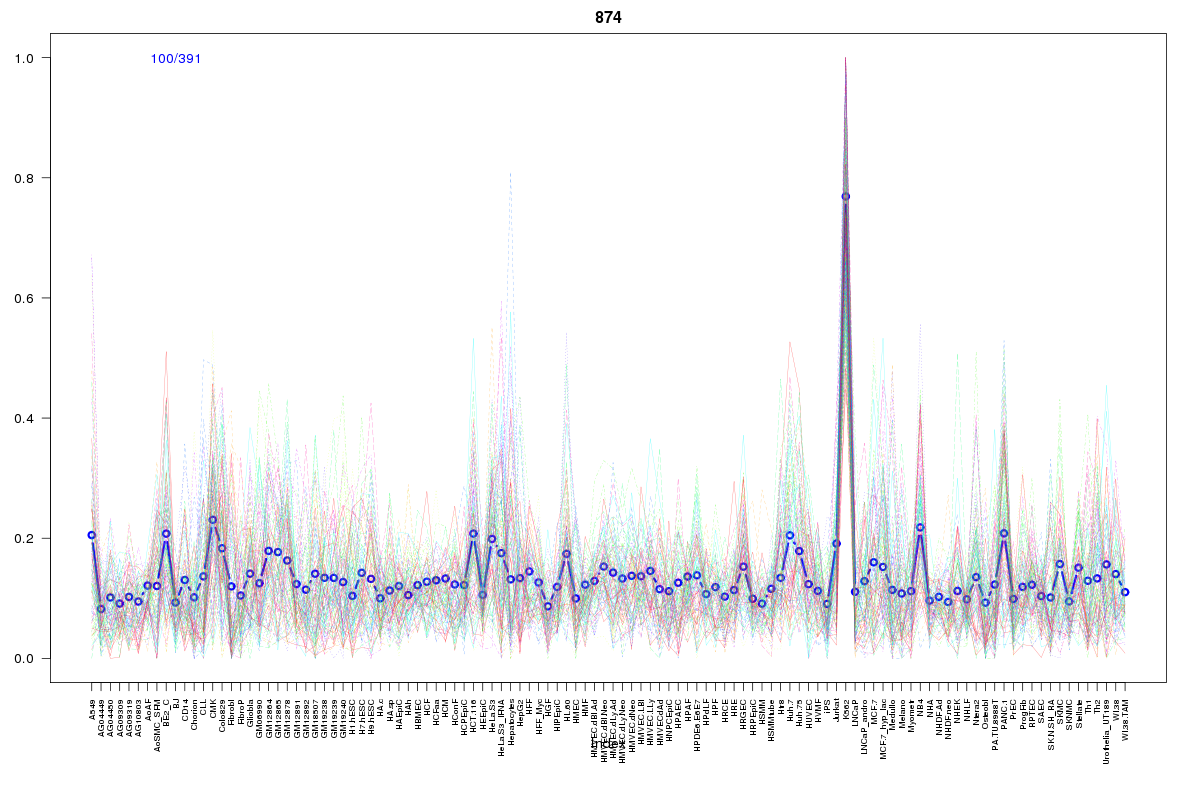 | 874 | 1 |
 | 130 | 1 |
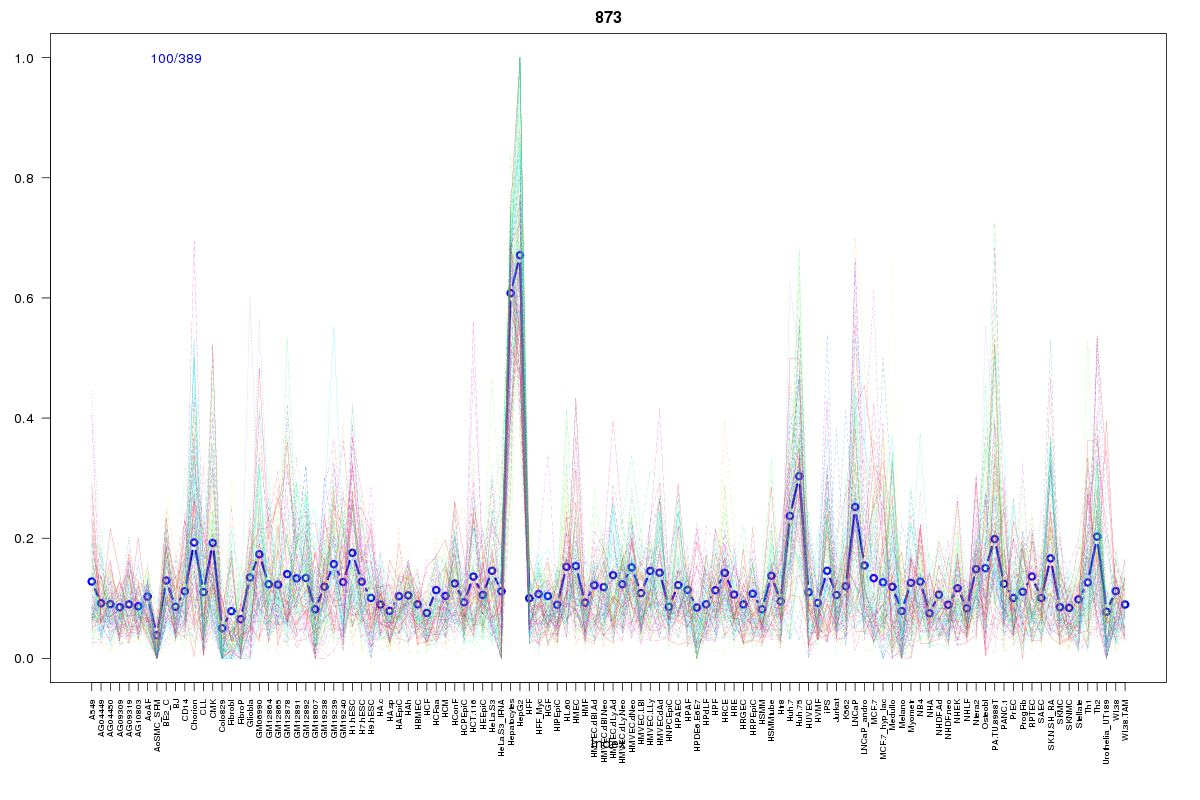 | 873 | 1 |
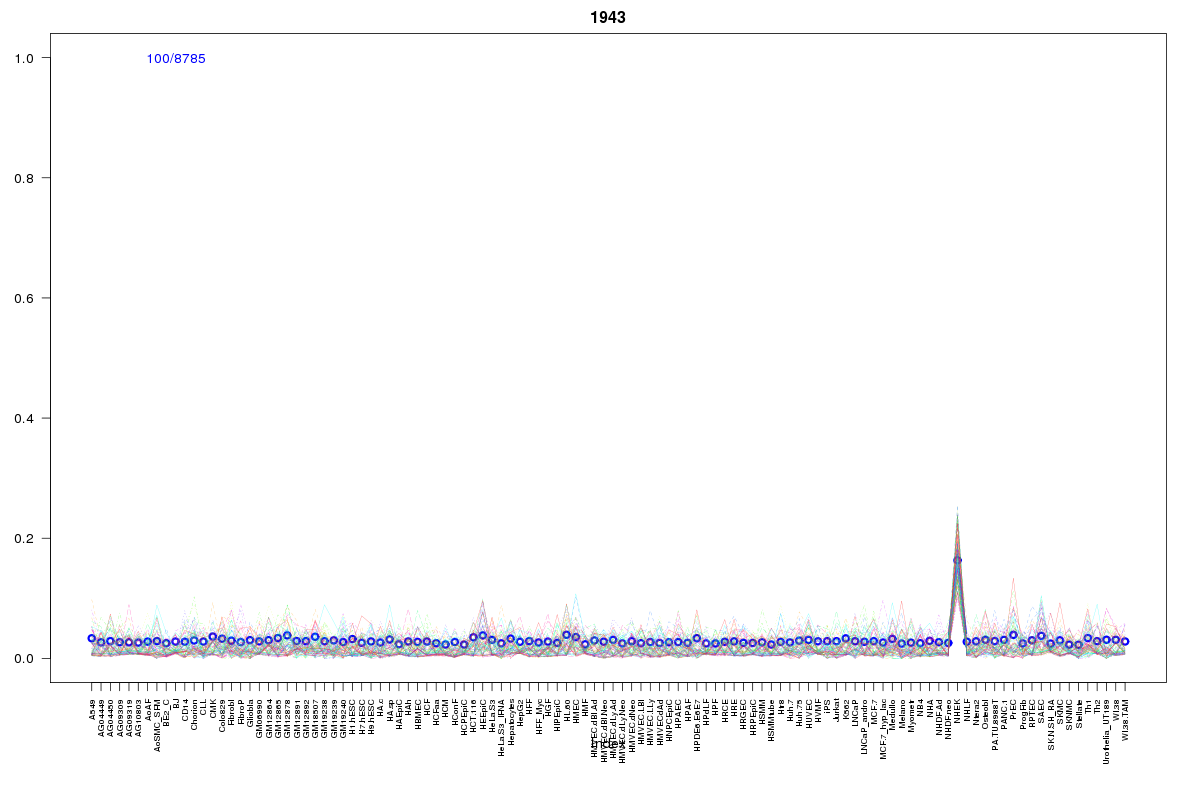 | 1943 | 1 |
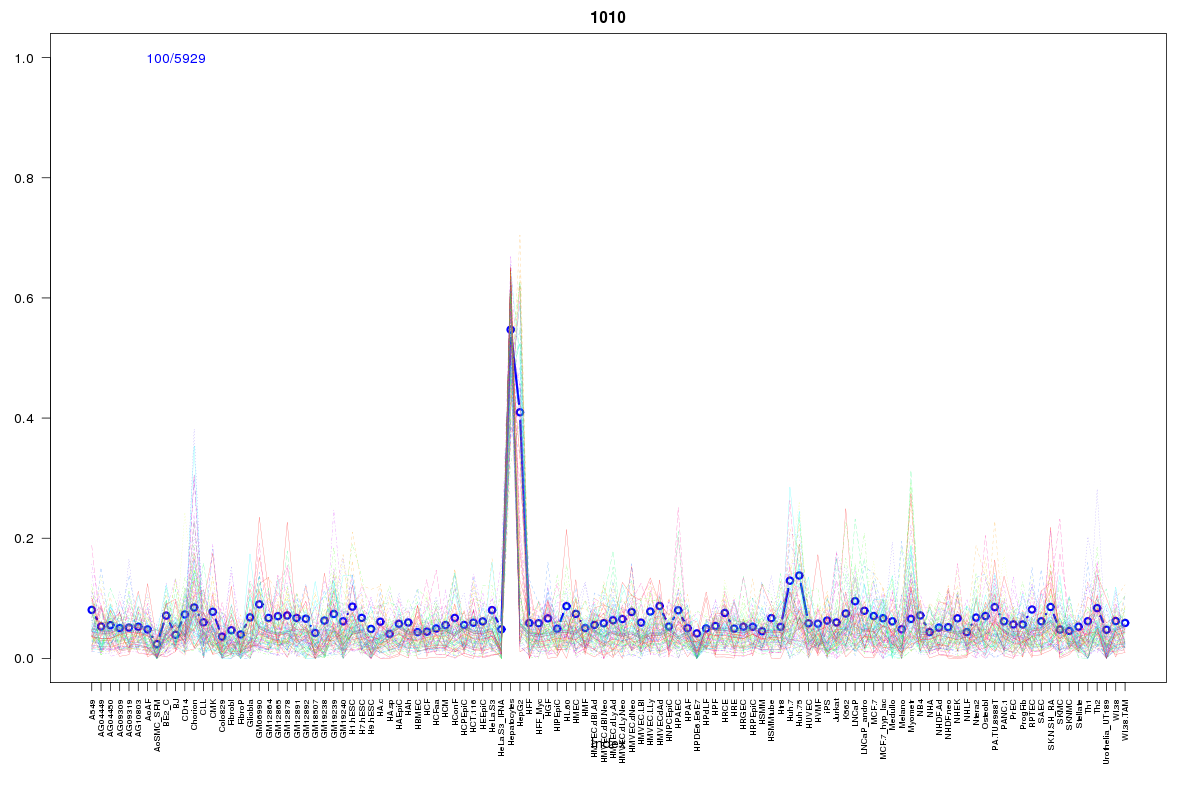 | 1010 | 1 |
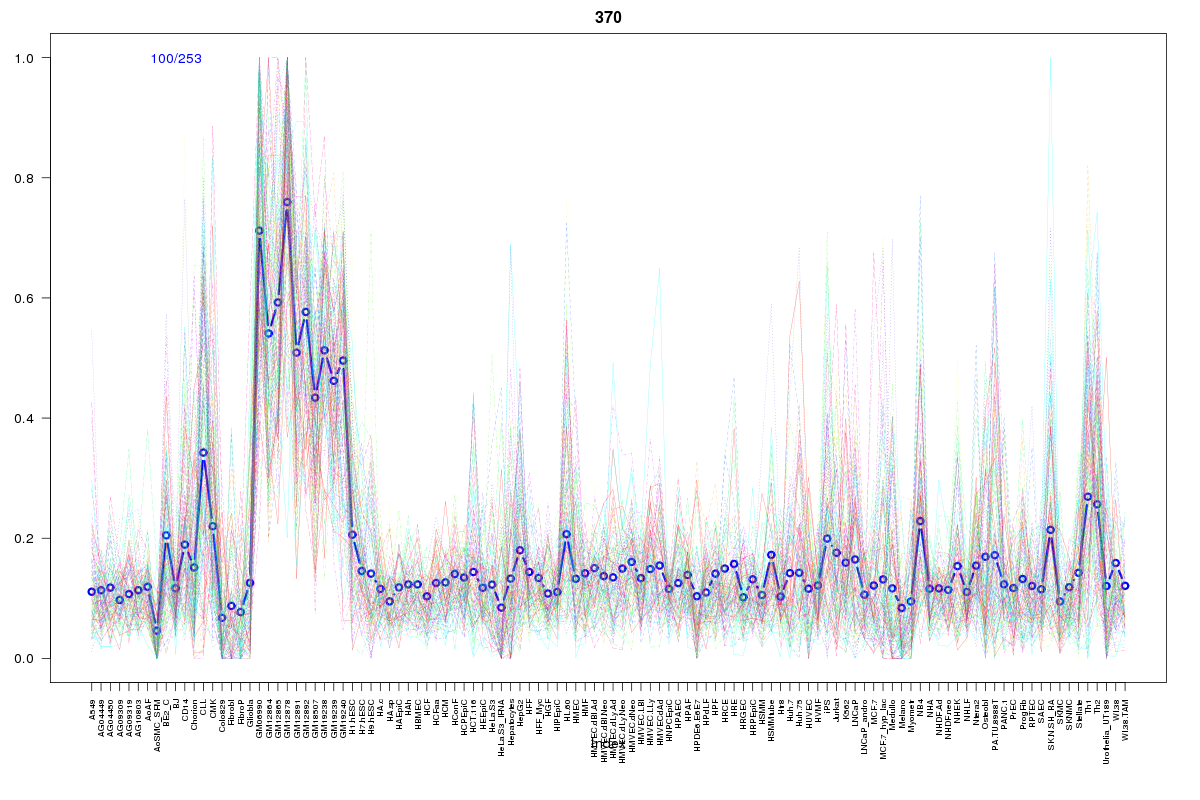 | 370 | 1 |
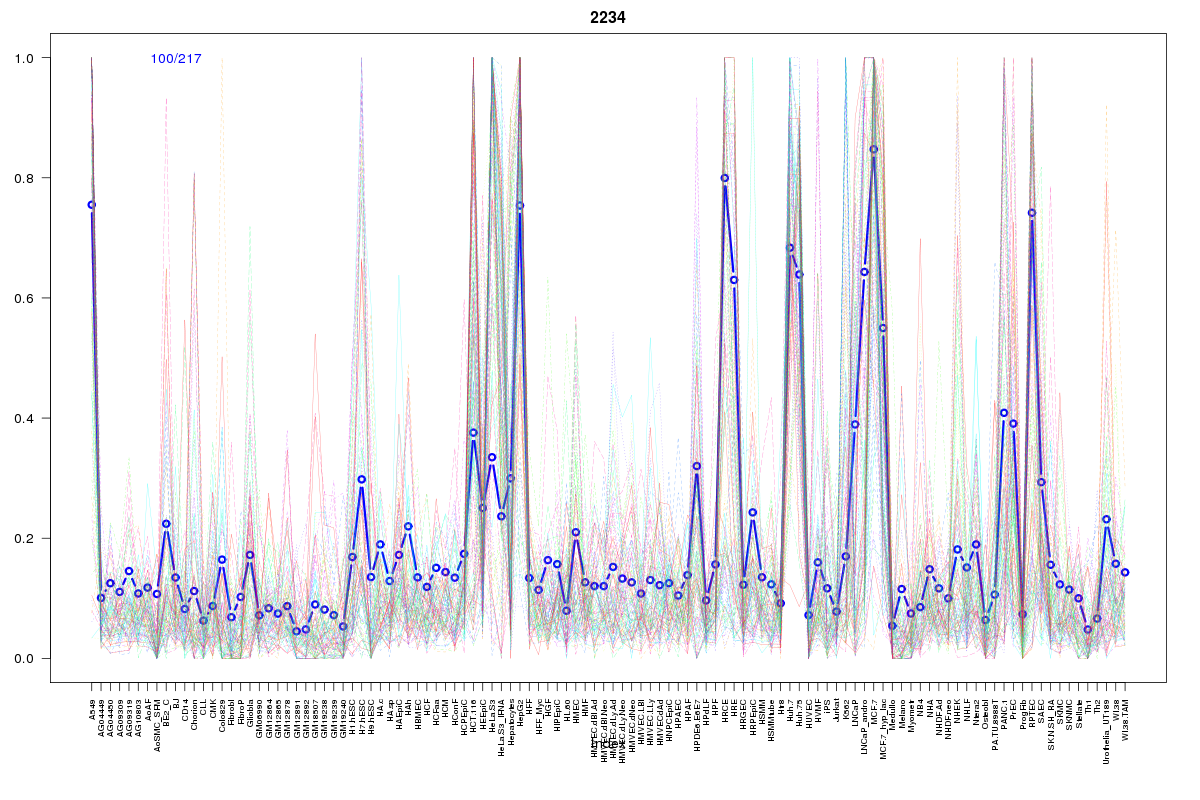 | 2234 | 1 |
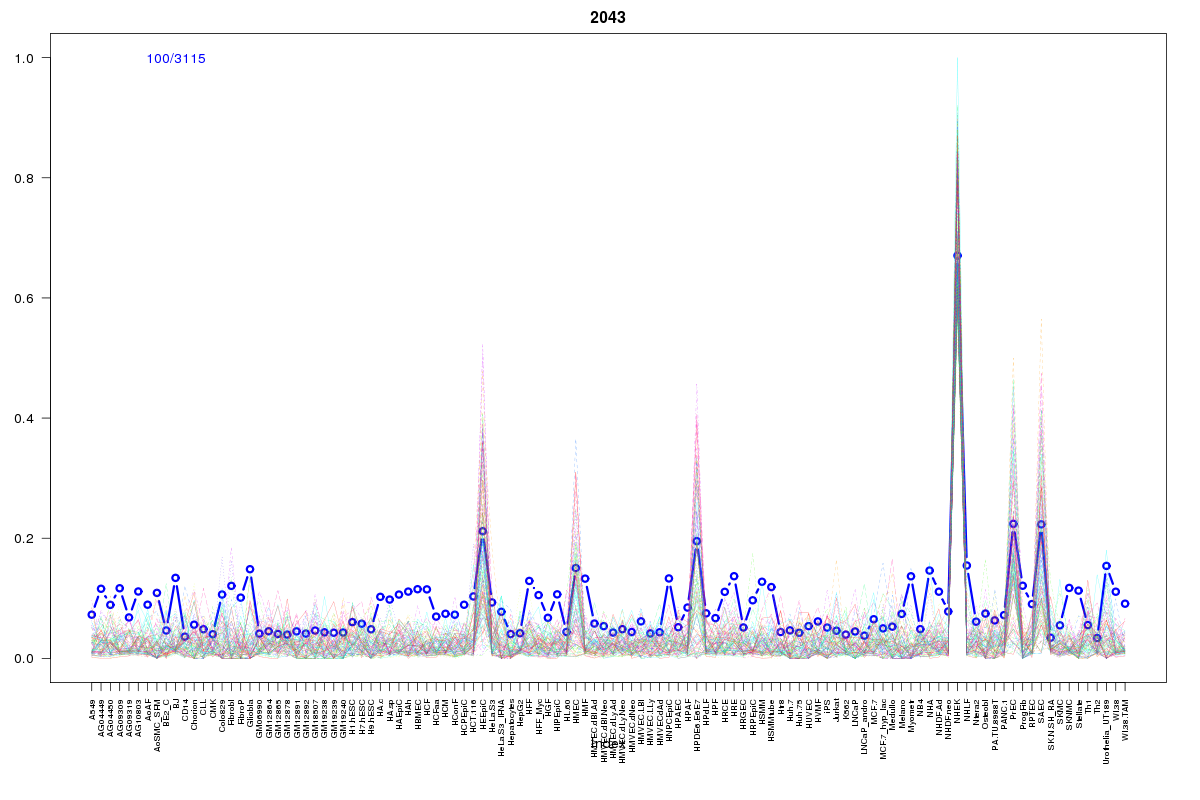 | 2043 | 1 |
 | 966 | 1 |
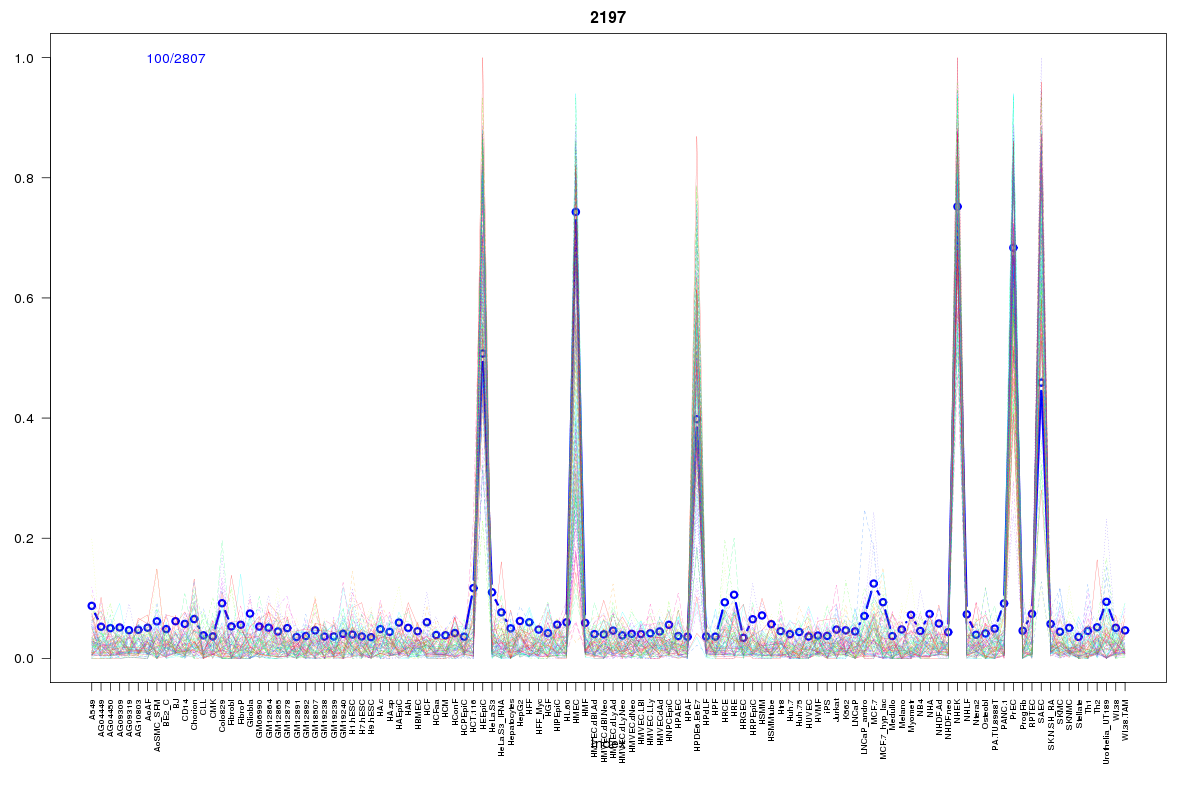 | 2197 | 1 |
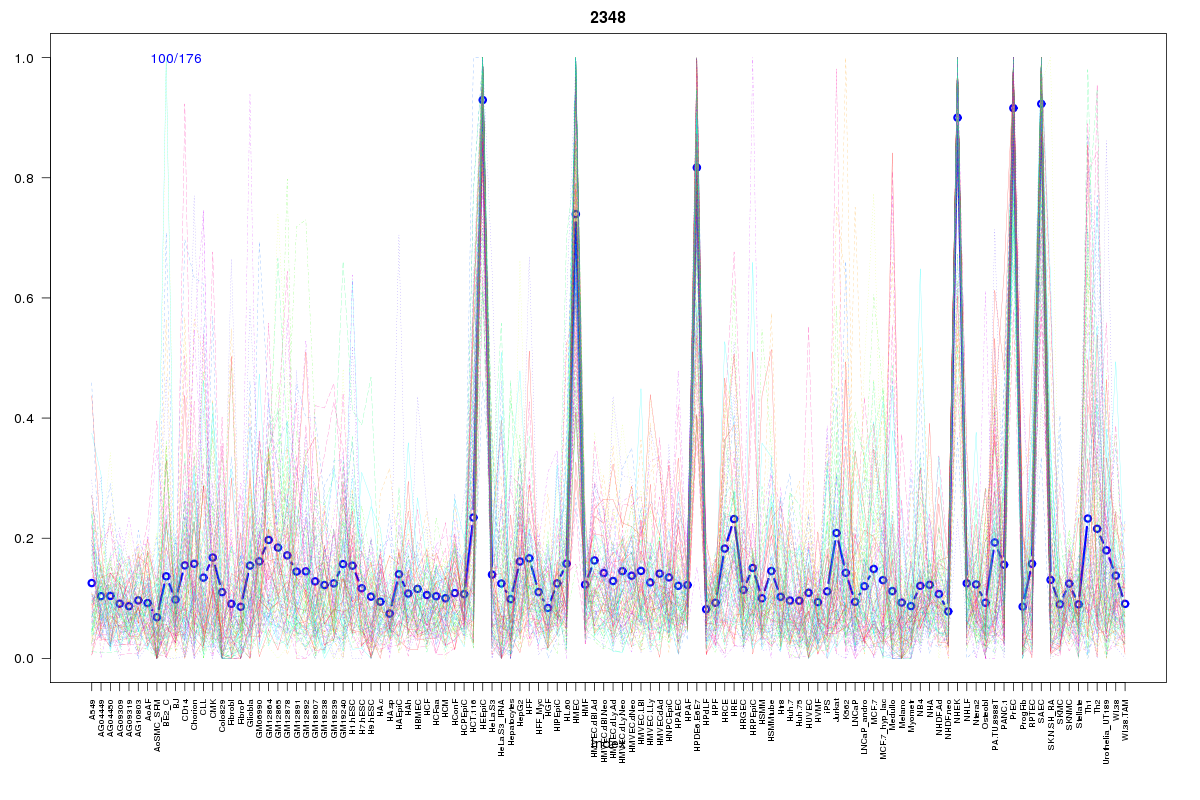 | 2348 | 1 |
 | 2394 | 1 |
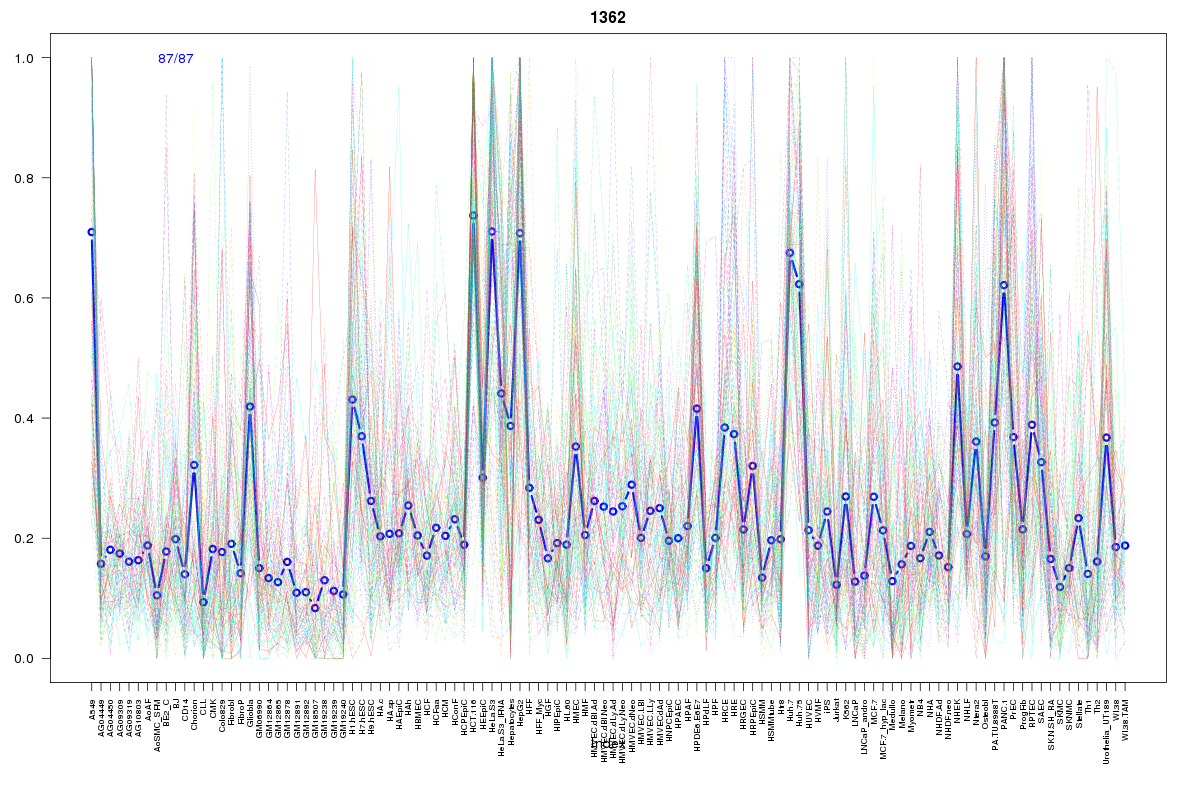 | 1362 | 1 |
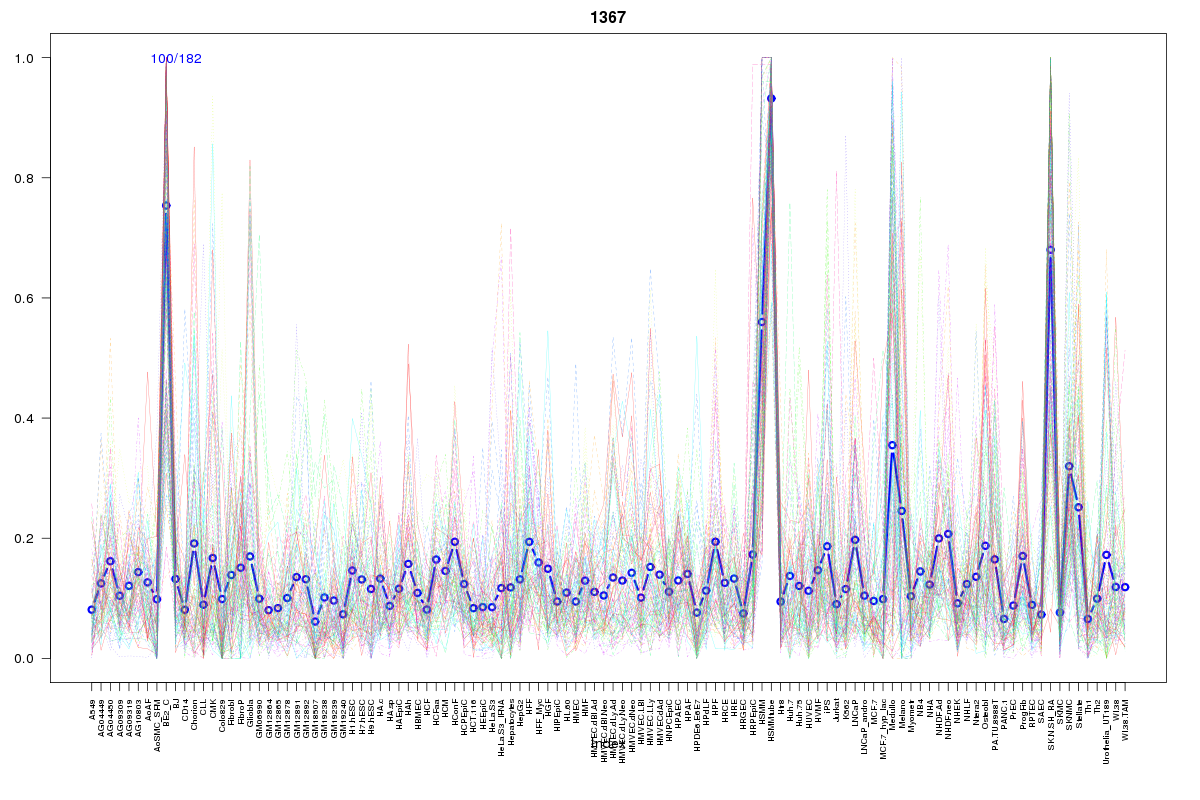 | 1367 | 1 |
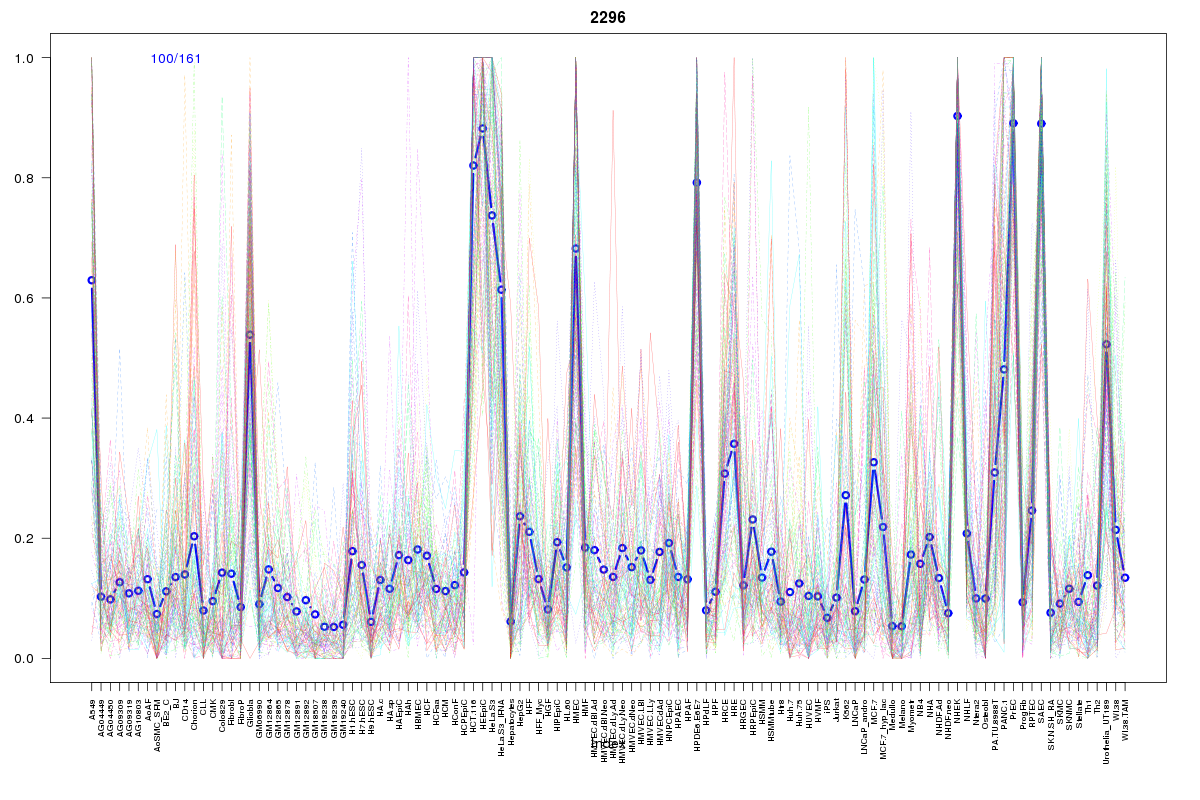 | 2296 | 1 |
 | 66 | 1 |
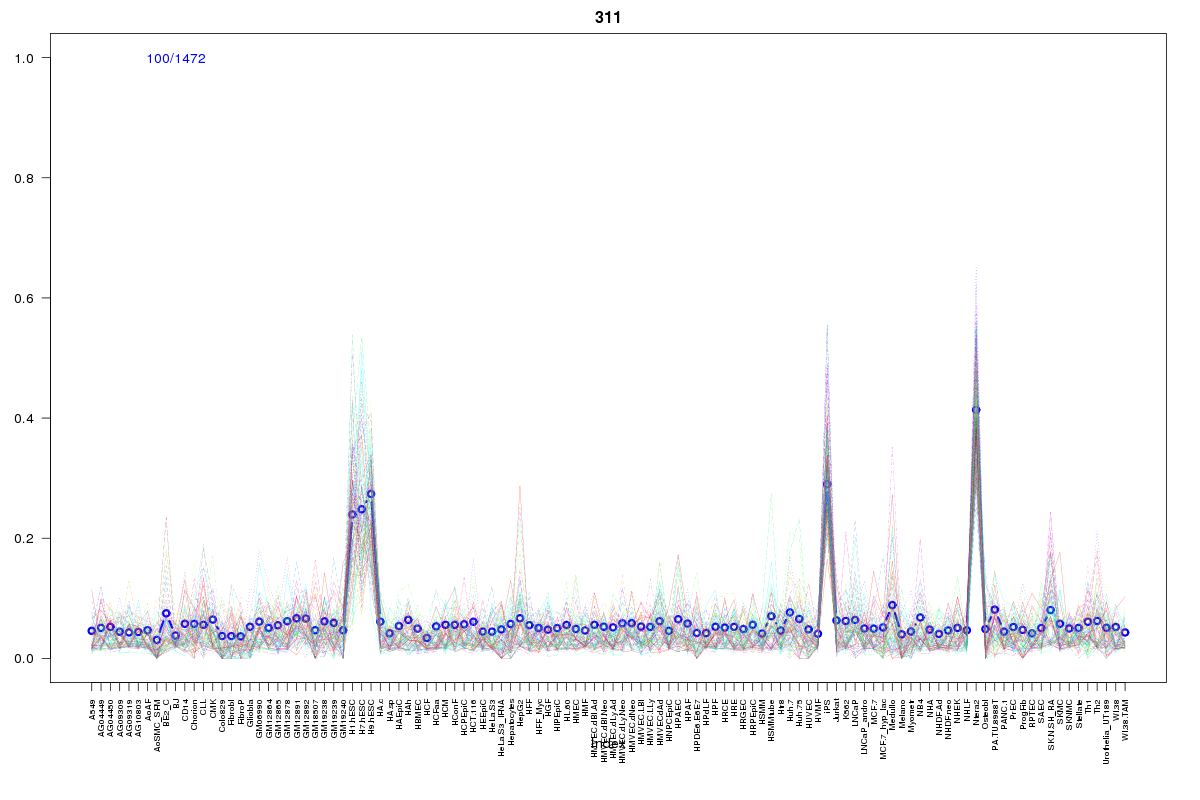 | 311 | 1 |
 | 62 | 1 |
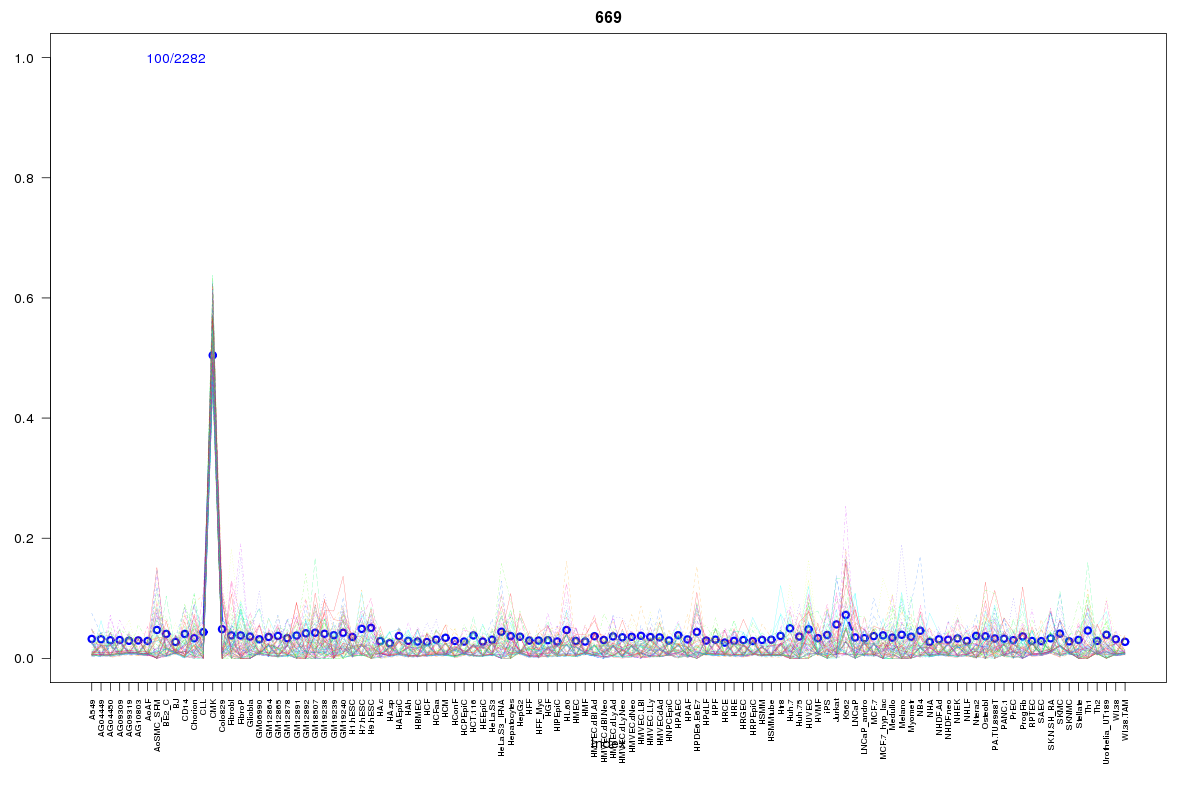 | 669 | 1 |
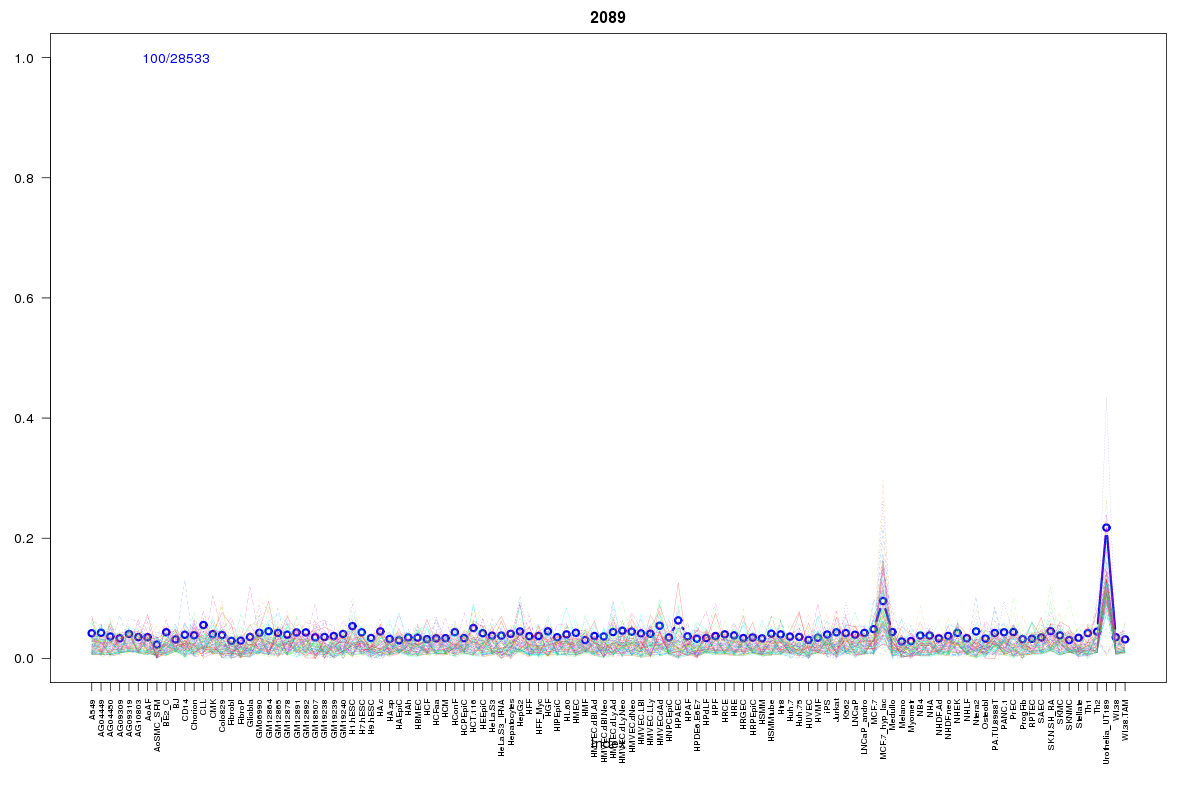 | 2089 | 1 |
 | 2052 | 1 |
 | 1755 | 1 |
 | 10 | 1 |
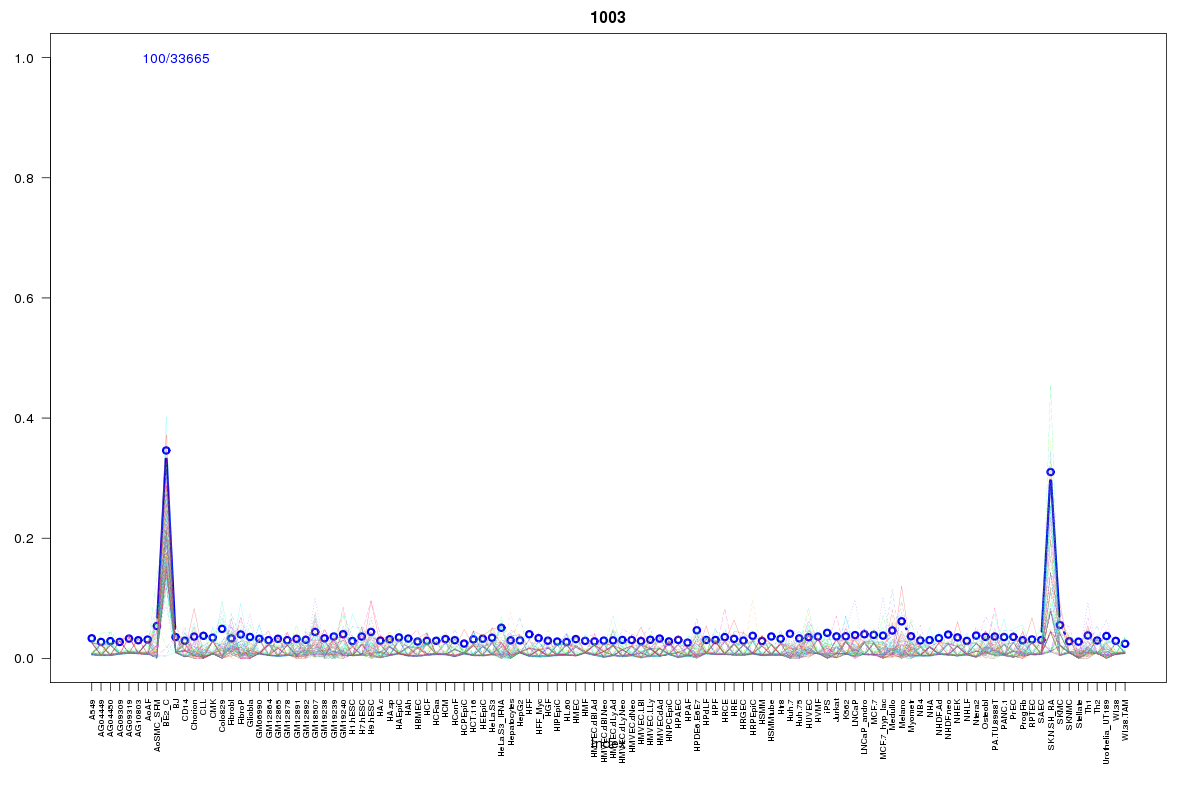 | 1003 | 1 |
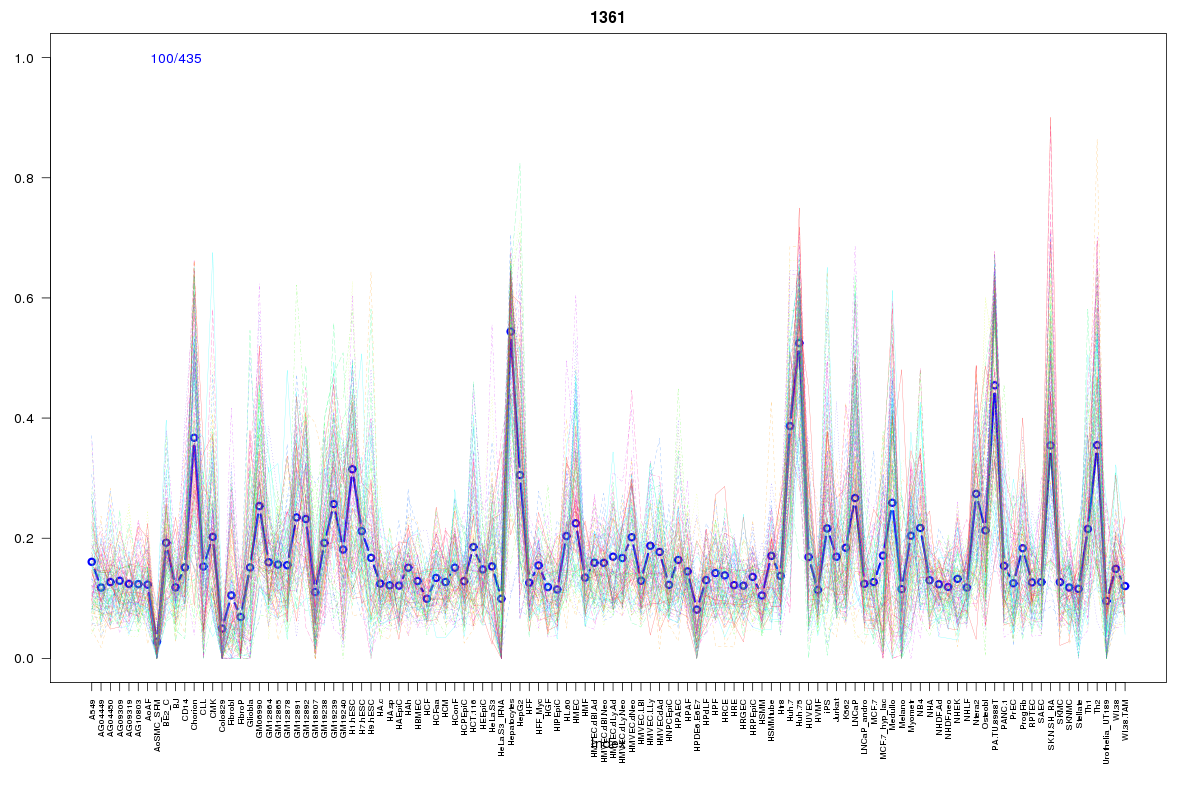 | 1361 | 1 |
Resources
BED file downloads
Connects to 36 DHS sitesTop 10 Correlated DHS Sites
p-values indiciate significant higher or lower correlation| Location | Cluster | P-value |
|---|---|---|
| chr17:27506320-27506470 | 1362 | 0 |
| chr17:27465700-27465850 | 2216 | 0 |
| chr17:27482700-27482850 | 2296 | 0 |
| chr17:27503760-27503910 | 1218 | 0.002 |
| chr17:27505205-27505355 | 2234 | 0.002 |
| chr17:27503465-27503615 | 1361 | 0.002 |
| chr17:27505645-27505795 | 2225 | 0.003 |
| chr17:27505825-27505975 | 2348 | 0.003 |
| chr17:27504860-27505010 | 2095 | 0.003 |
| chr17:27505045-27505195 | 1010 | 0.003 |
| chr17:27503085-27503235 | 825 | 0.005 |
External Databases
UCSCEnsembl (ENSG00000221995)