Gene: Y_RNA
chr8: 101767328-101767423Expression Profile
(log scale)
Graphical Connections
Distribution of linked clusters:
You may find it interesting if many of the connected DHS sites belong to the same cluster.| Cluster Profile | Cluster ID | Number of DHS sites in this cluster |
|---|---|---|
 | 600 | 1 |
 | 15 | 1 |
 | 1755 | 1 |
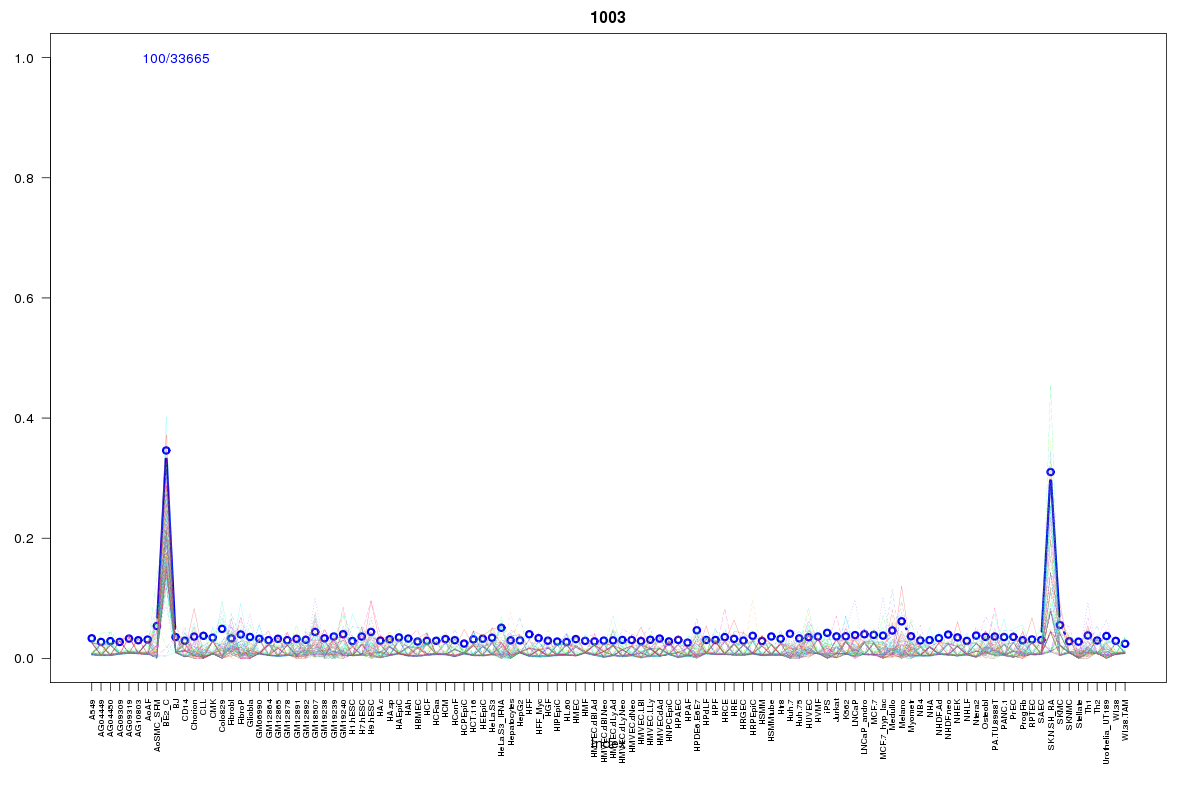 | 1003 | 1 |
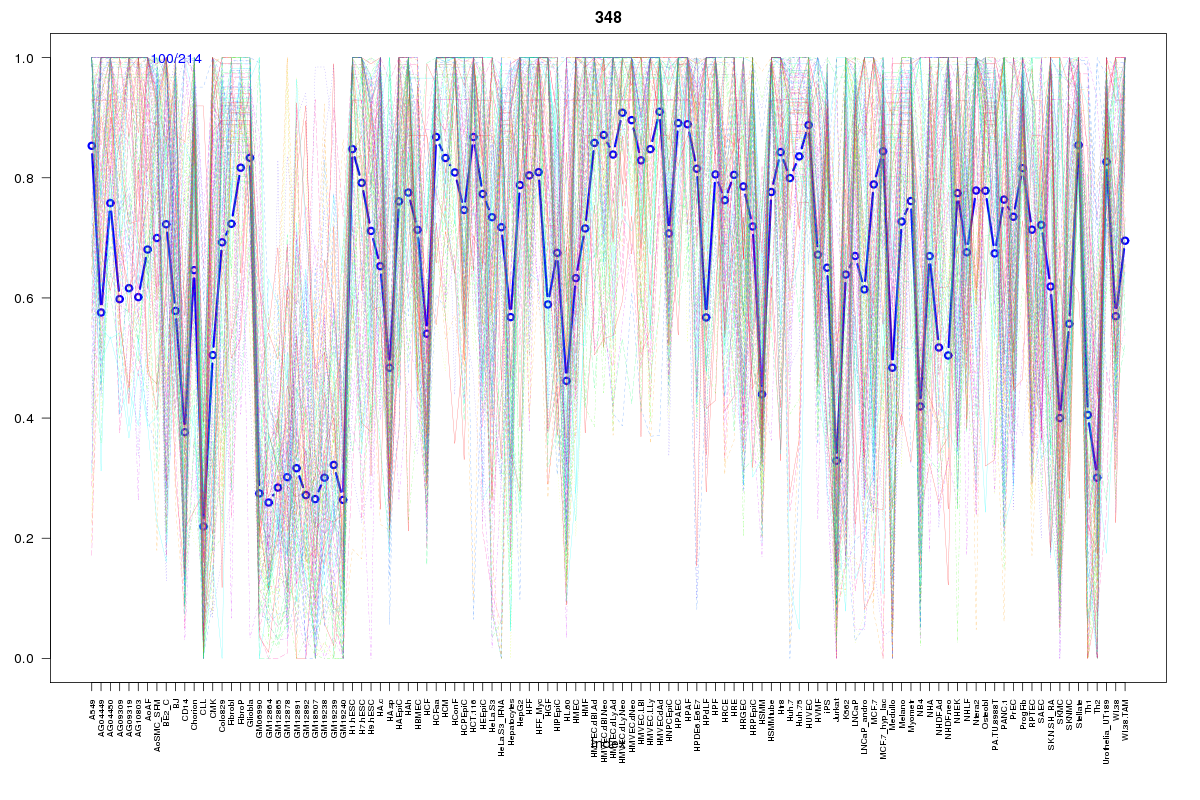 | 348 | 1 |
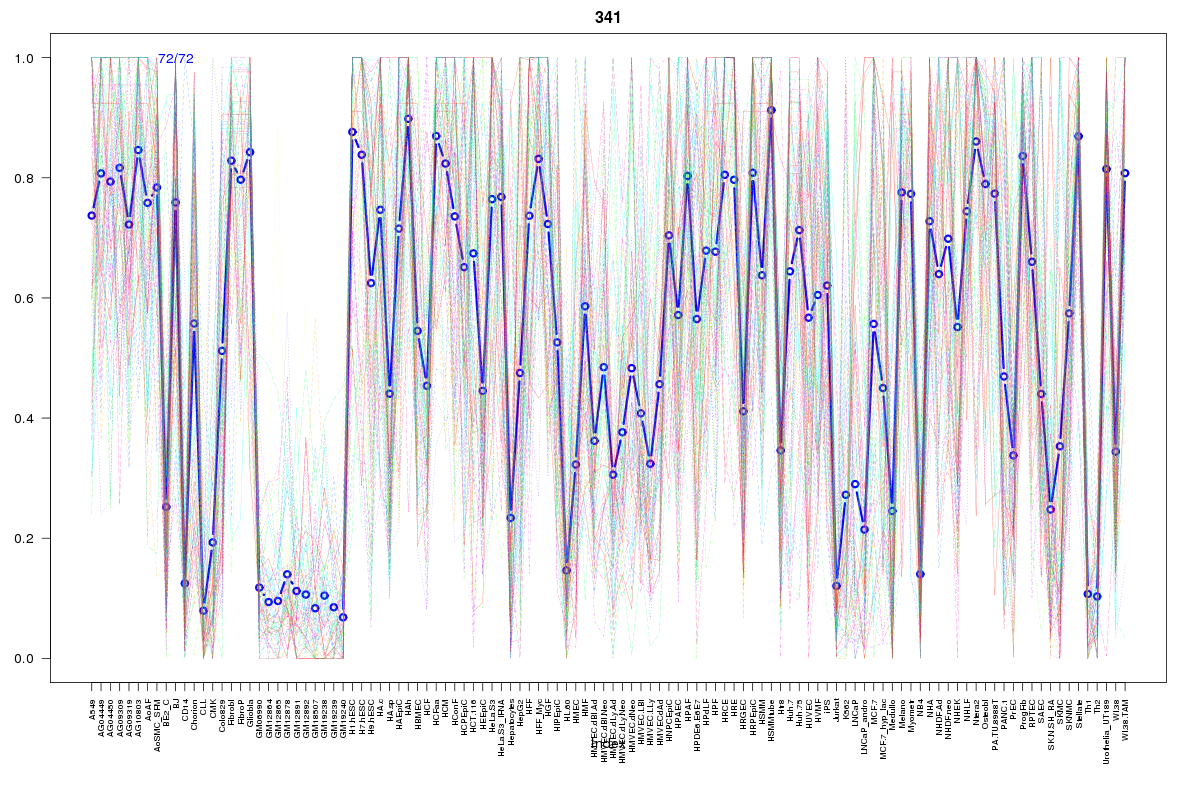 | 341 | 1 |
 | 37 | 1 |
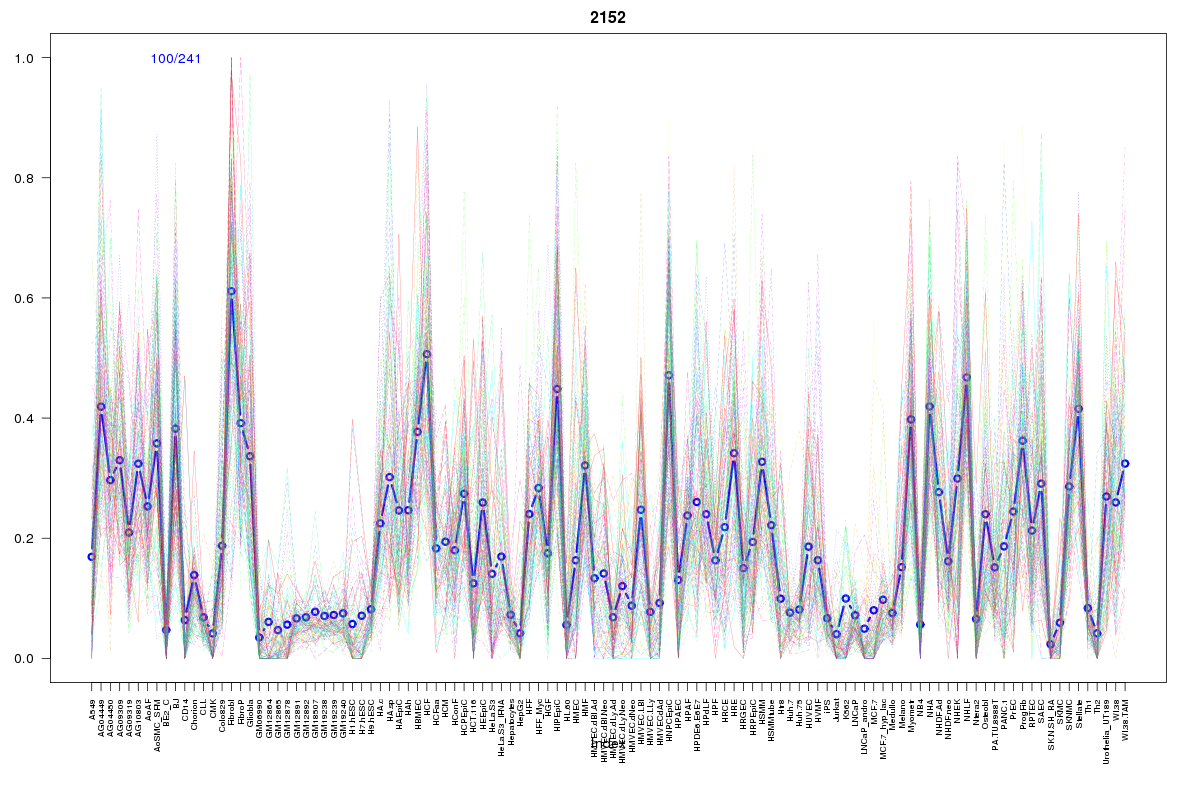 | 2152 | 1 |
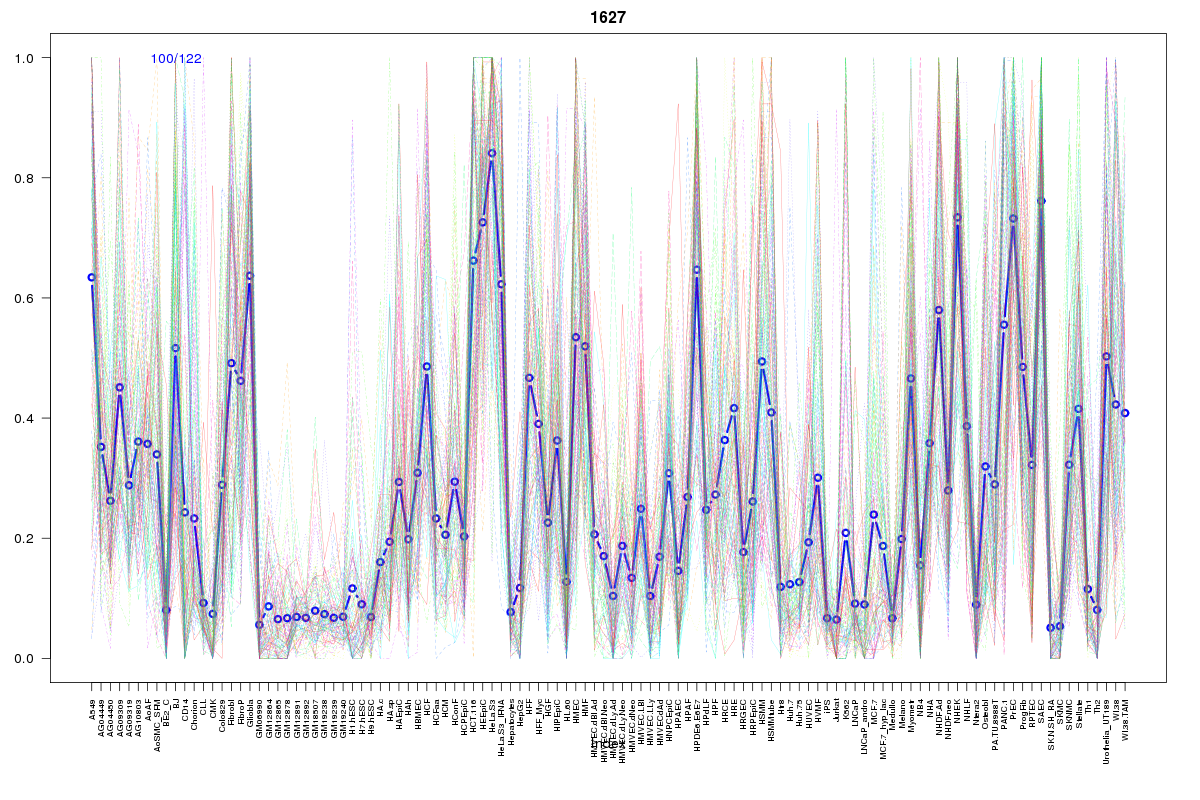 | 1627 | 1 |
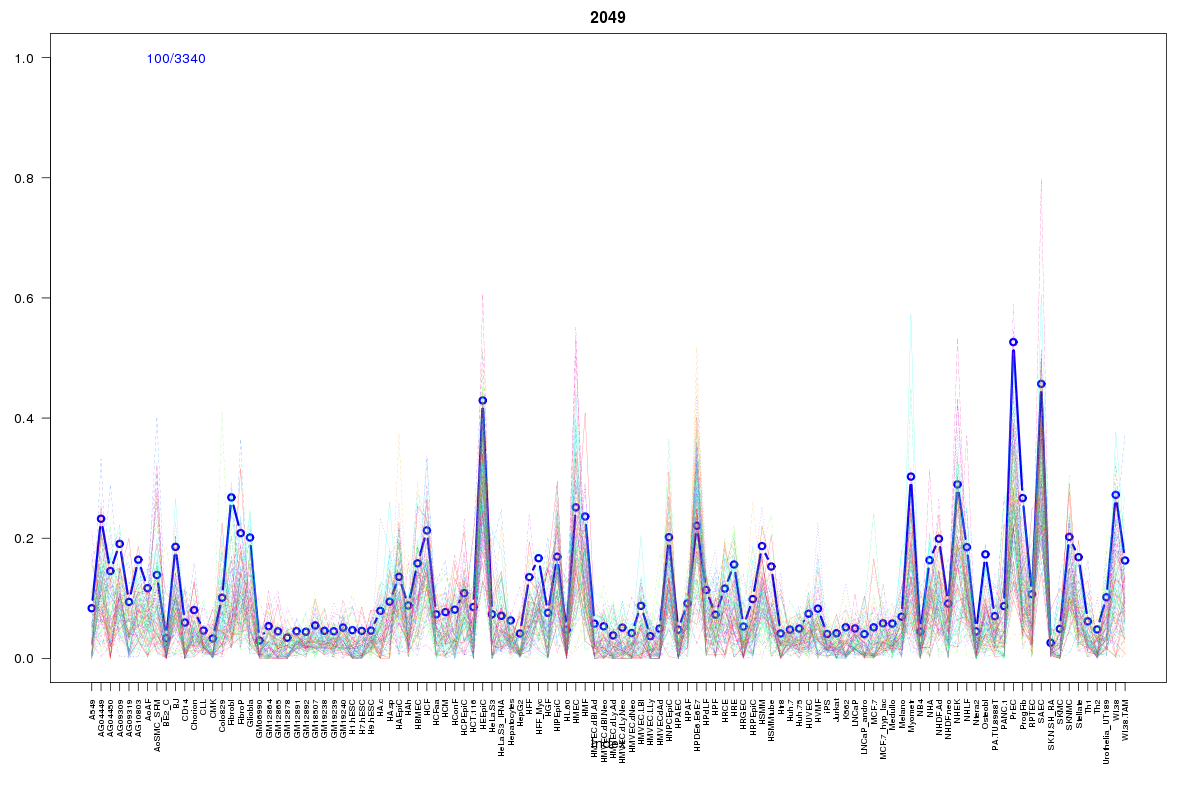 | 2049 | 1 |
Resources
BED file downloads
Connects to 10 DHS sitesTop 10 Correlated DHS Sites
p-values indiciate significant higher or lower correlation| Location | Cluster | P-value |
|---|---|---|
| chr8:101814860-101815010 | 15 | 0.003 |
| chr8:101837500-101837650 | 1003 | 0.013 |
| chr8:101833185-101833335 | 1755 | 0.021 |
| chr8:101788100-101788250 | 2049 | 0.024 |
| chr8:101774140-101774290 | 1627 | 0.016 |
| chr8:101726380-101726530 | 2152 | 0.015 |
| chr8:101859740-101859890 | 348 | 0.007 |
| chr8:101680000-101680150 | 37 | 0.006 |
| chr8:101801260-101801410 | 600 | 0.001 |
| chr8:101679845-101679995 | 341 | 0.001 |
External Databases
UCSCEnsembl (ENSG00000202001)