Gene: PTAR1
chr9: 72324437-72374857Expression Profile
(log scale)
Graphical Connections
Distribution of linked clusters:
You may find it interesting if many of the connected DHS sites belong to the same cluster.| Cluster Profile | Cluster ID | Number of DHS sites in this cluster |
|---|---|---|
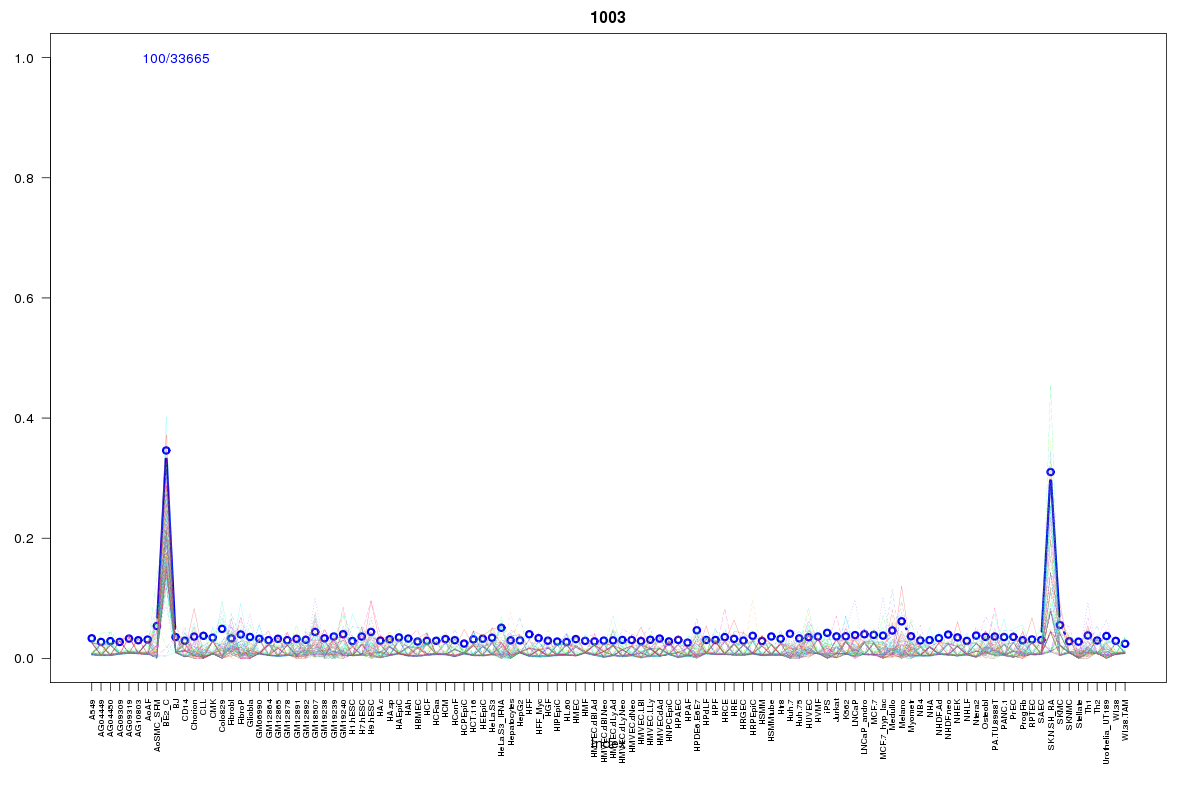 | 1003 | 2 |
 | 1605 | 1 |
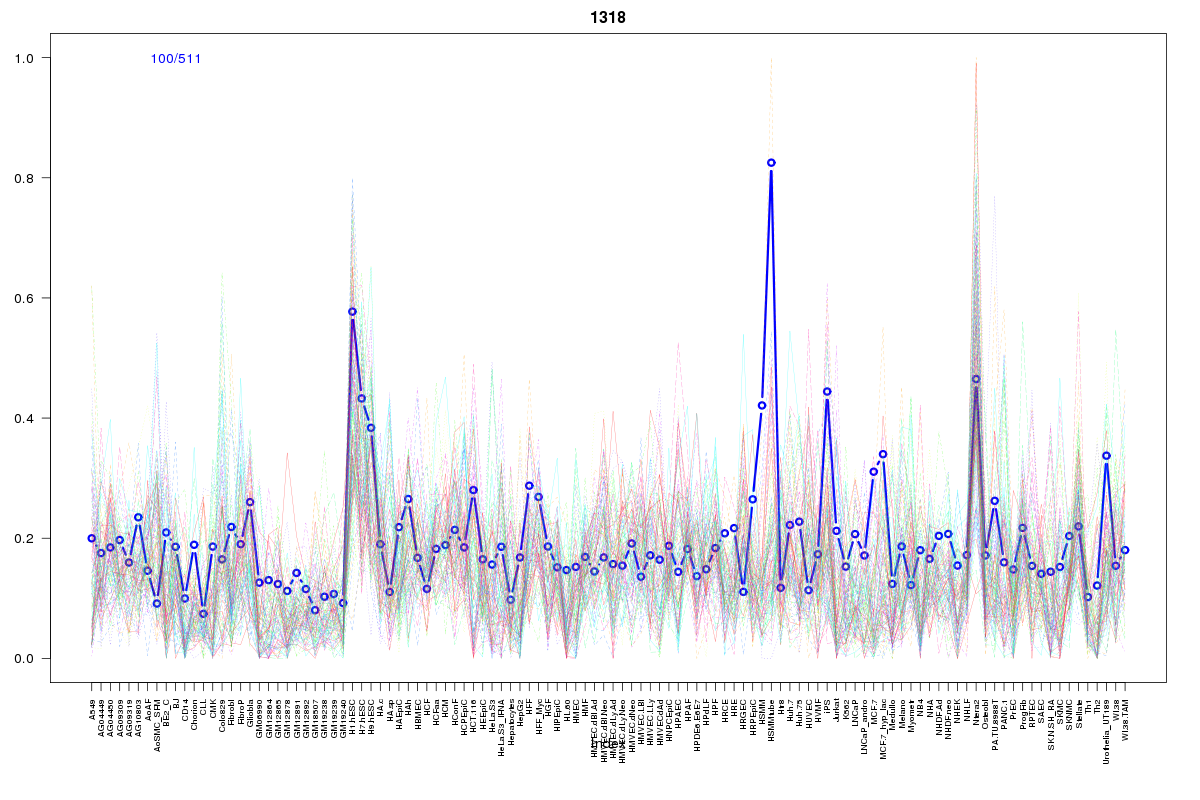 | 1318 | 1 |
 | 10 | 1 |
 | 158 | 1 |
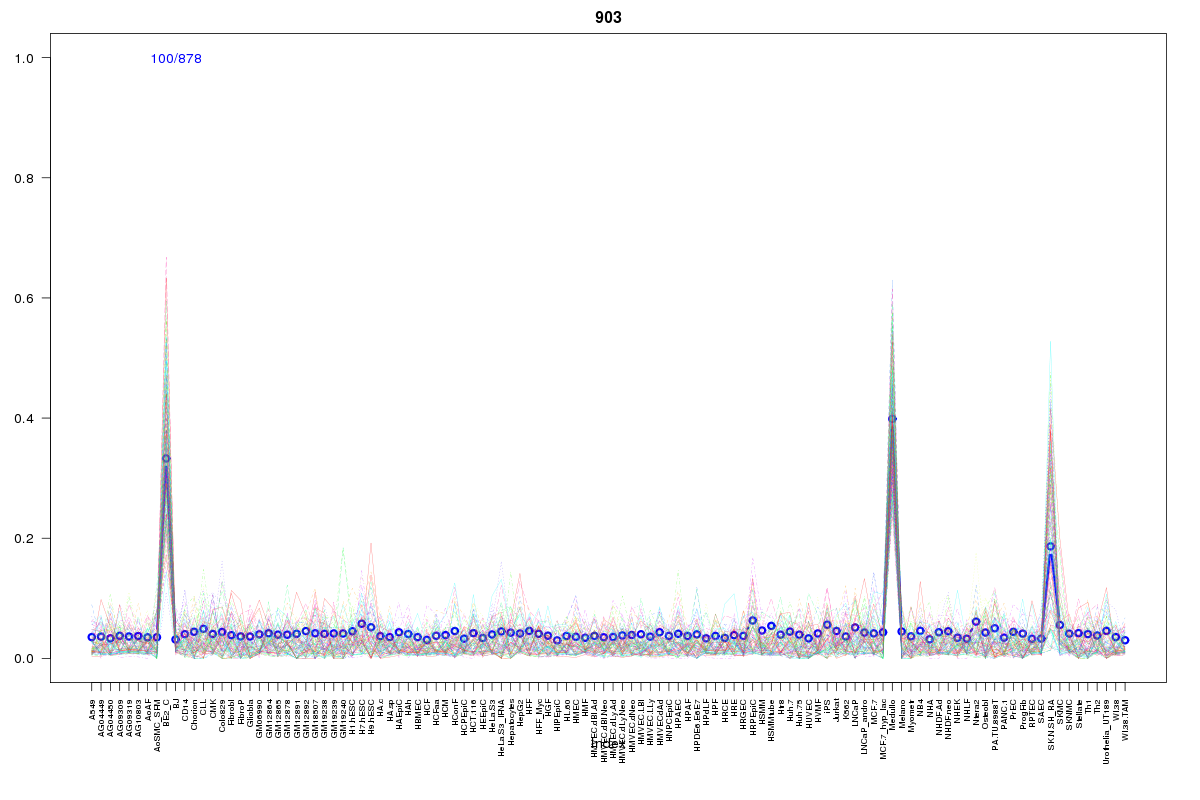 | 903 | 1 |
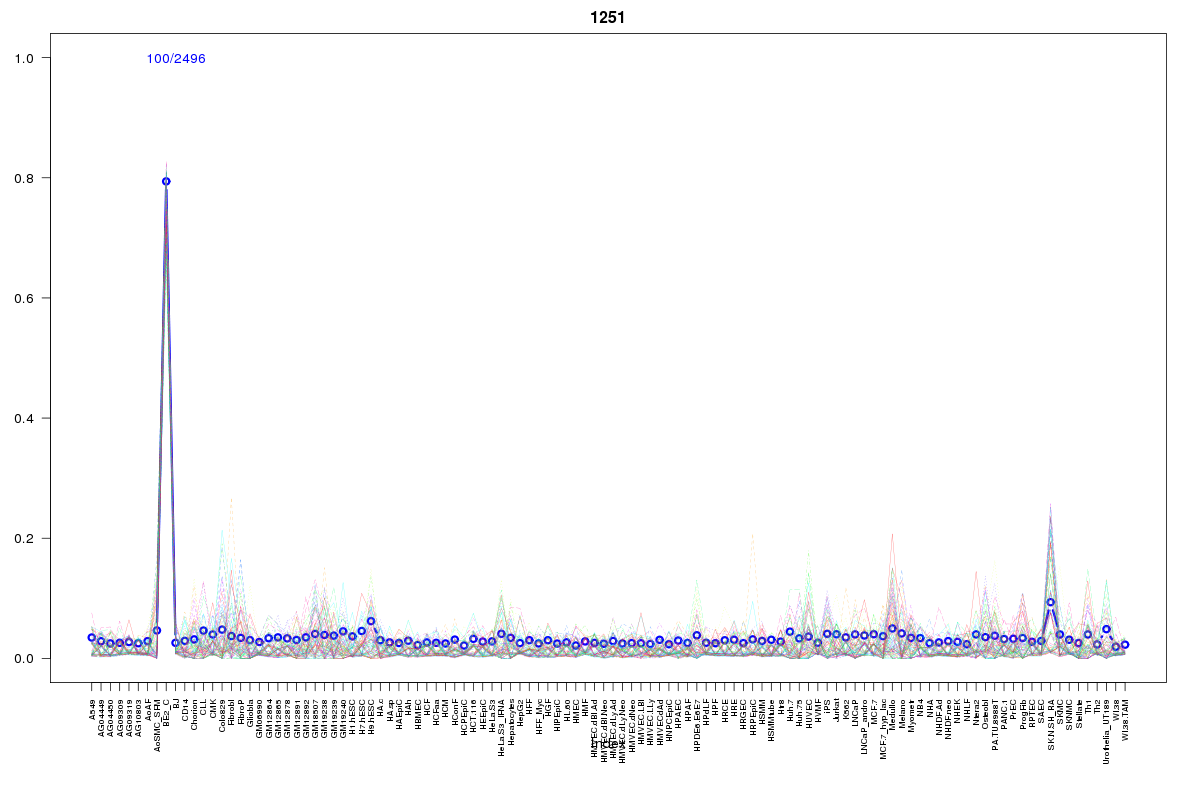 | 1251 | 1 |
 | 2322 | 1 |
Resources
BED file downloads
Connects to 9 DHS sitesTop 10 Correlated DHS Sites
p-values indiciate significant higher or lower correlation| Location | Cluster | P-value |
|---|---|---|
| chr9:72424340-72424490 | 1318 | 0 |
| chr9:72427860-72428010 | 1003 | 0.003 |
| chr9:72312460-72312610 | 1003 | 0.012 |
| chr9:72415945-72416095 | 1605 | 0.012 |
| chr9:72288365-72288515 | 903 | 0.013 |
| chr9:72415080-72415230 | 1251 | 0.013 |
| chr9:72415540-72415690 | 2322 | 0.013 |
| chr9:72282320-72282470 | 158 | 0.017 |
| chr9:72439500-72439650 | 10 | 0.022 |
External Databases
UCSCEnsembl (ENSG00000188647)