Gene: ADH1A
chr4: 100197523-100212185Expression Profile
(log scale)
Graphical Connections
Distribution of linked clusters:
You may find it interesting if many of the connected DHS sites belong to the same cluster.| Cluster Profile | Cluster ID | Number of DHS sites in this cluster |
|---|---|---|
 | 1493 | 4 |
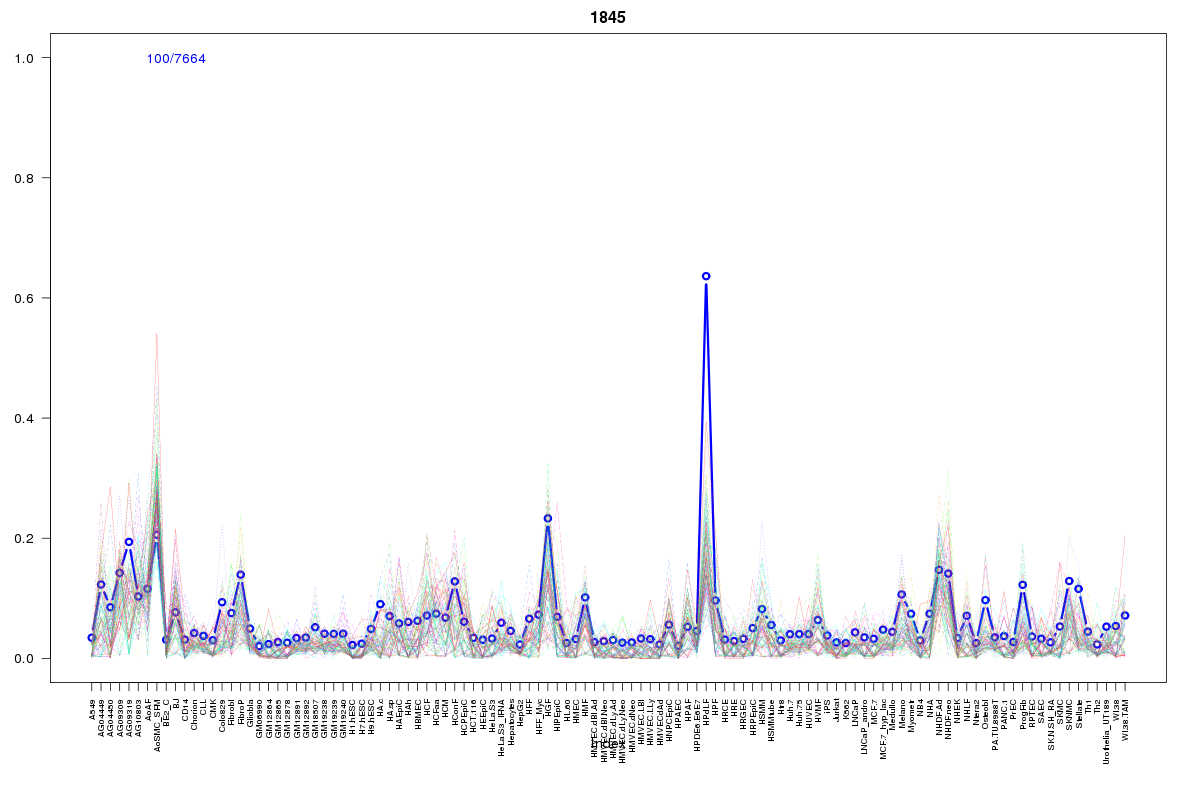 | 1845 | 3 |
 | 1605 | 2 |
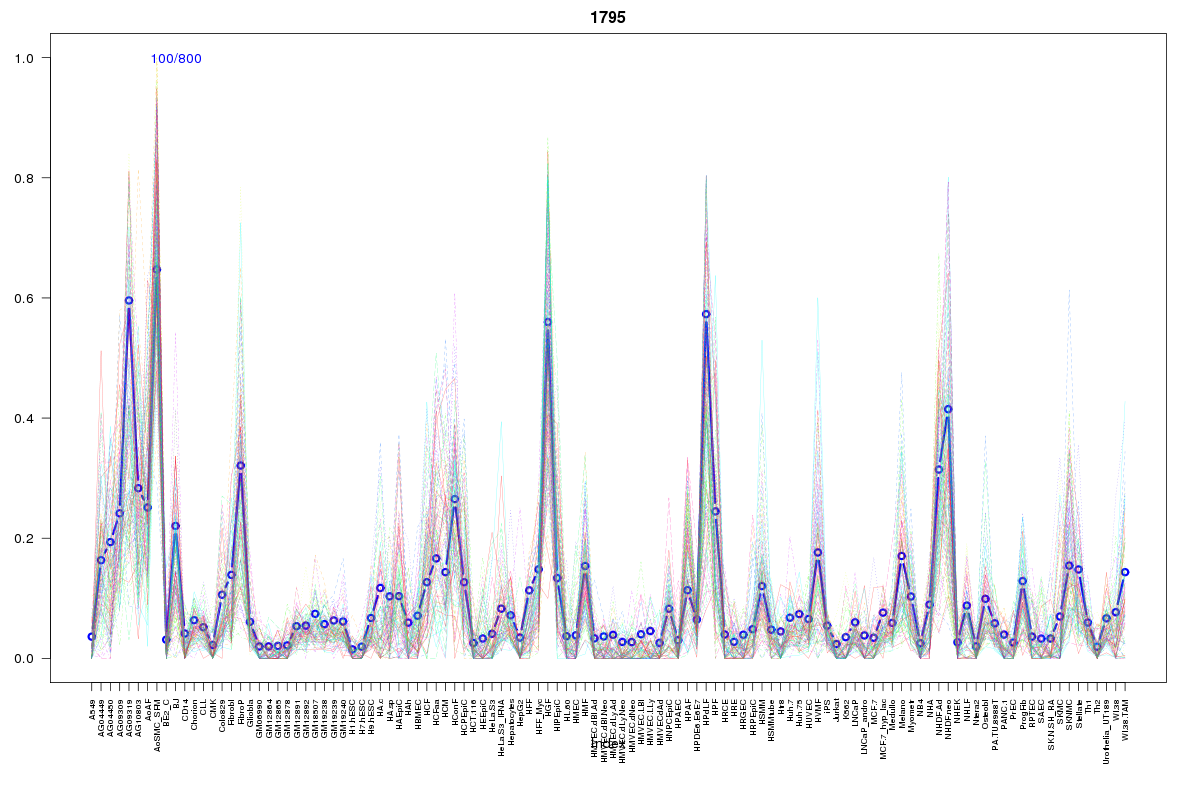 | 1795 | 2 |
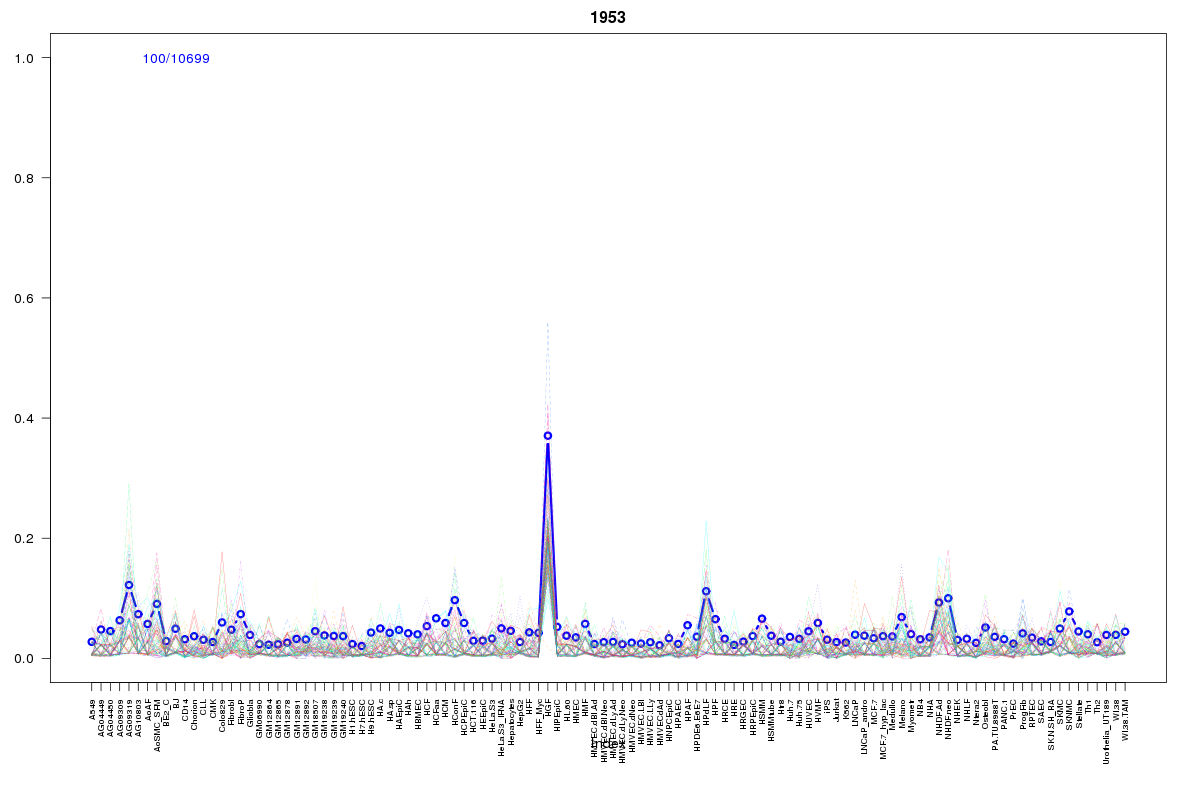 | 1953 | 2 |
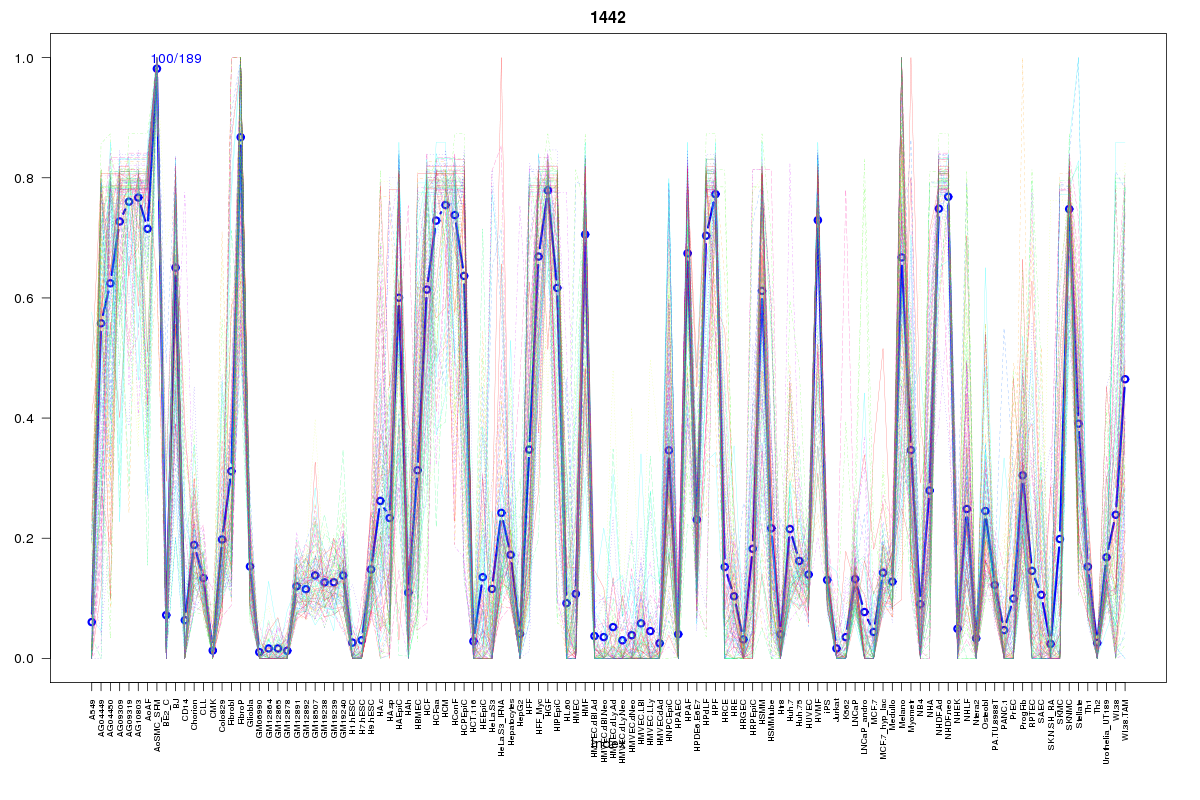 | 1442 | 2 |
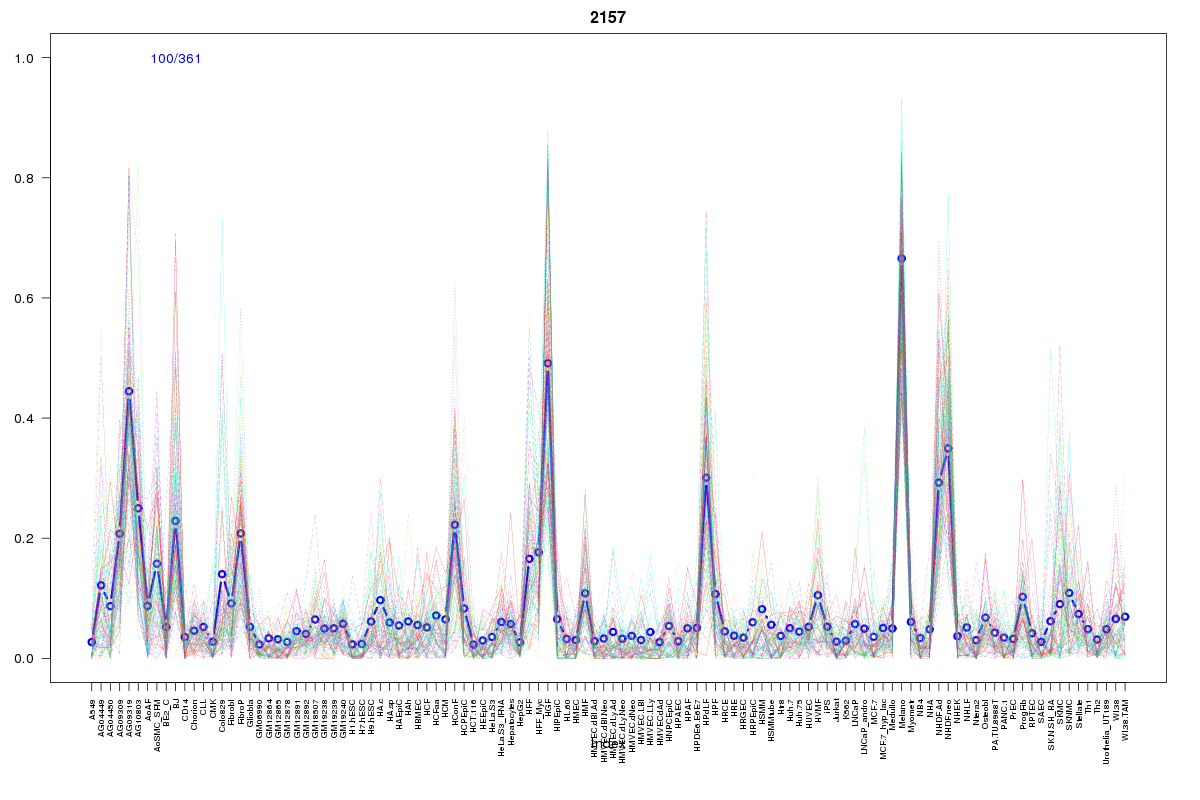 | 2157 | 1 |
 | 1595 | 1 |
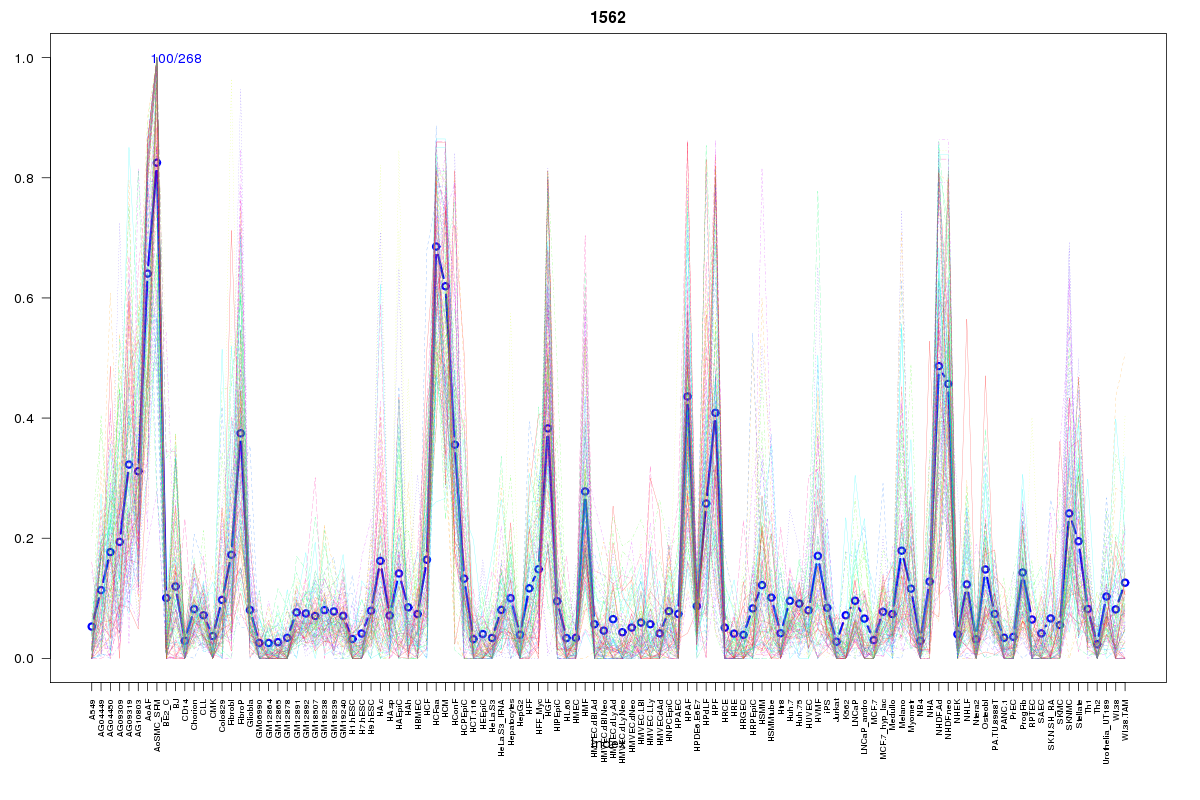 | 1562 | 1 |
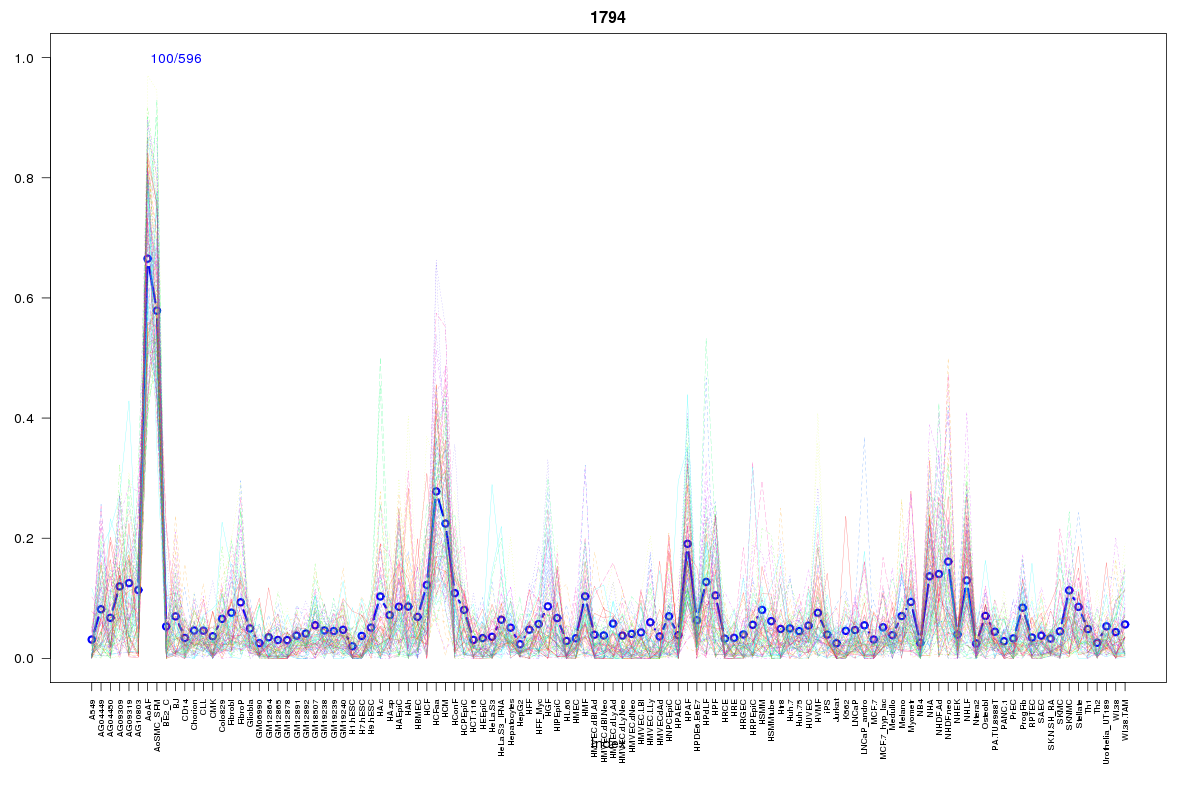 | 1794 | 1 |
 | 2061 | 1 |
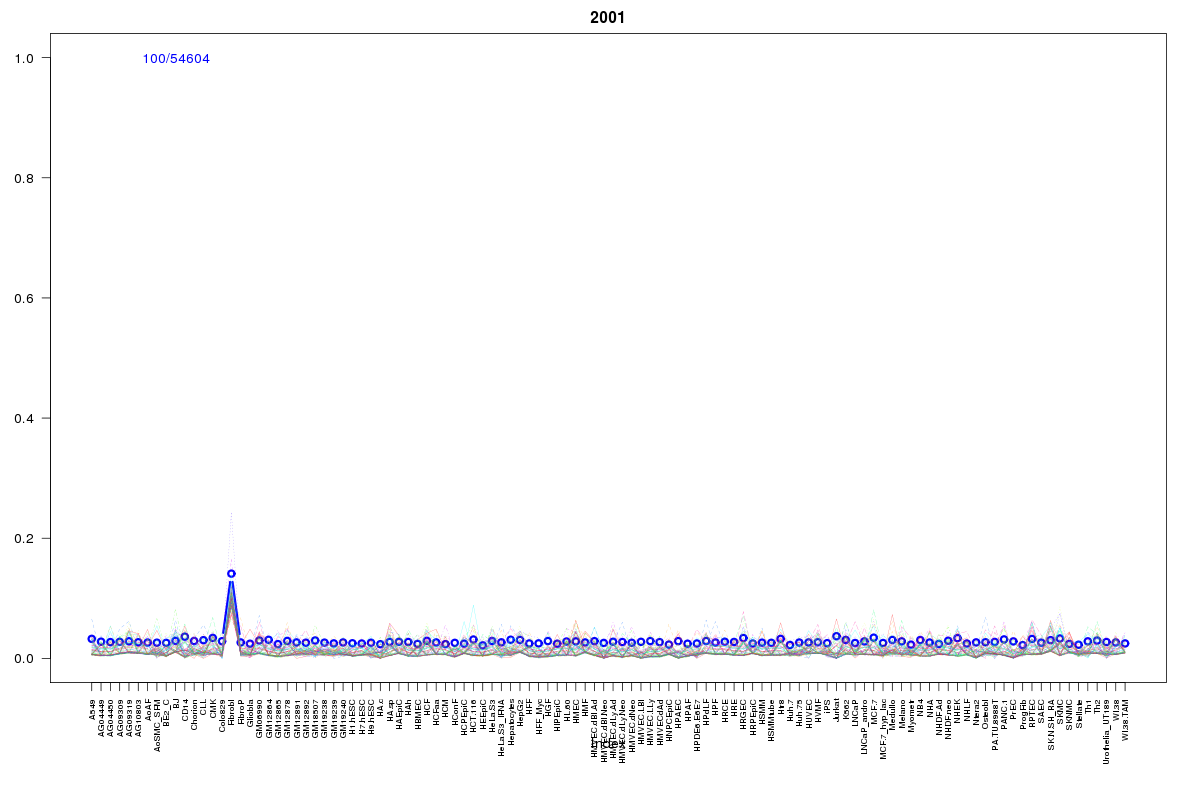 | 2001 | 1 |
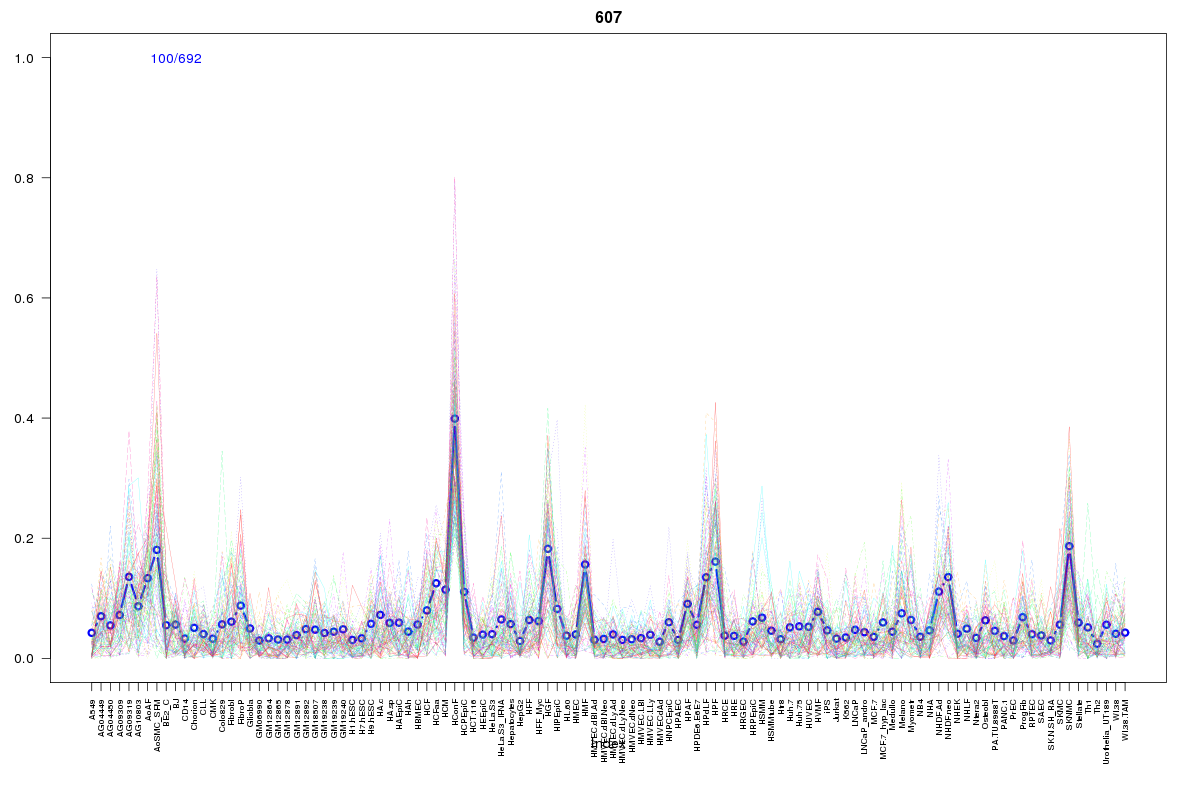 | 607 | 1 |
 | 416 | 1 |
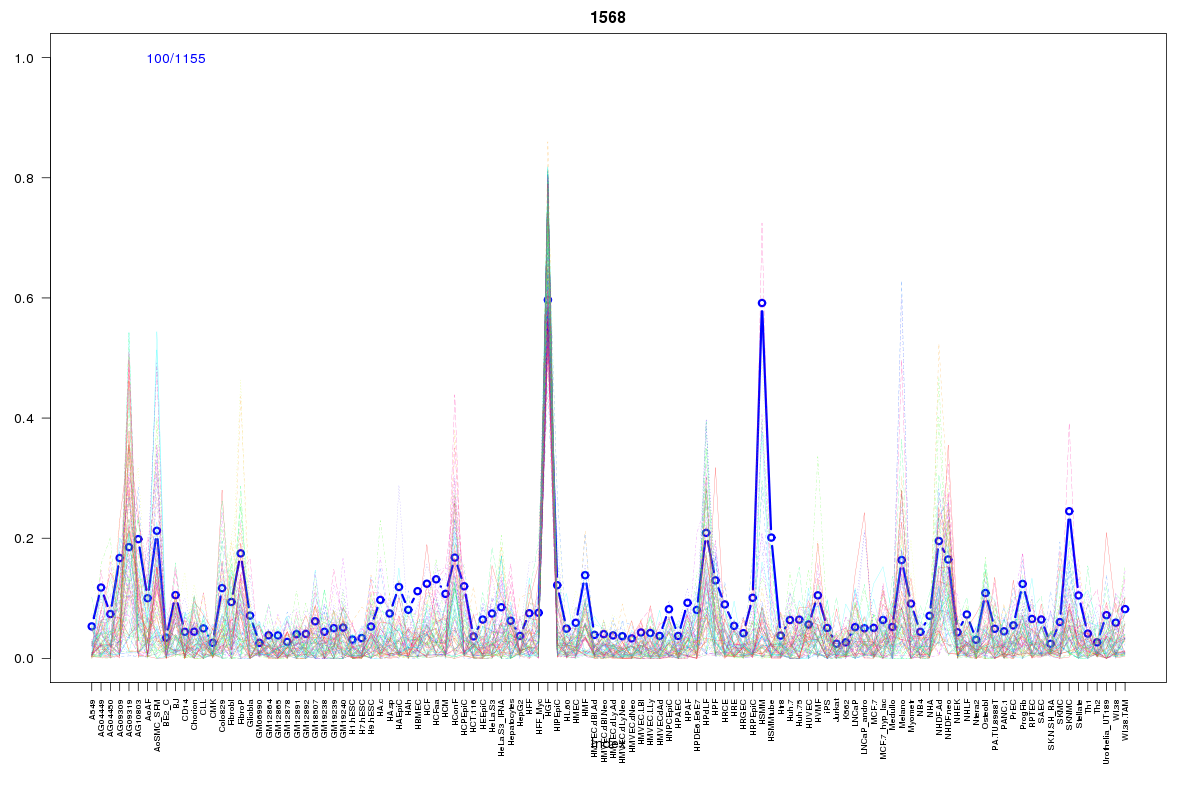 | 1568 | 1 |
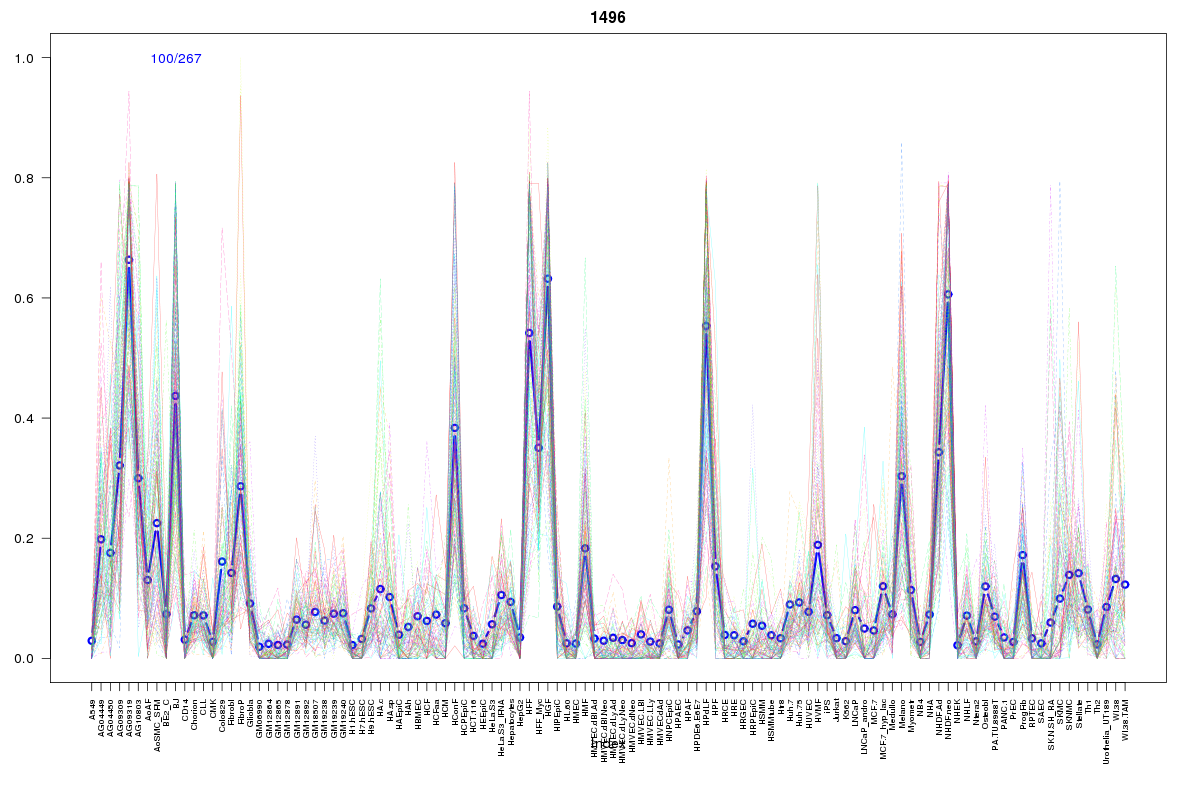 | 1496 | 1 |
Resources
BED file downloads
Connects to 25 DHS sitesTop 10 Correlated DHS Sites
p-values indiciate significant higher or lower correlation| Location | Cluster | P-value |
|---|---|---|
| chr4:100245000-100245150 | 1493 | 0.008 |
| chr4:100311320-100311470 | 1595 | 0.01 |
| chr4:100242520-100242670 | 607 | 0.01 |
| chr4:100222740-100222890 | 1795 | 0.013 |
| chr4:100304300-100304450 | 1953 | 0.013 |
| chr4:100222540-100222690 | 1795 | 0.013 |
| chr4:100246320-100246470 | 1442 | 0.013 |
| chr4:100126860-100127010 | 1493 | 0.014 |
| chr4:100245640-100245790 | 1845 | 0.015 |
| chr4:100304080-100304230 | 1845 | 0.015 |
| chr4:100123000-100123150 | 1562 | 0.015 |
External Databases
UCSCEnsembl (ENSG00000187758)