Gene: LCE2A
chr1: 152670839-152671918Expression Profile
(log scale)
Graphical Connections
Distribution of linked clusters:
You may find it interesting if many of the connected DHS sites belong to the same cluster.| Cluster Profile | Cluster ID | Number of DHS sites in this cluster |
|---|---|---|
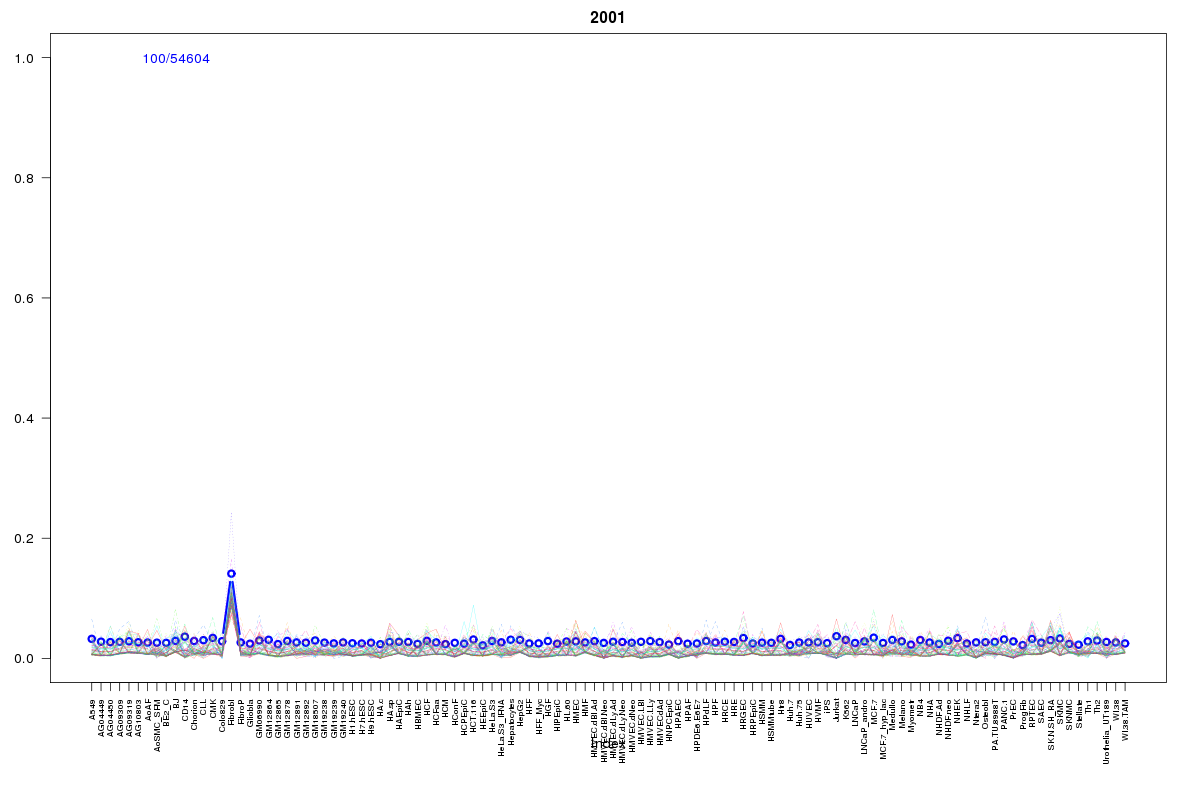 | 2001 | 3 |
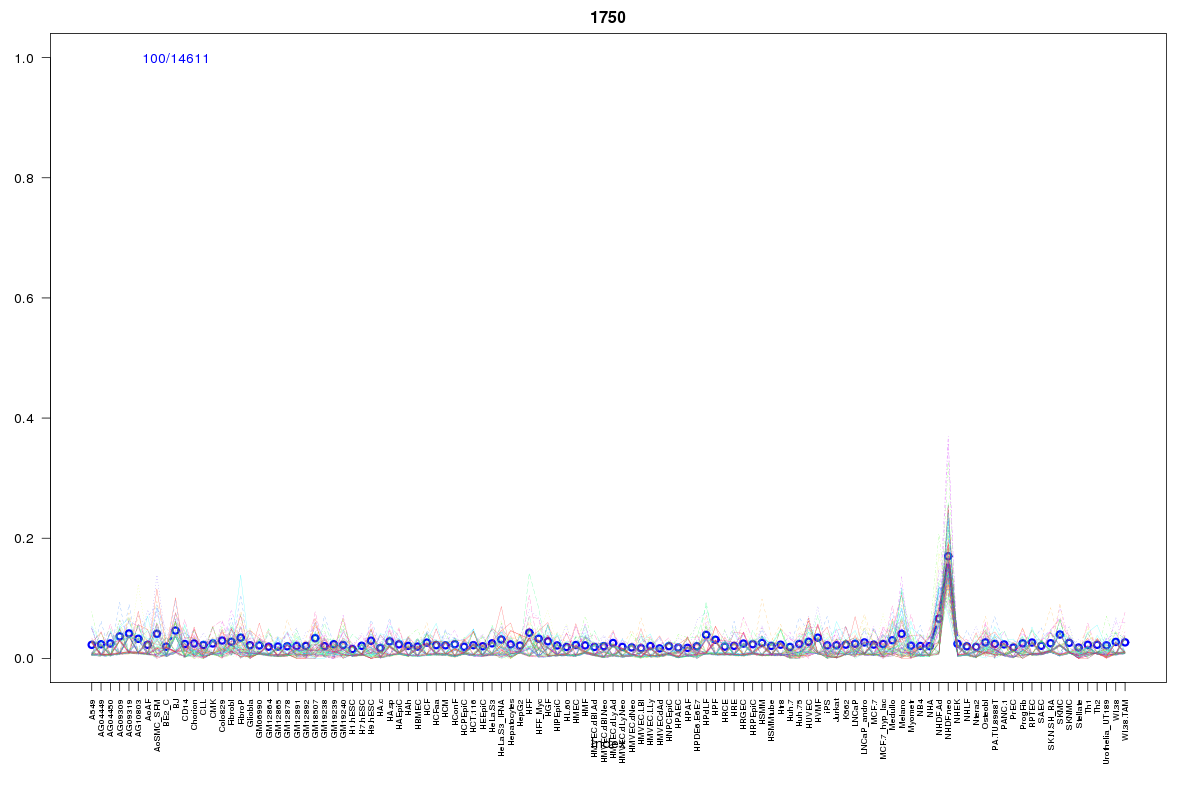 | 1750 | 2 |
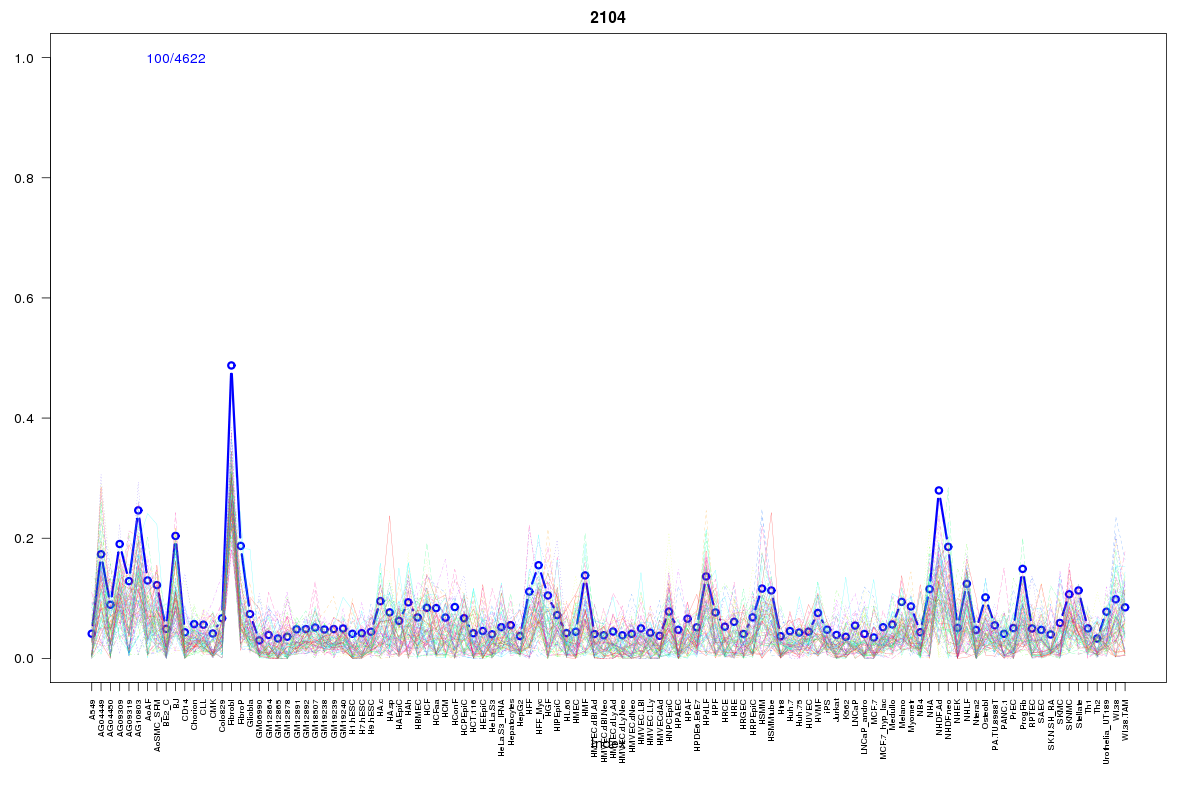 | 2104 | 1 |
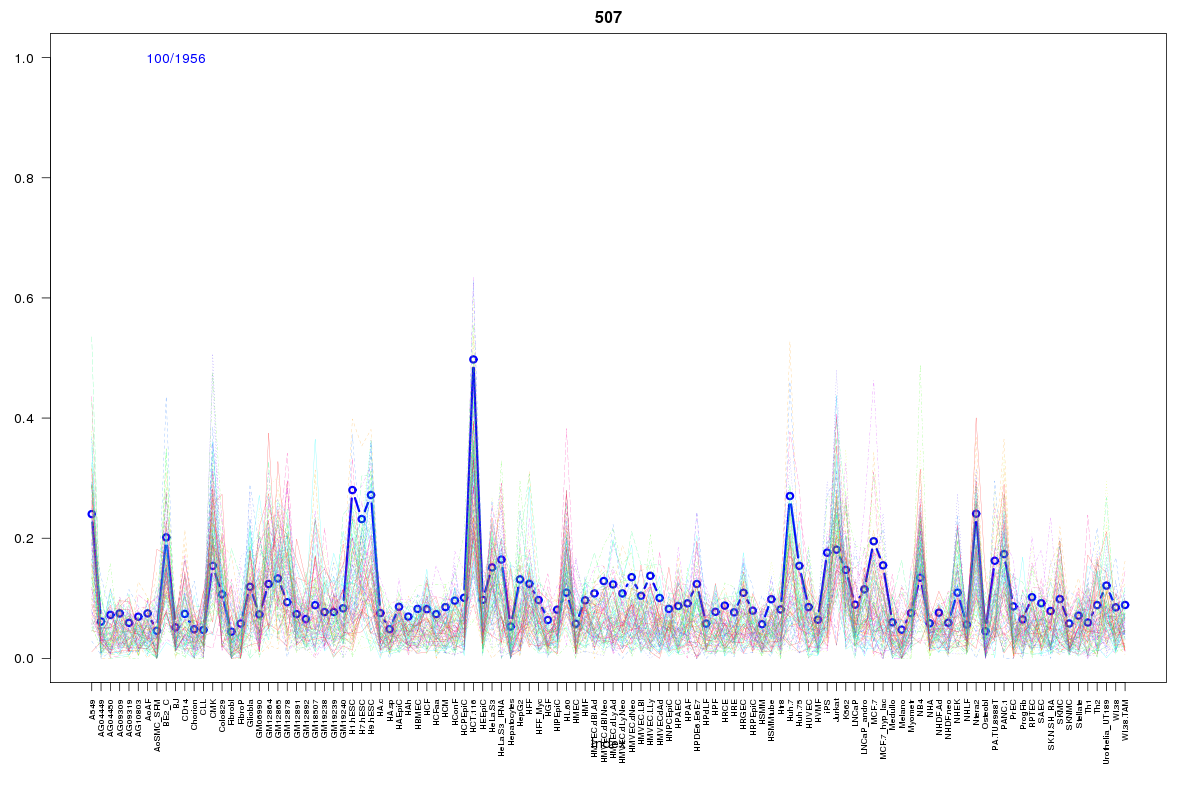 | 507 | 1 |
 | 860 | 1 |
 | 2122 | 1 |
 | 555 | 1 |
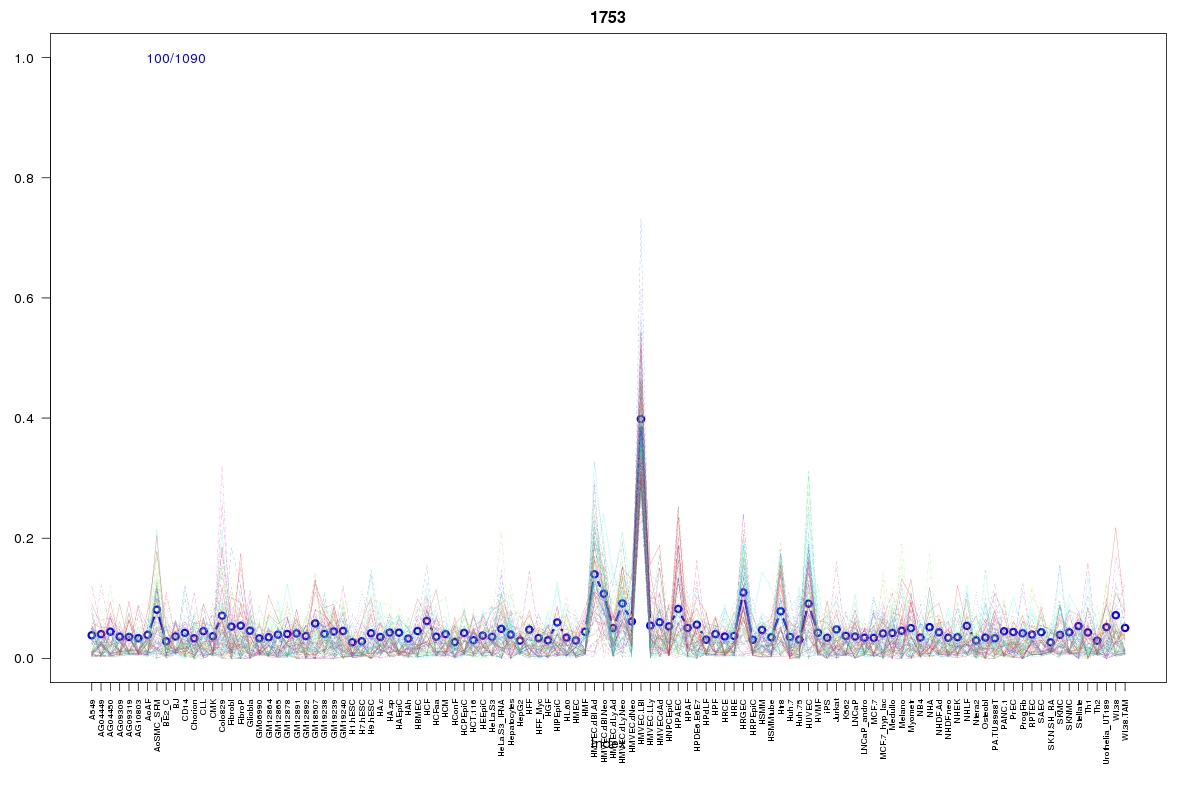 | 1753 | 1 |
Resources
BED file downloads
Connects to 11 DHS sitesTop 10 Correlated DHS Sites
p-values indiciate significant higher or lower correlation| Location | Cluster | P-value |
|---|---|---|
| chr1:152736960-152737110 | 1750 | 0 |
| chr1:152633660-152633810 | 1750 | 0.005 |
| chr1:152672325-152672475 | 2104 | 0.007 |
| chr1:152726865-152727015 | 2001 | 0.018 |
| chr1:152671885-152672035 | 2001 | 0.022 |
| chr1:152670320-152670470 | 1753 | 0.023 |
| chr1:152694565-152694715 | 2001 | 0.023 |
| chr1:152708225-152708375 | 507 | 0.023 |
| chr1:152626560-152626710 | 555 | 0.016 |
| chr1:152747985-152748135 | 860 | 0.015 |
| chr1:152595780-152595930 | 2122 | 0.007 |
External Databases
UCSCEnsembl (ENSG00000187173)