Gene: TCAIM
chr3: 44379610-44449282Expression Profile
(log scale)
Graphical Connections
Distribution of linked clusters:
You may find it interesting if many of the connected DHS sites belong to the same cluster.| Cluster Profile | Cluster ID | Number of DHS sites in this cluster |
|---|---|---|
 | 862 | 2 |
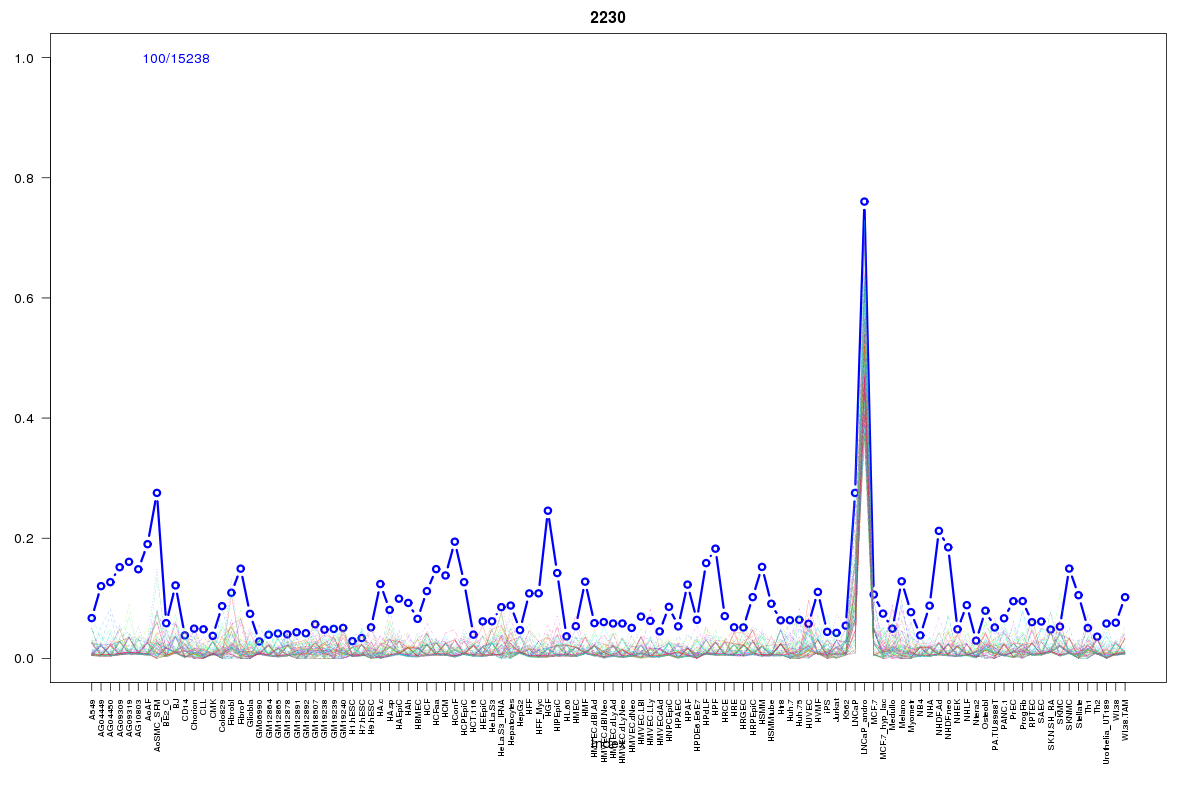 | 2230 | 2 |
 | 1079 | 1 |
 | 568 | 1 |
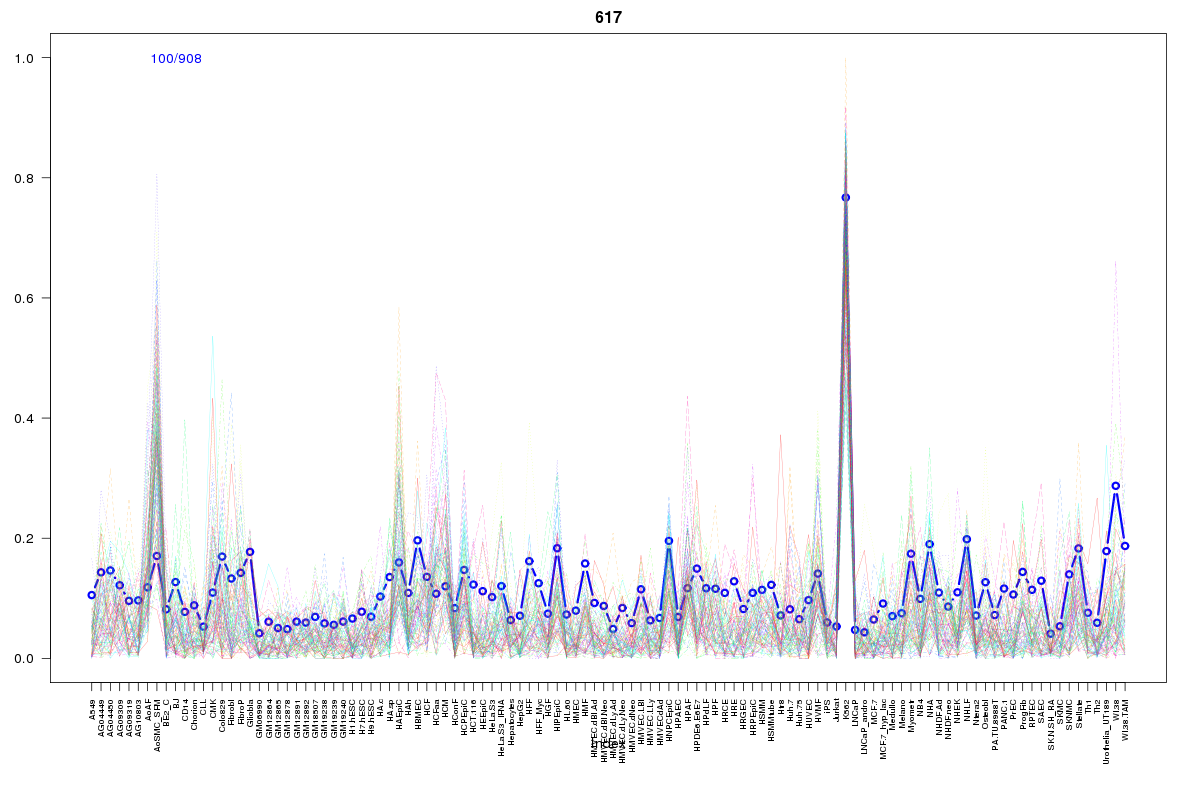 | 617 | 1 |
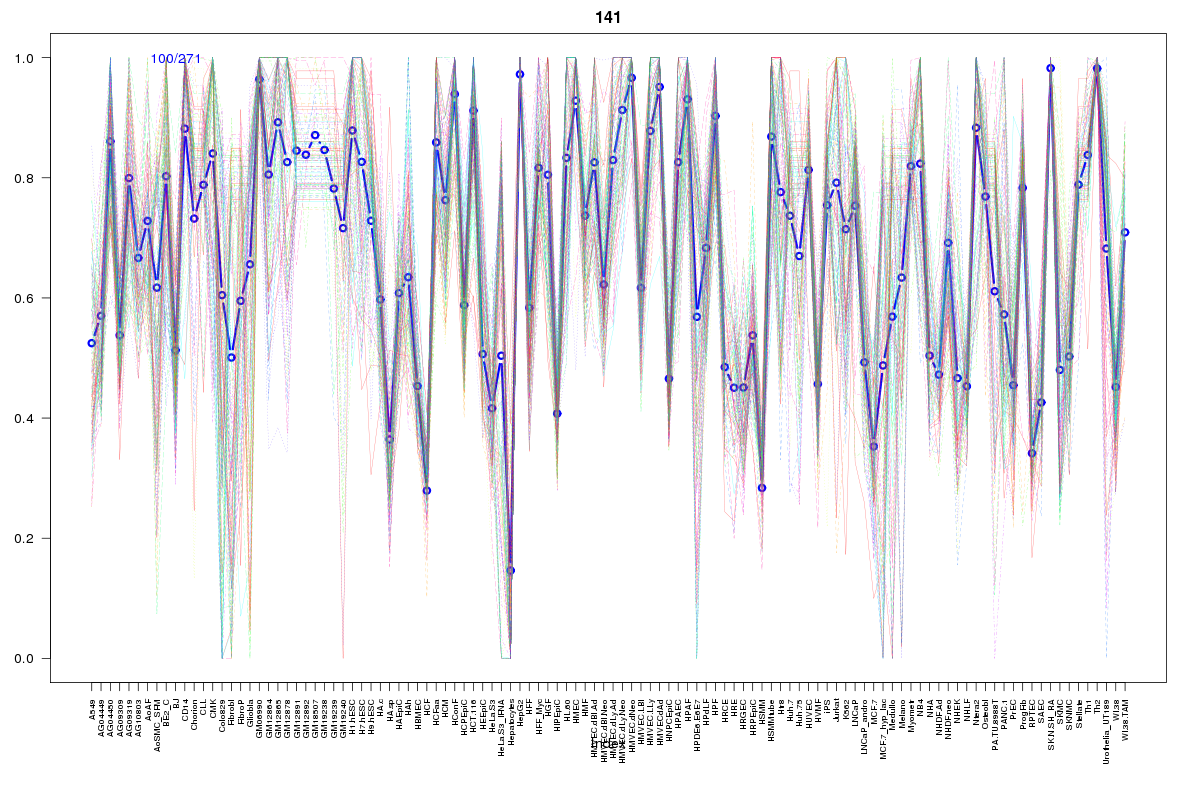 | 141 | 1 |
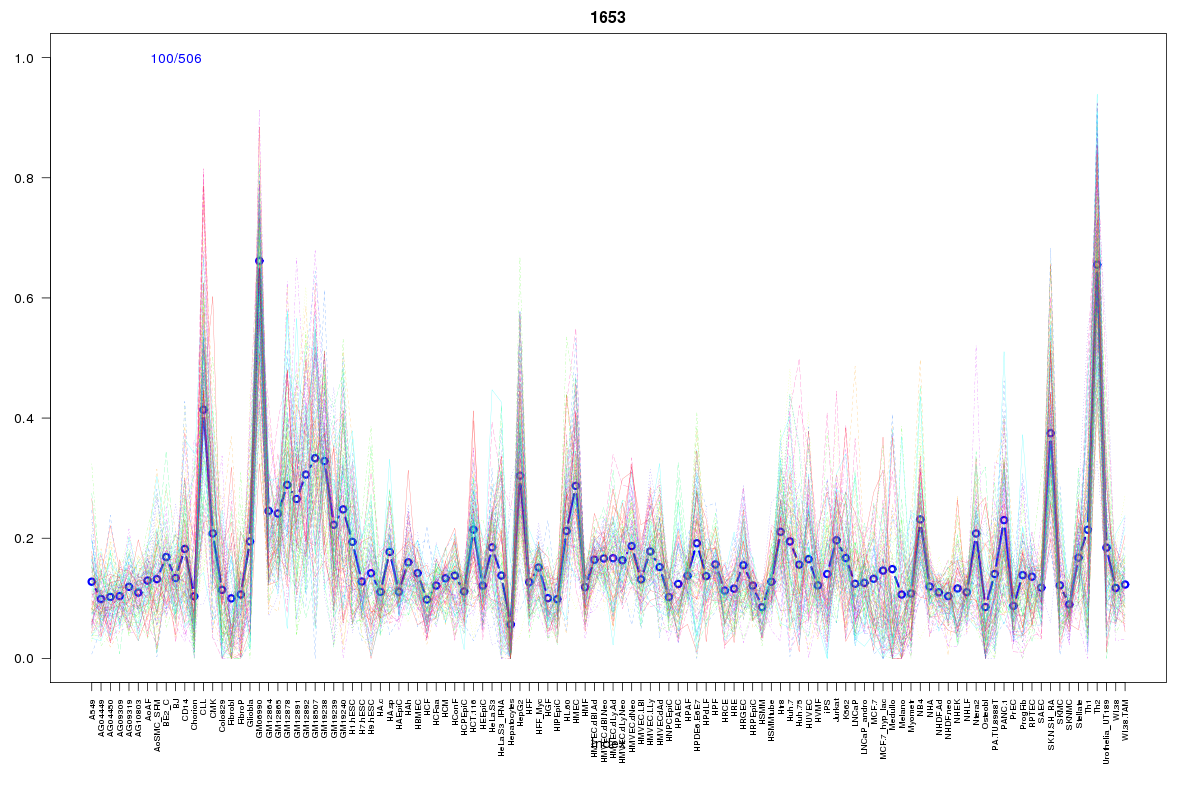 | 1653 | 1 |
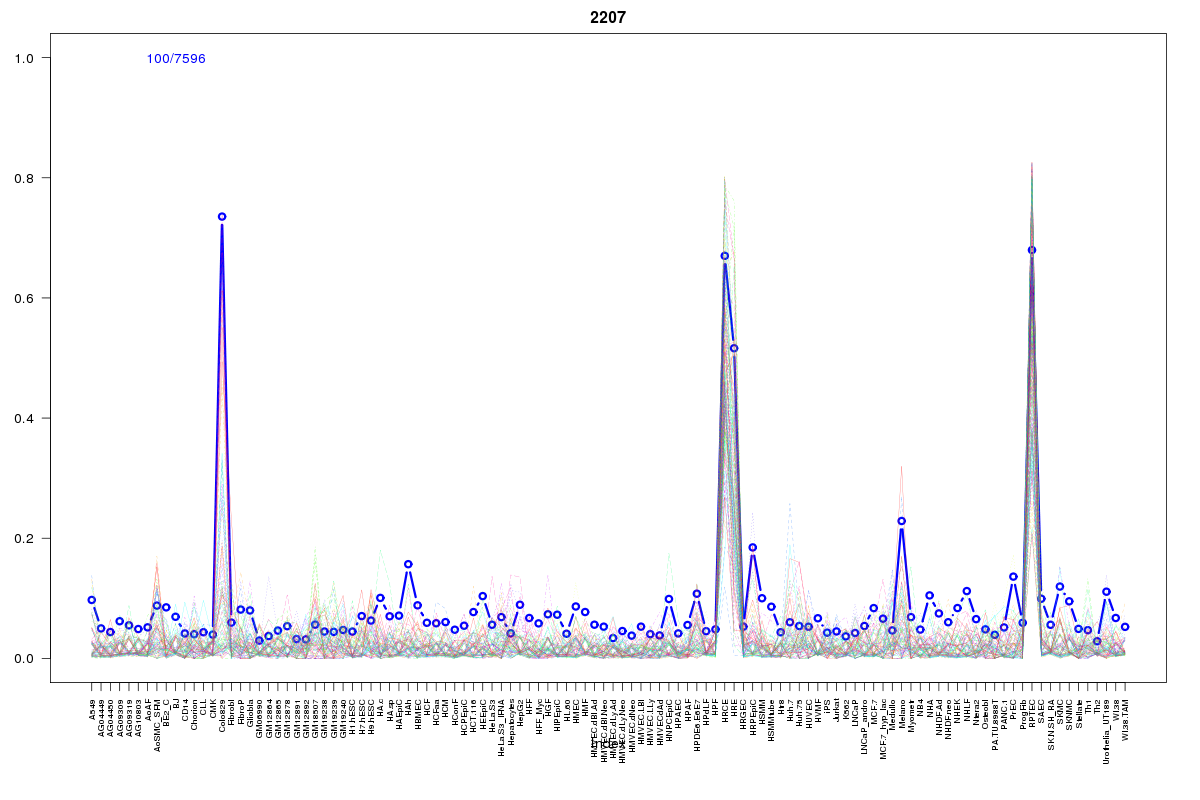 | 2207 | 1 |
 | 2110 | 1 |
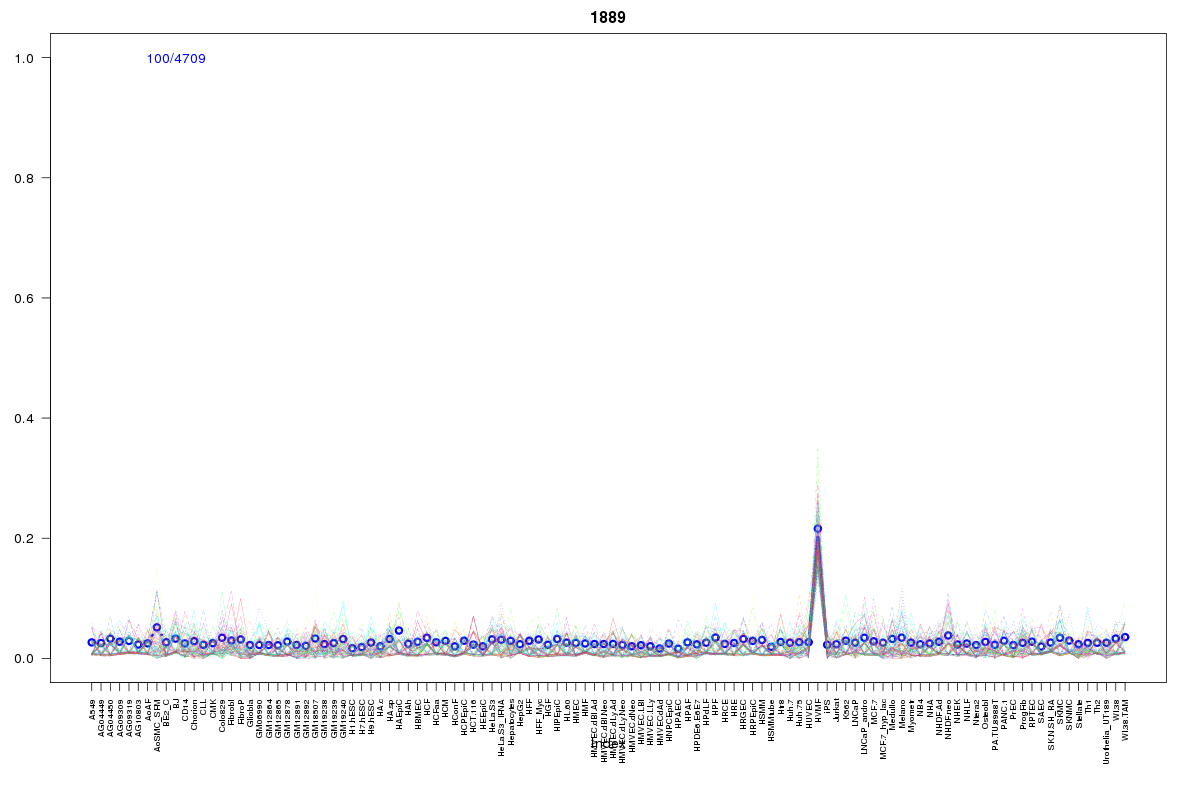 | 1889 | 1 |
 | 106 | 1 |
Resources
BED file downloads
Connects to 13 DHS sitesTop 10 Correlated DHS Sites
p-values indiciate significant higher or lower correlation| Location | Cluster | P-value |
|---|---|---|
| chr3:44370080-44370230 | 2110 | 0.002 |
| chr3:44284380-44284530 | 862 | 0.004 |
| chr3:44284225-44284375 | 862 | 0.008 |
| chr3:44467300-44467450 | 2230 | 0.012 |
| chr3:44351140-44351290 | 2207 | 0.014 |
| chr3:44510180-44510330 | 617 | 0.015 |
| chr3:44438160-44438310 | 2230 | 0.015 |
| chr3:44399080-44399230 | 1889 | 0.019 |
| chr3:44400800-44400950 | 106 | 0.022 |
| chr3:44462045-44462195 | 1079 | 0.011 |
| chr3:44519300-44519450 | 1653 | 0.008 |
External Databases
UCSCEnsembl (ENSG00000179152)