Gene: GK5
chr3: 141882413-141944409Expression Profile
(log scale)
Graphical Connections
Distribution of linked clusters:
You may find it interesting if many of the connected DHS sites belong to the same cluster.| Cluster Profile | Cluster ID | Number of DHS sites in this cluster |
|---|---|---|
 | 2110 | 4 |
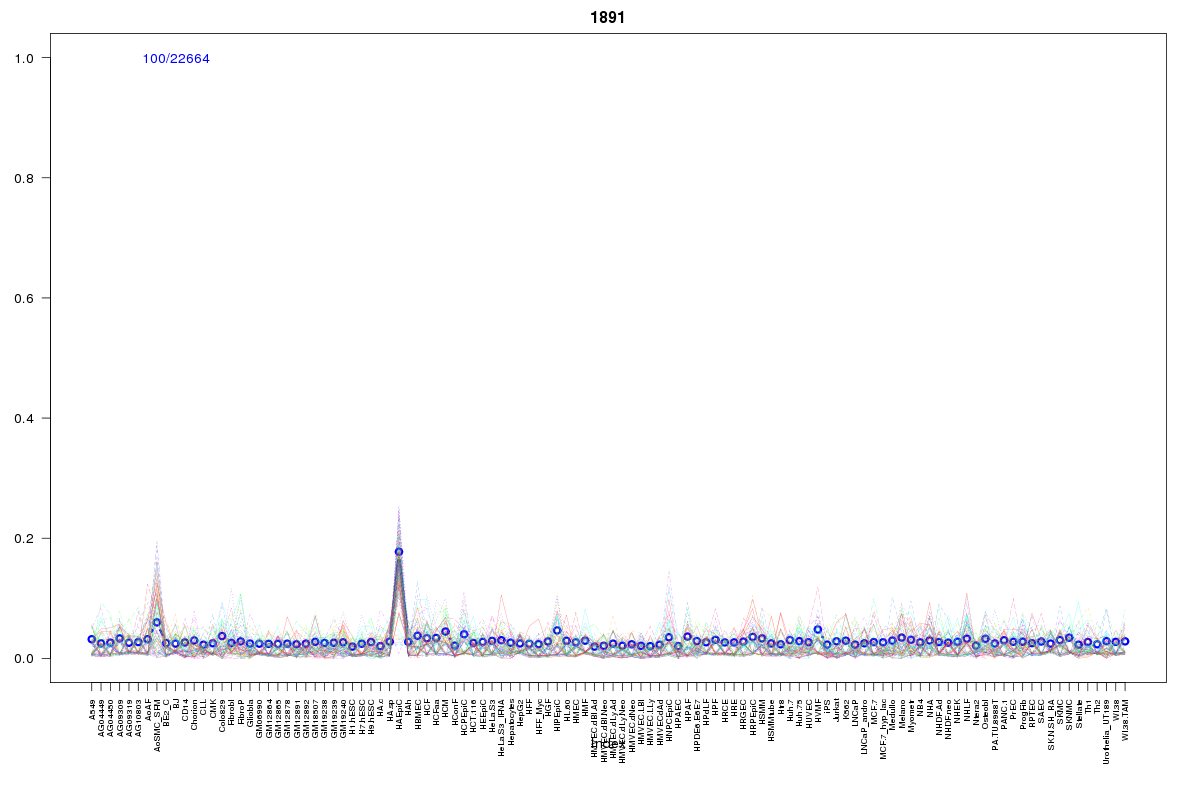 | 1891 | 2 |
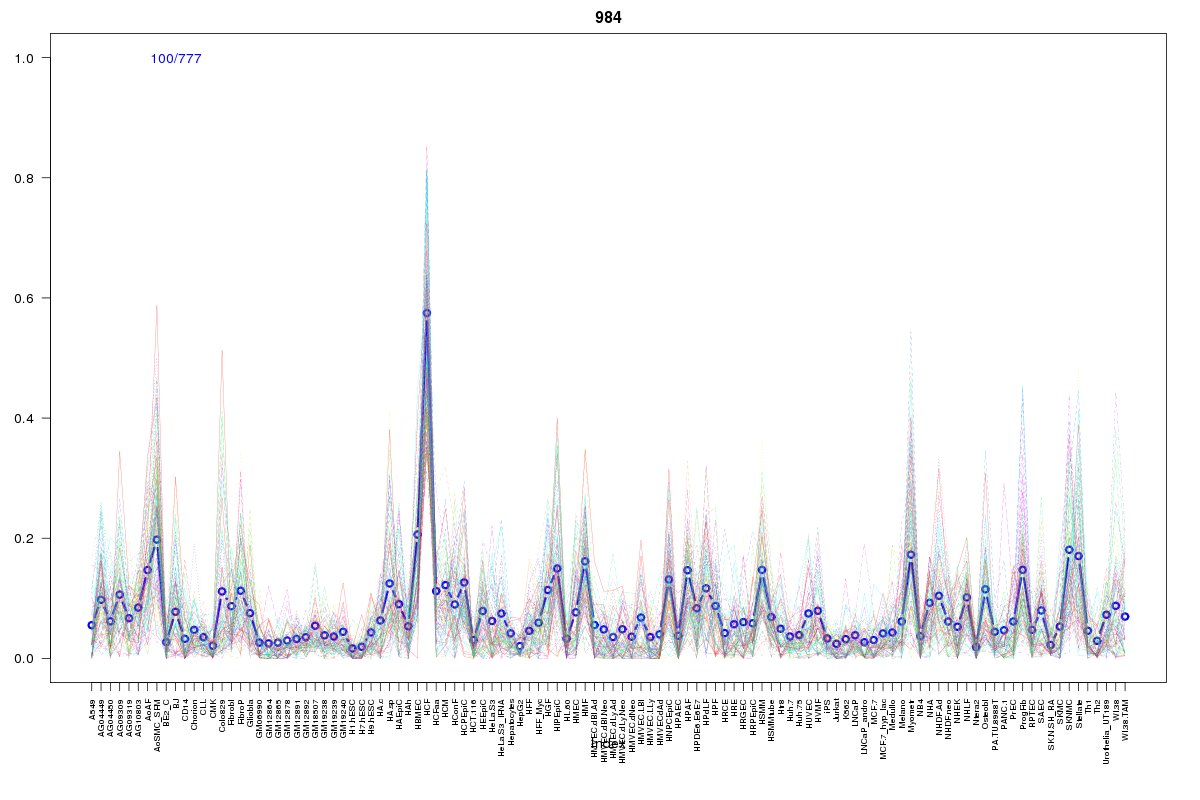 | 984 | 1 |
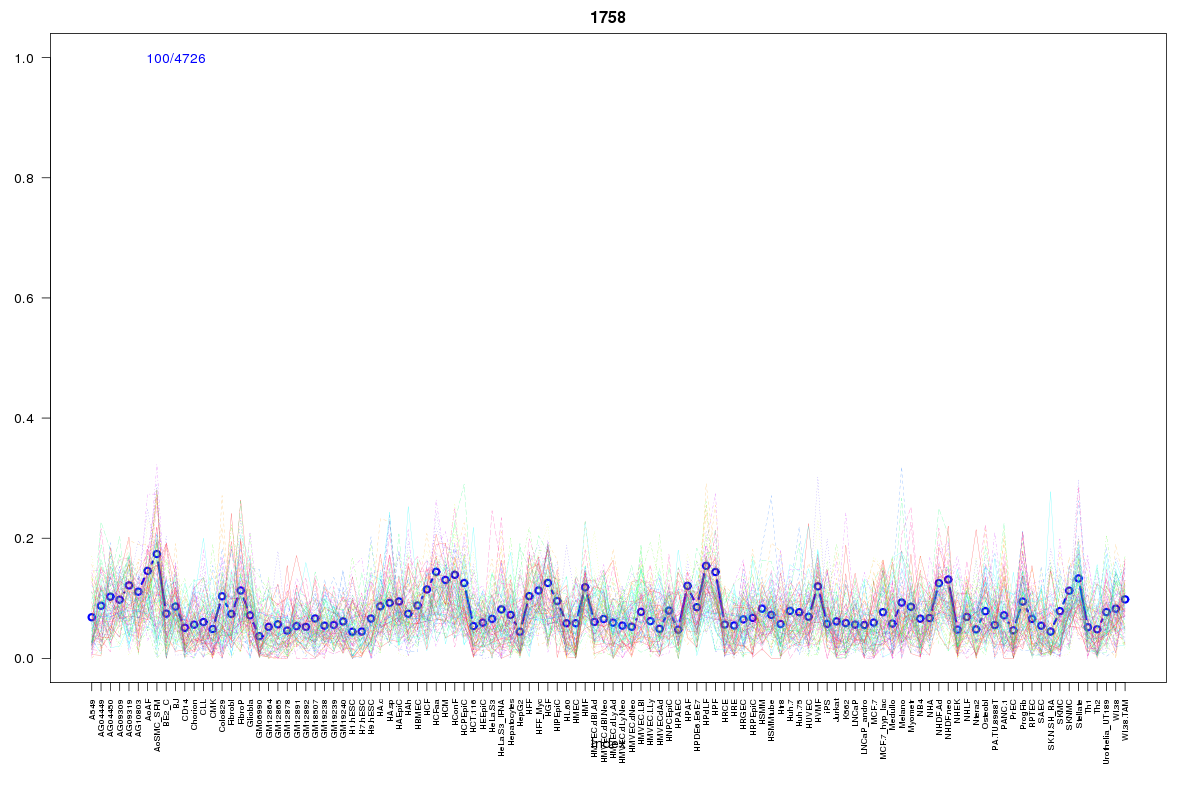 | 1758 | 1 |
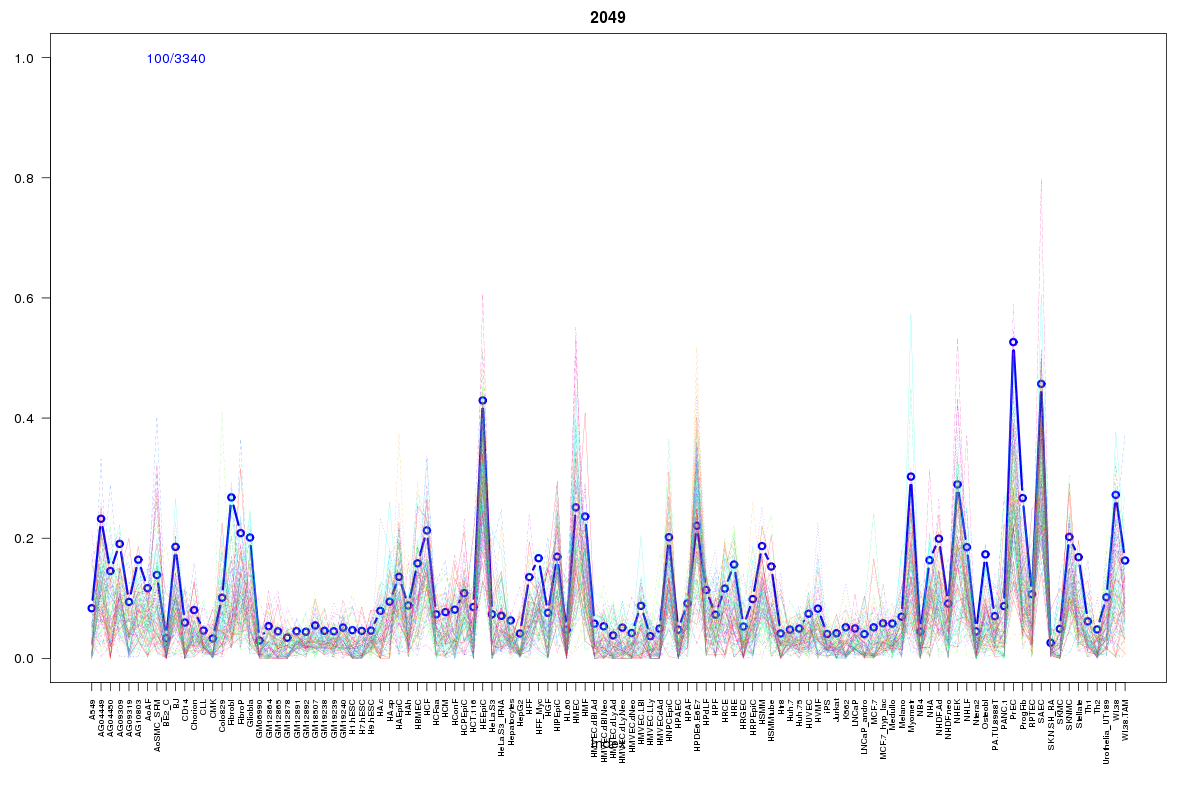 | 2049 | 1 |
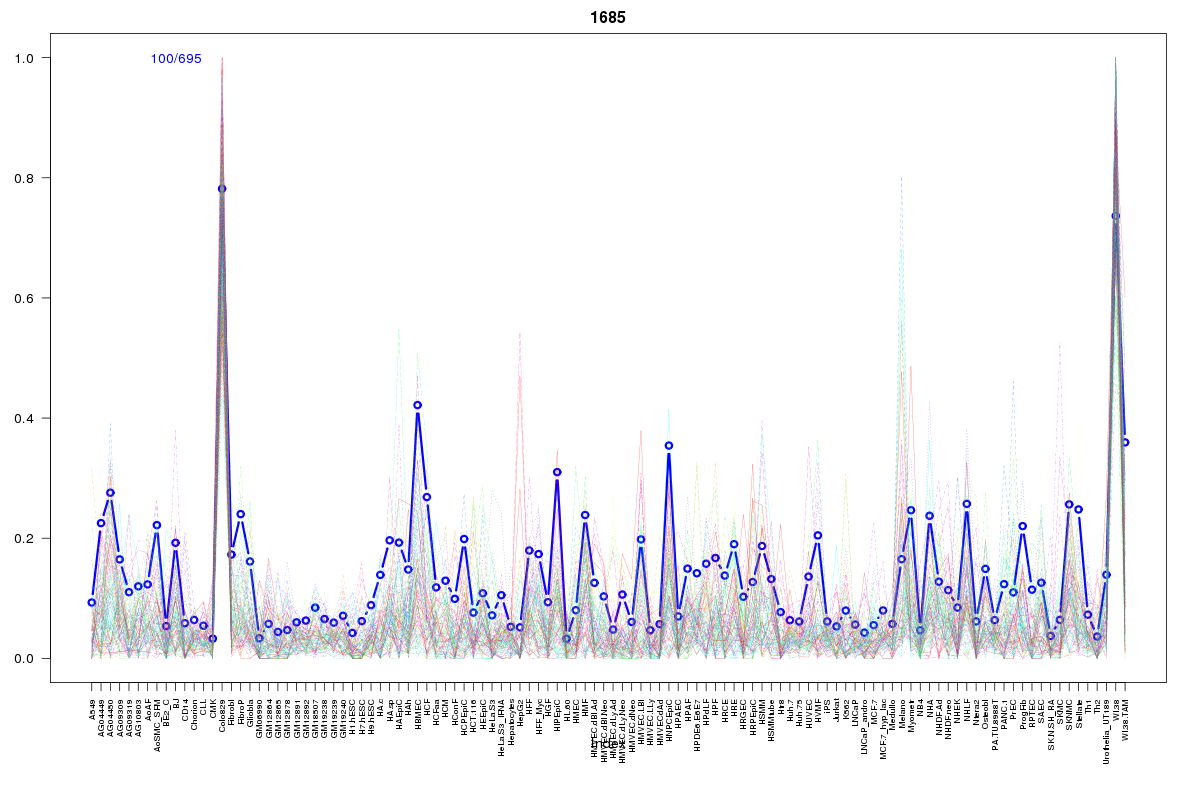 | 1685 | 1 |
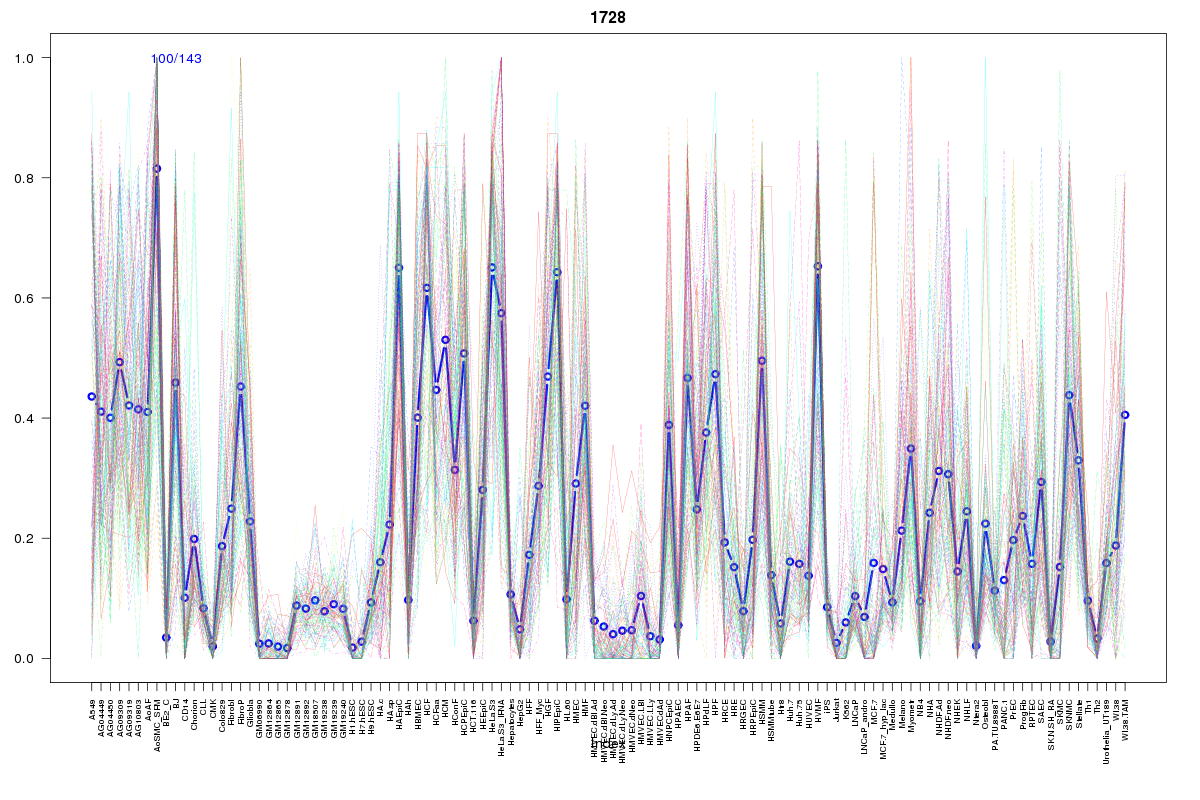 | 1728 | 1 |
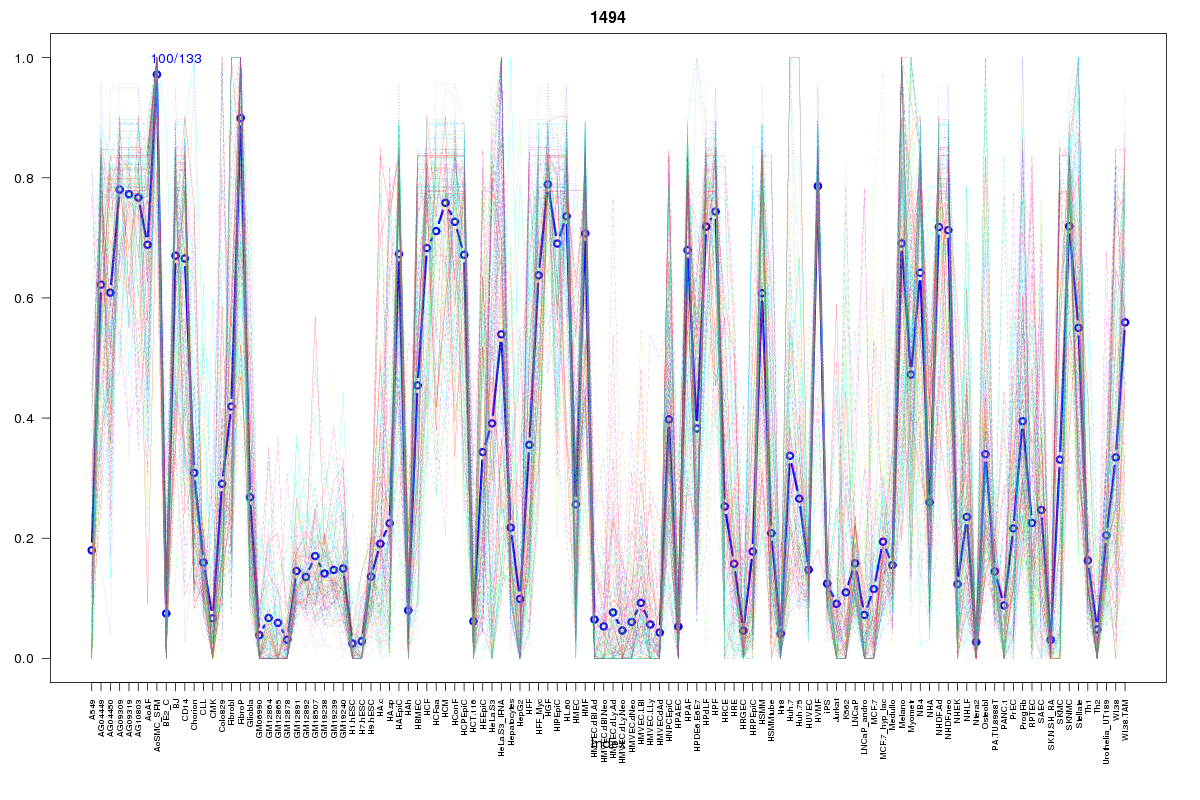 | 1494 | 1 |
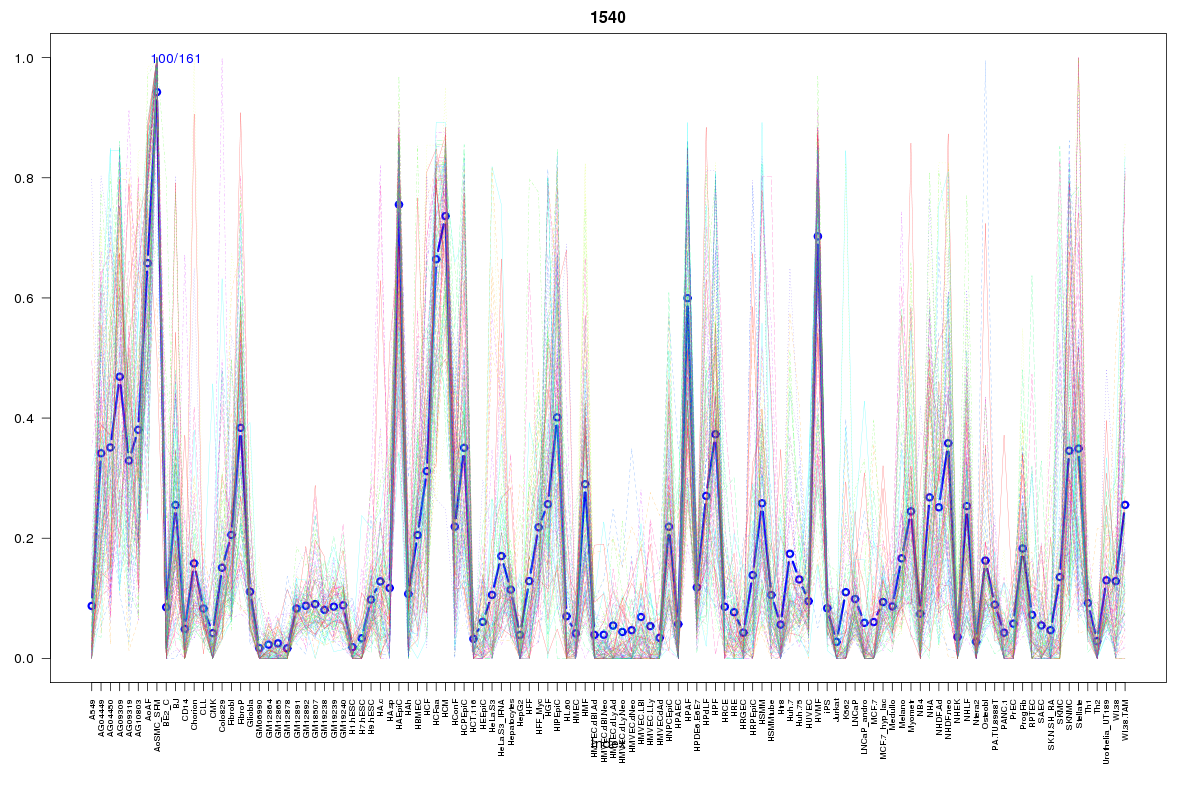 | 1540 | 1 |
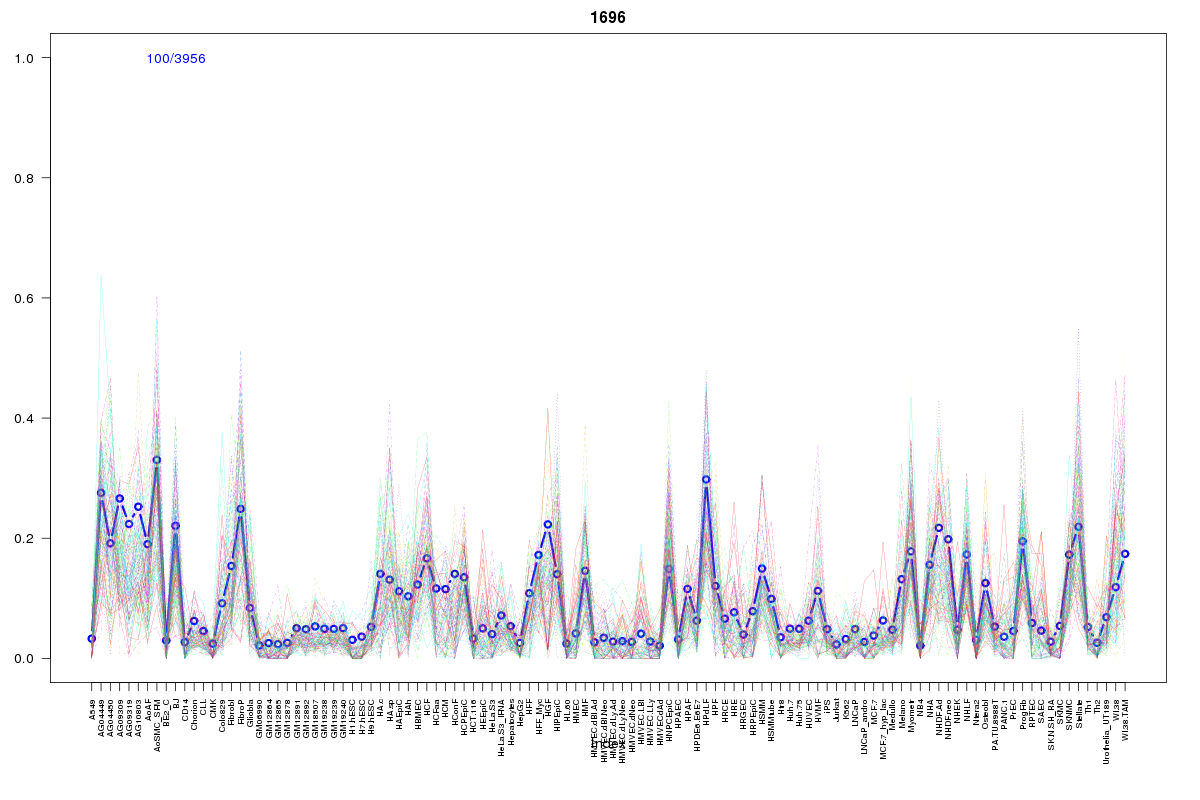 | 1696 | 1 |
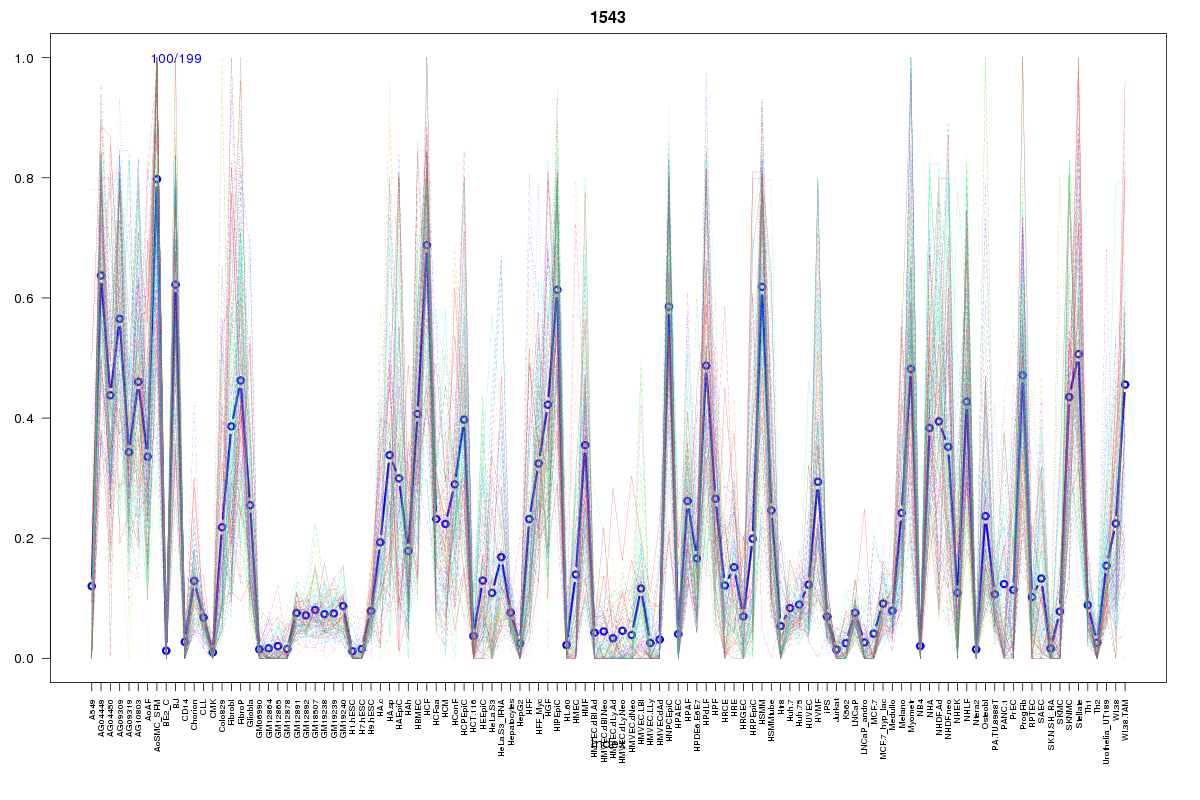 | 1543 | 1 |
 | 934 | 1 |
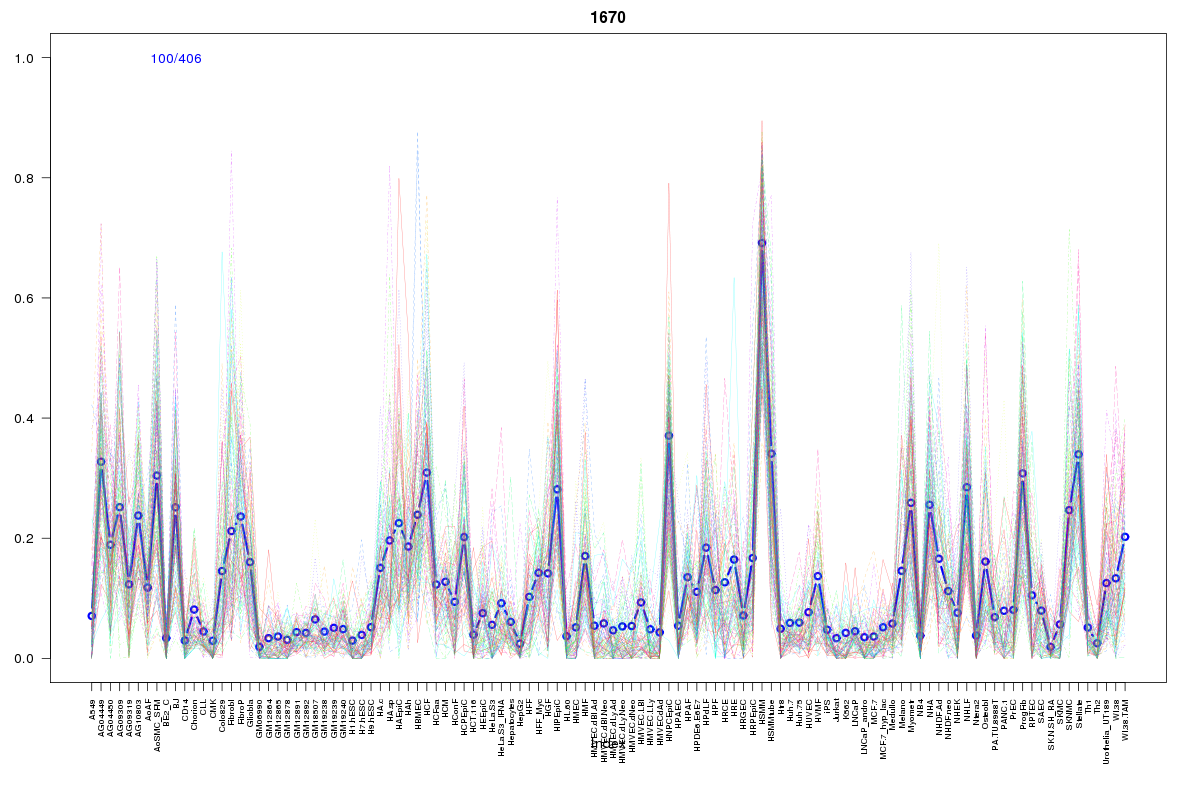 | 1670 | 1 |
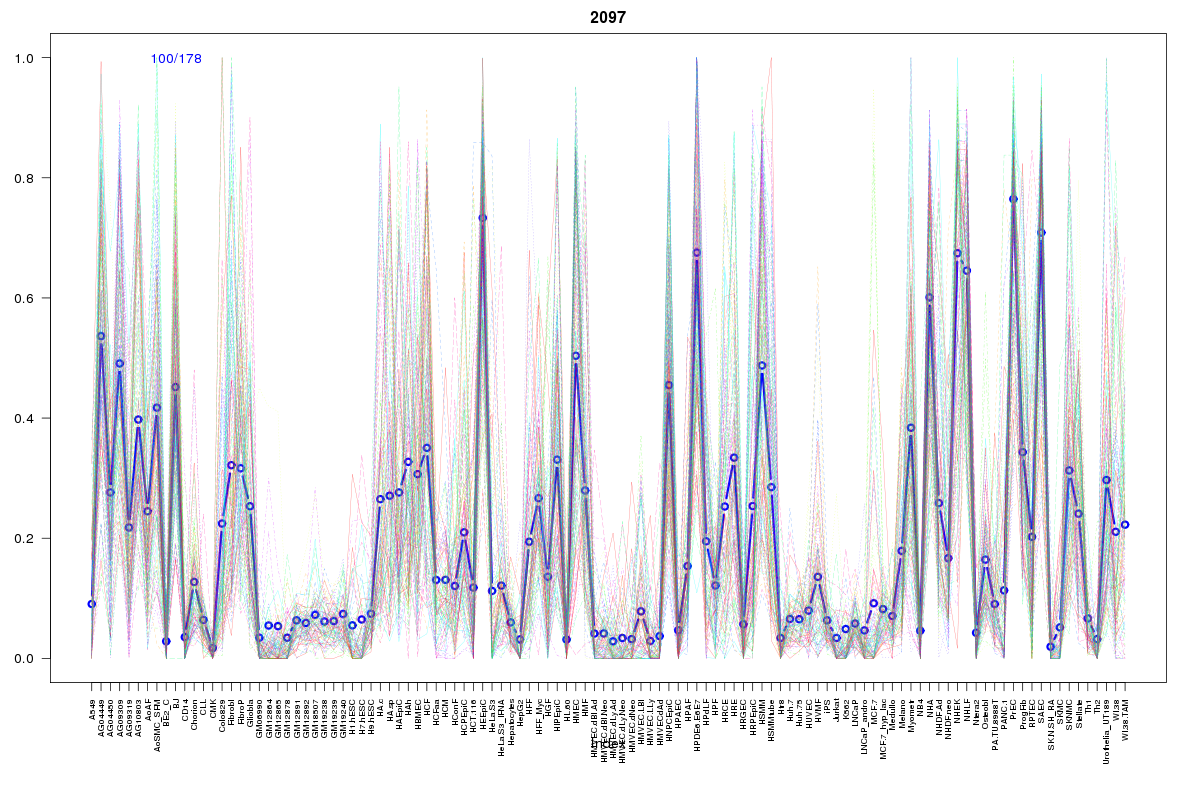 | 2097 | 1 |
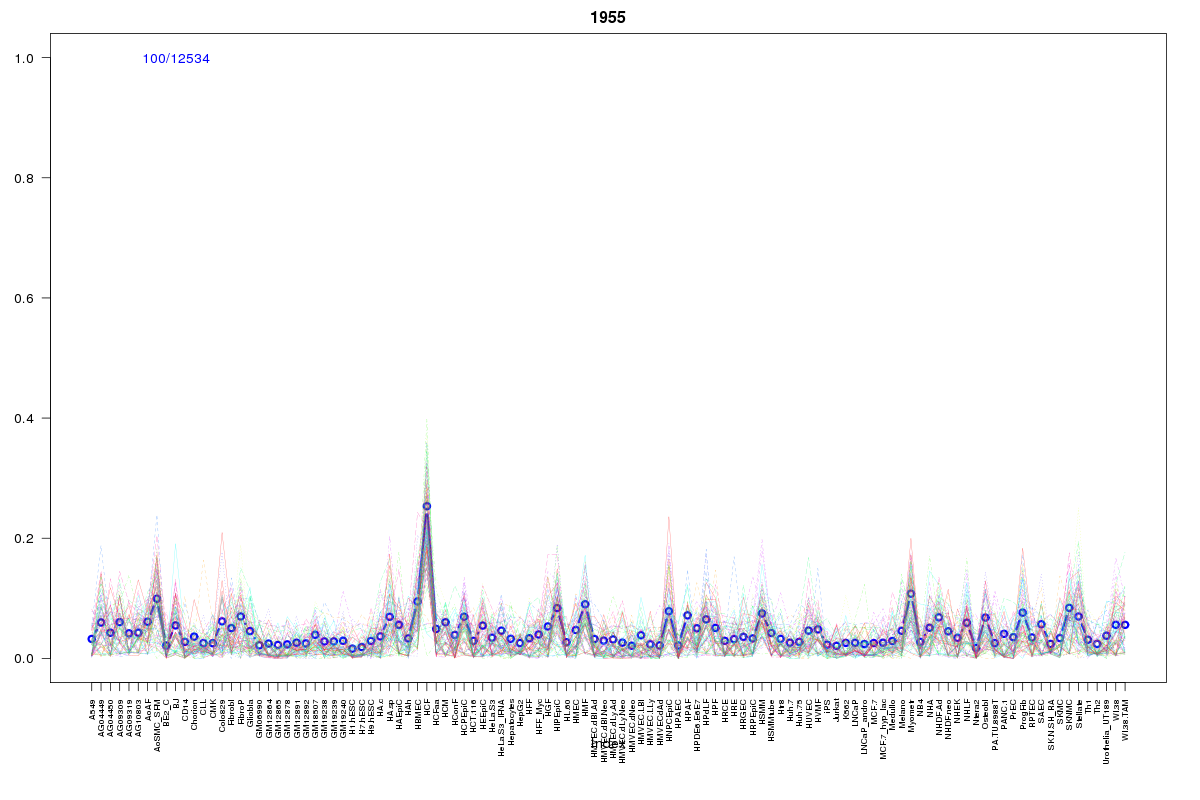 | 1955 | 1 |
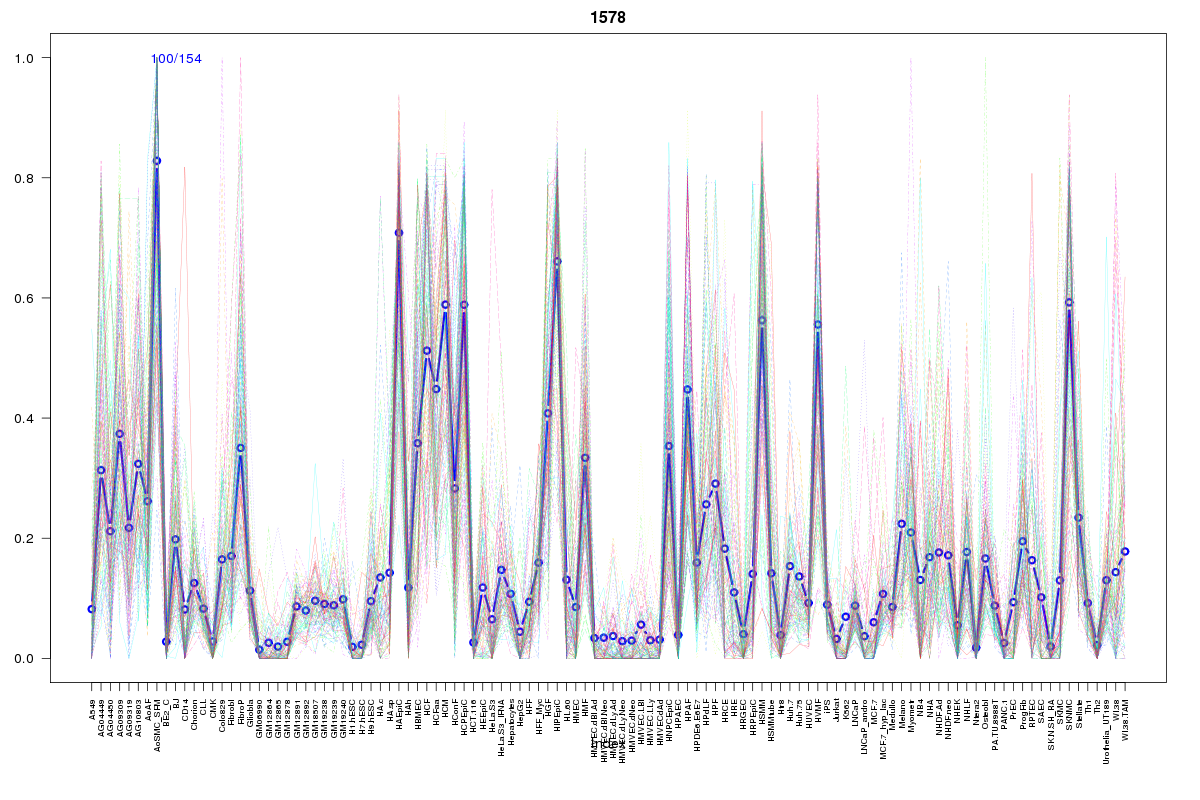 | 1578 | 1 |
 | 1605 | 1 |
Resources
BED file downloads
Connects to 21 DHS sitesTop 10 Correlated DHS Sites
p-values indiciate significant higher or lower correlation| Location | Cluster | P-value |
|---|---|---|
| chr3:141997400-141997550 | 1696 | 0 |
| chr3:142034100-142034250 | 1543 | 0.001 |
| chr3:141994840-141994990 | 1494 | 0.001 |
| chr3:141956860-141957010 | 2049 | 0.001 |
| chr3:142038060-142038210 | 1670 | 0.001 |
| chr3:141937660-141937810 | 984 | 0.001 |
| chr3:141932280-141932430 | 1578 | 0.001 |
| chr3:141884325-141884475 | 1955 | 0.001 |
| chr3:141991400-141991550 | 1685 | 0.004 |
| chr3:141994685-141994835 | 1728 | 0.008 |
| chr3:141995680-141995830 | 1540 | 0.011 |
External Databases
UCSCEnsembl (ENSG00000175066)