Gene: GLIS1
chr1: 53971909-54199877Expression Profile
(log scale)
Graphical Connections
Distribution of linked clusters:
You may find it interesting if many of the connected DHS sites belong to the same cluster.| Cluster Profile | Cluster ID | Number of DHS sites in this cluster |
|---|---|---|
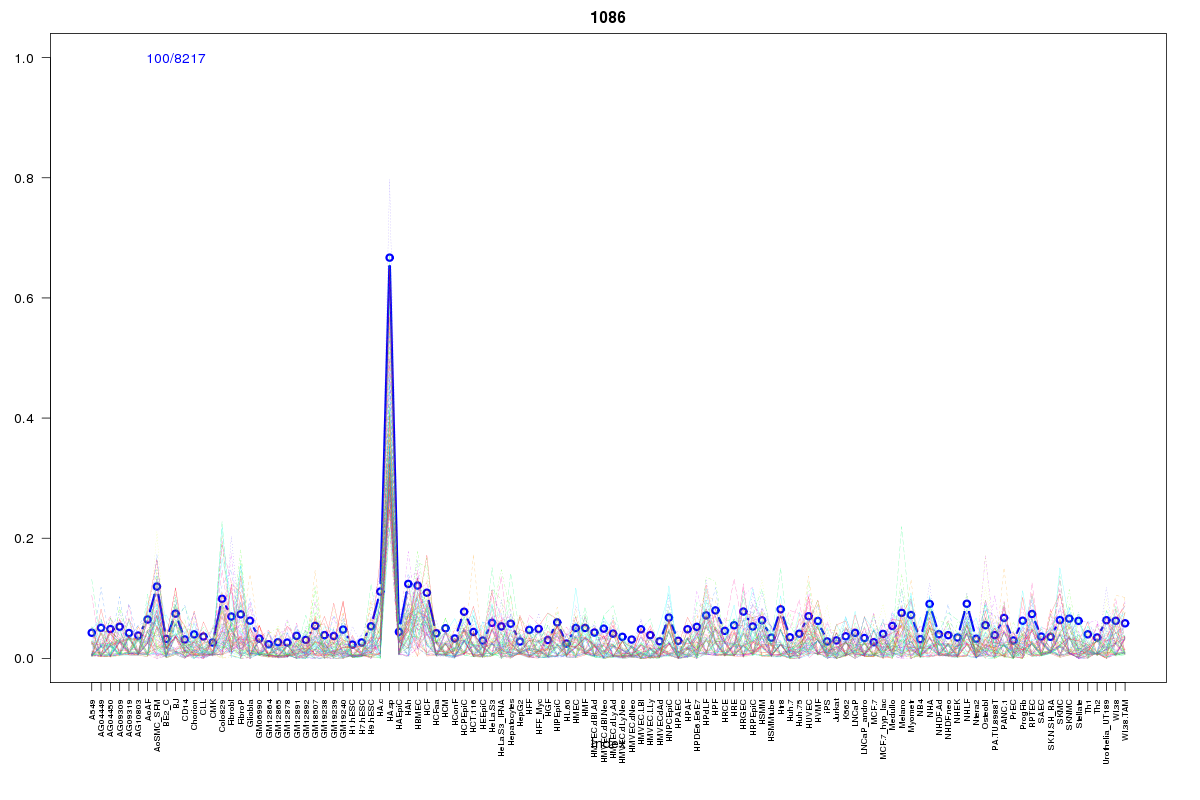 | 1086 | 2 |
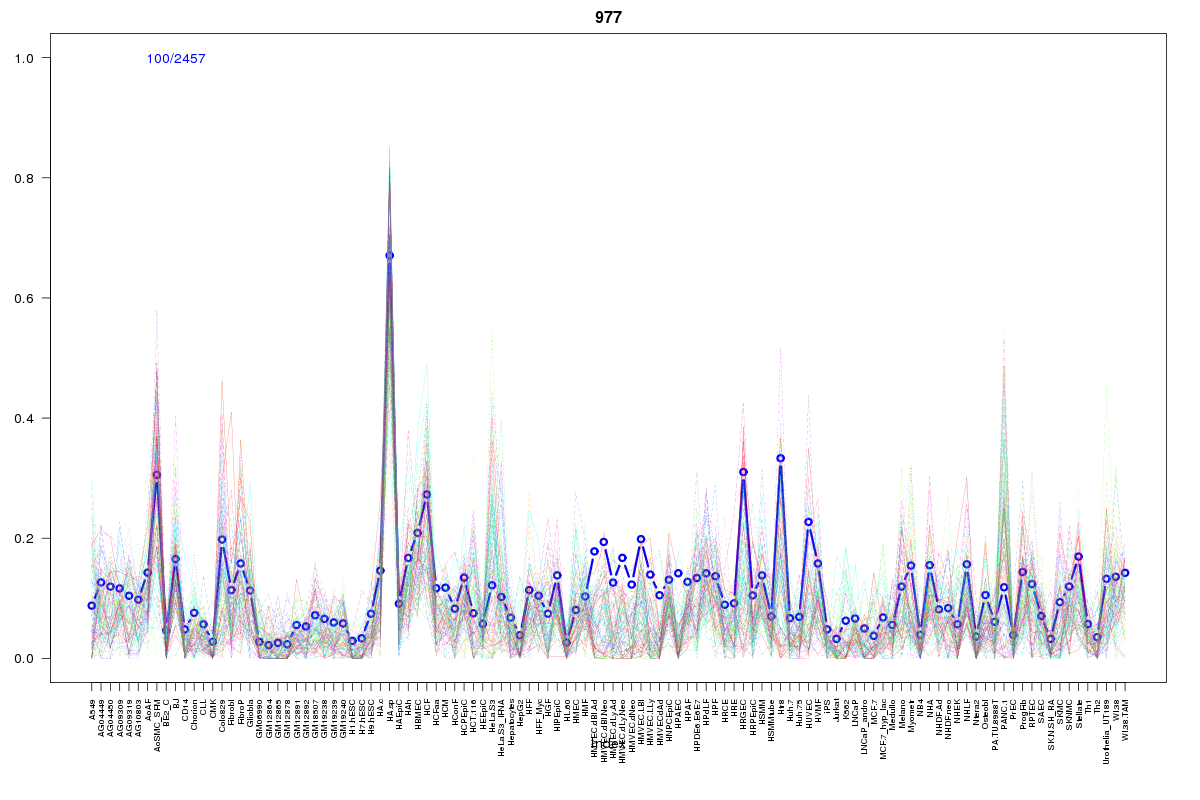 | 977 | 2 |
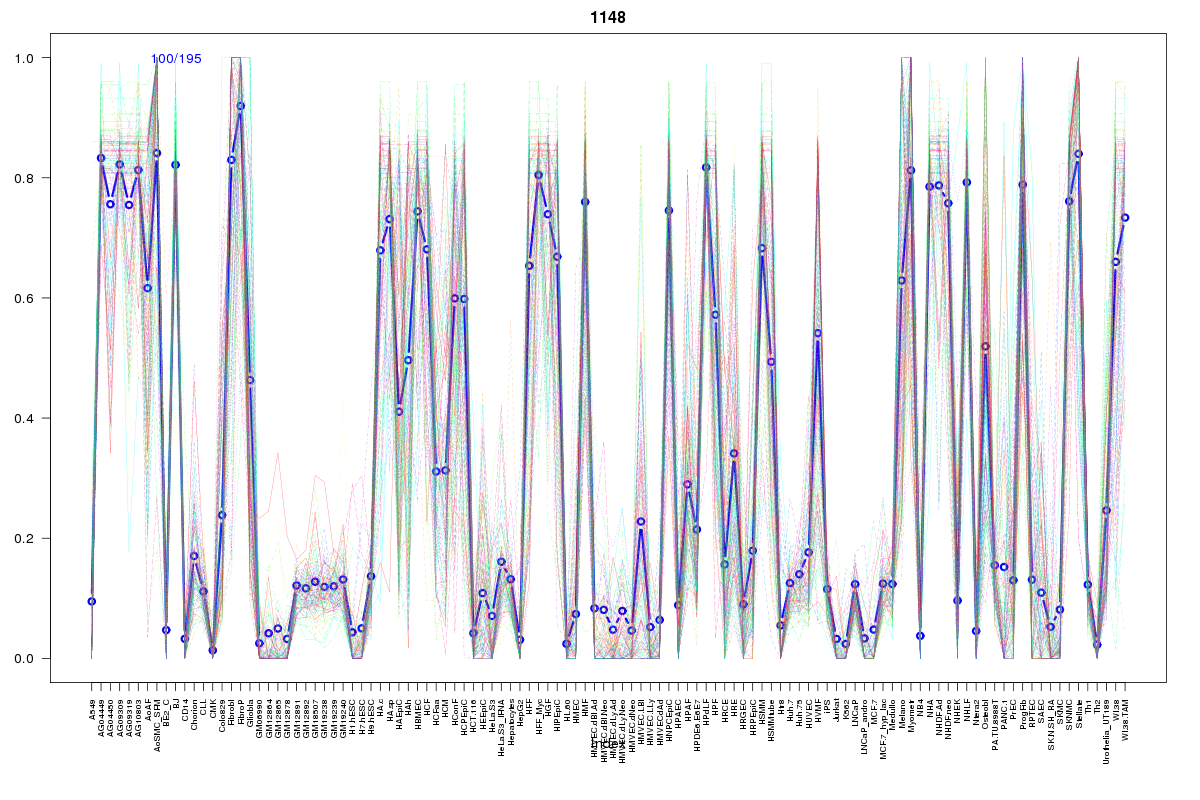 | 1148 | 2 |
 | 2211 | 1 |
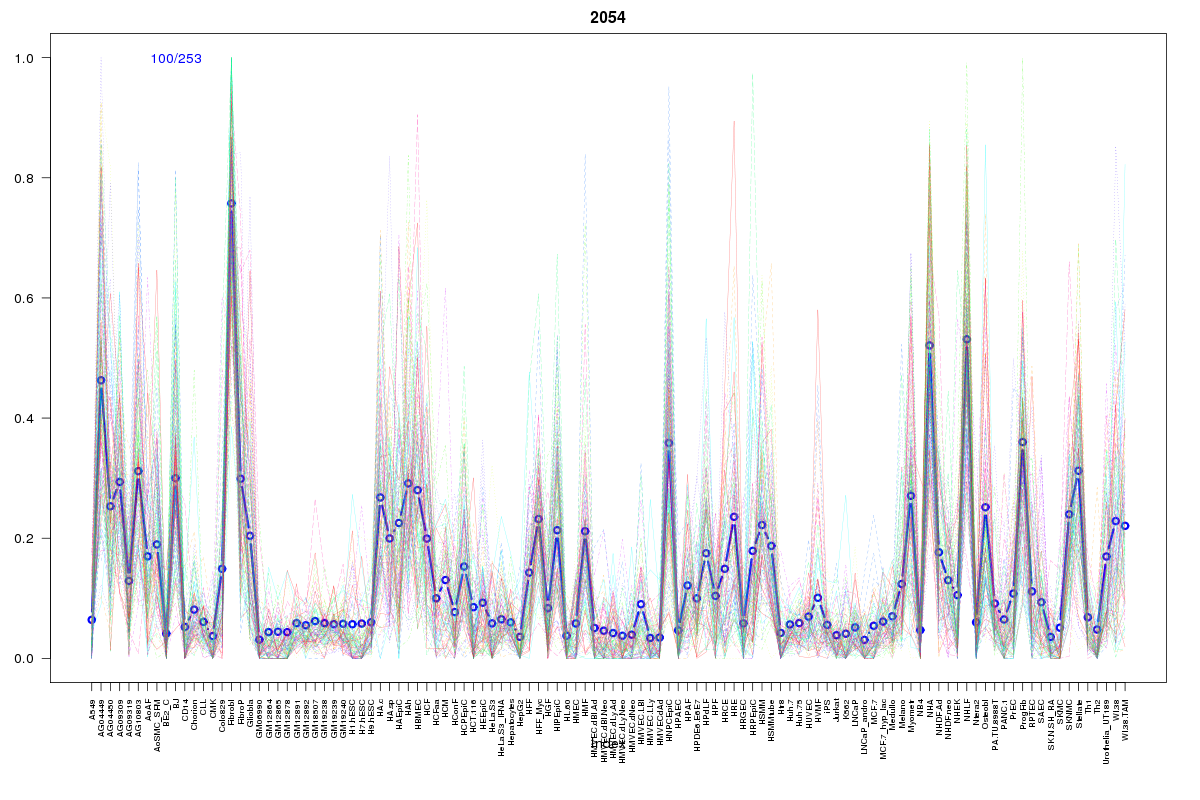 | 2054 | 1 |
 | 1244 | 1 |
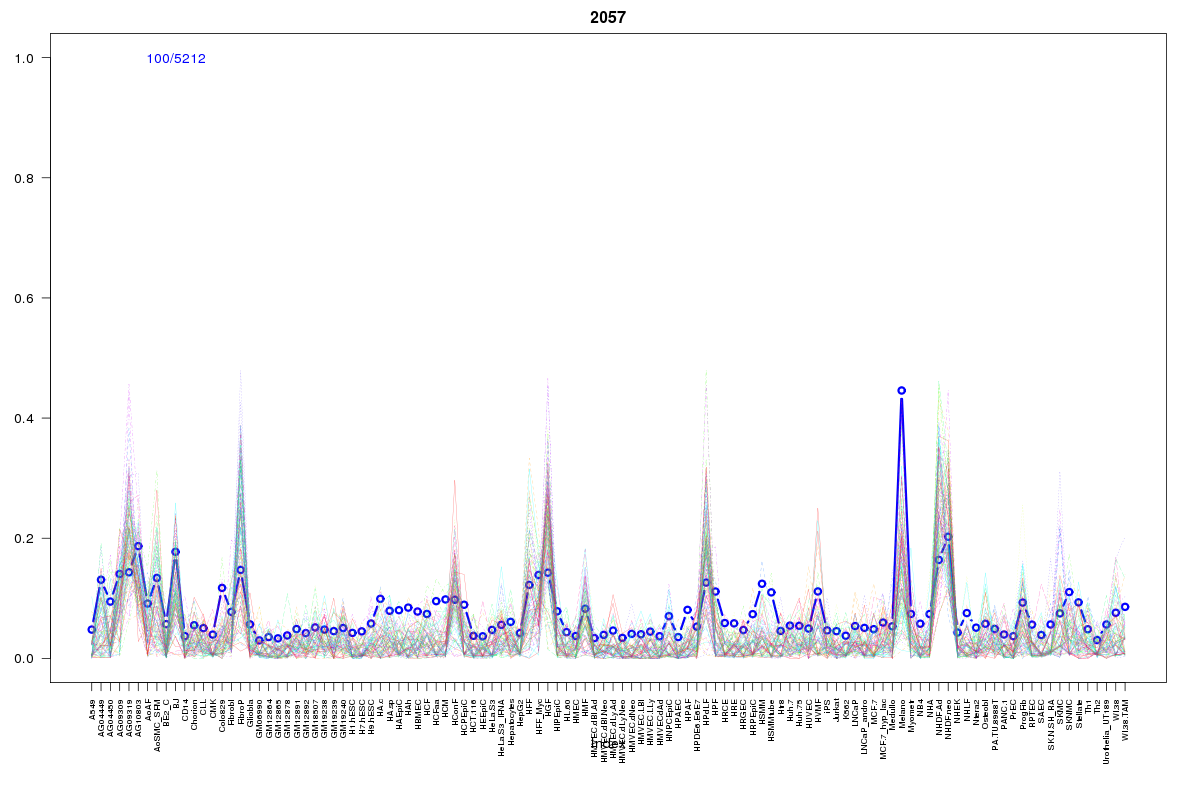 | 2057 | 1 |
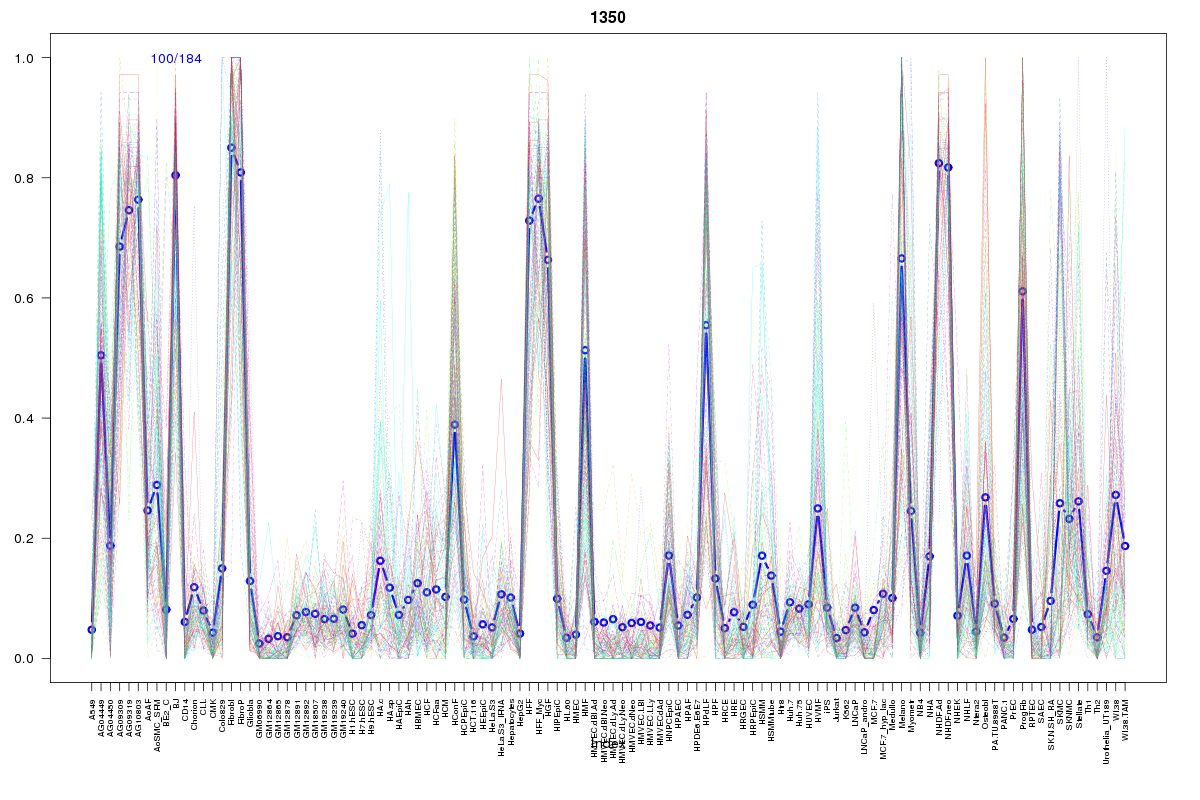 | 1350 | 1 |
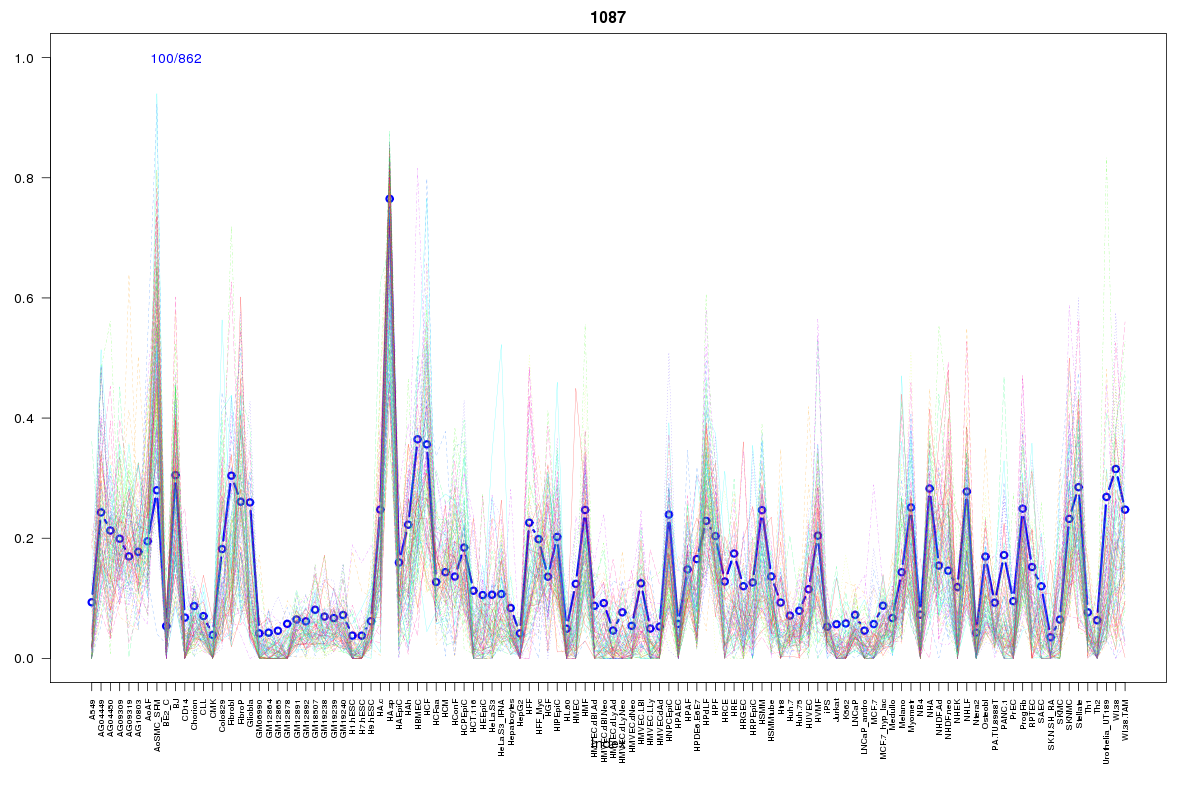 | 1087 | 1 |
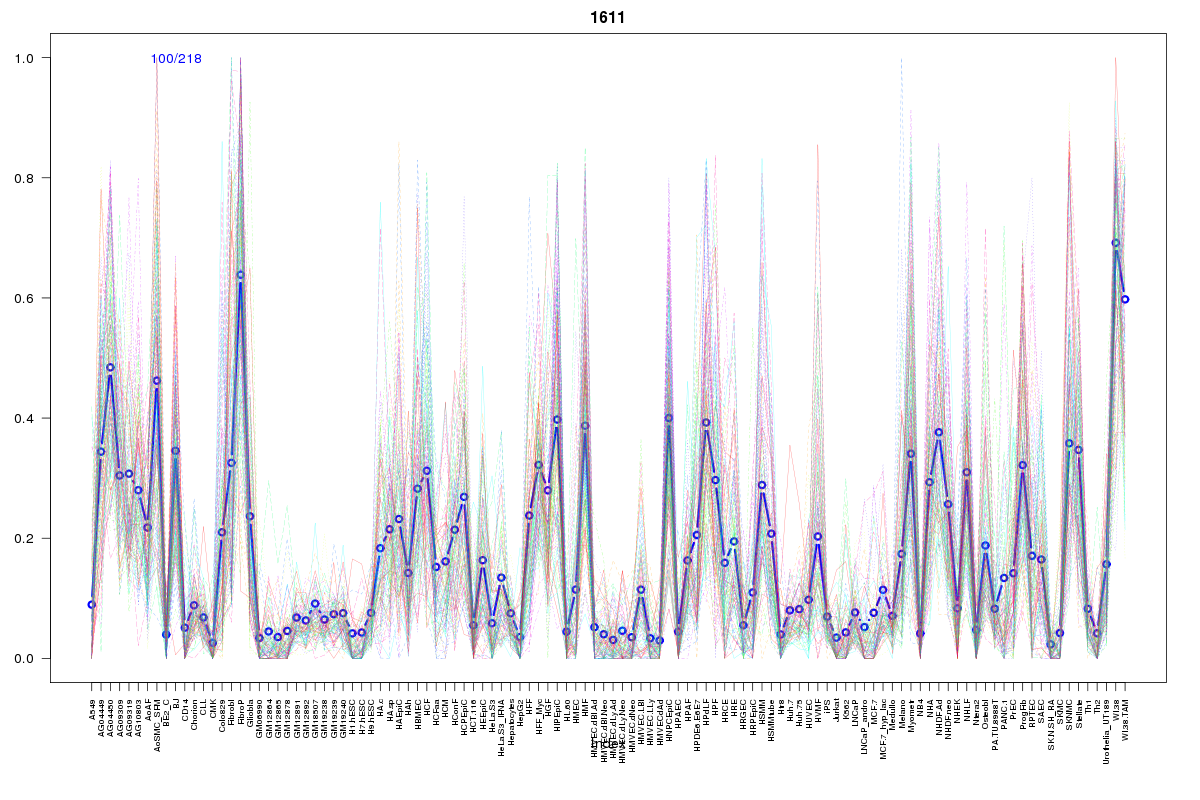 | 1611 | 1 |
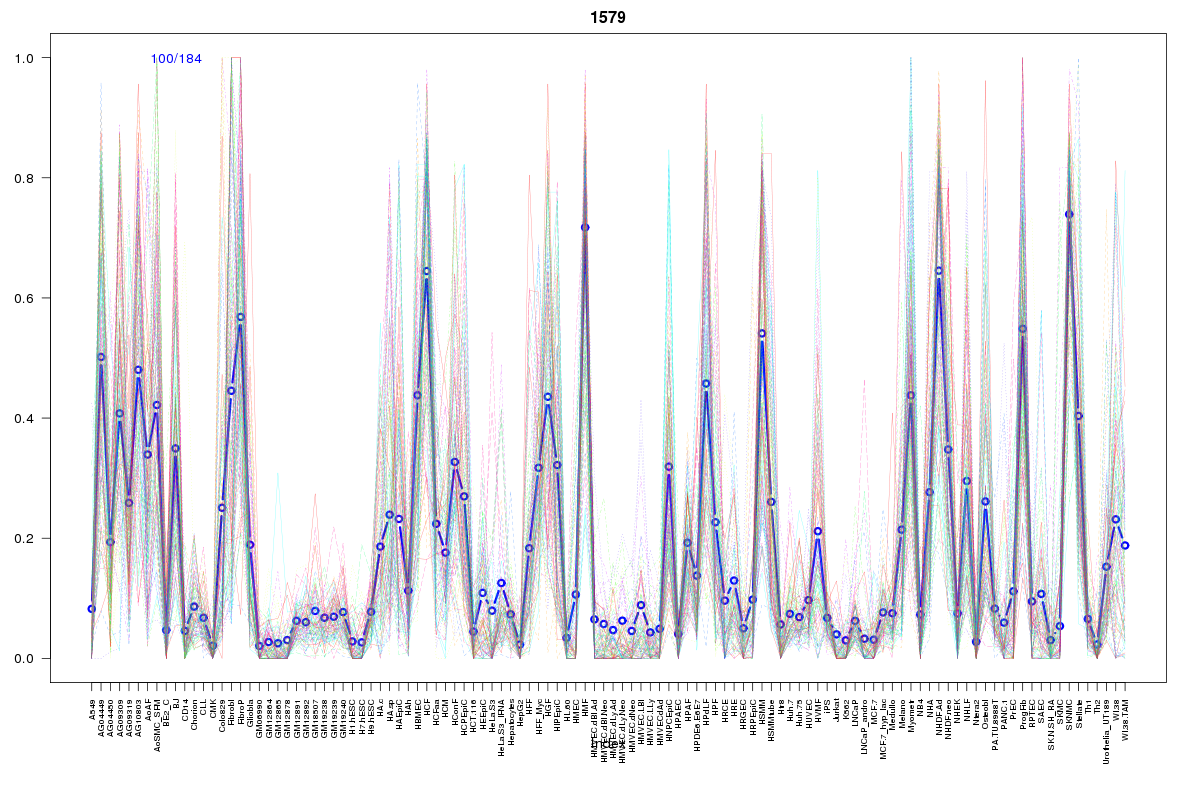 | 1579 | 1 |
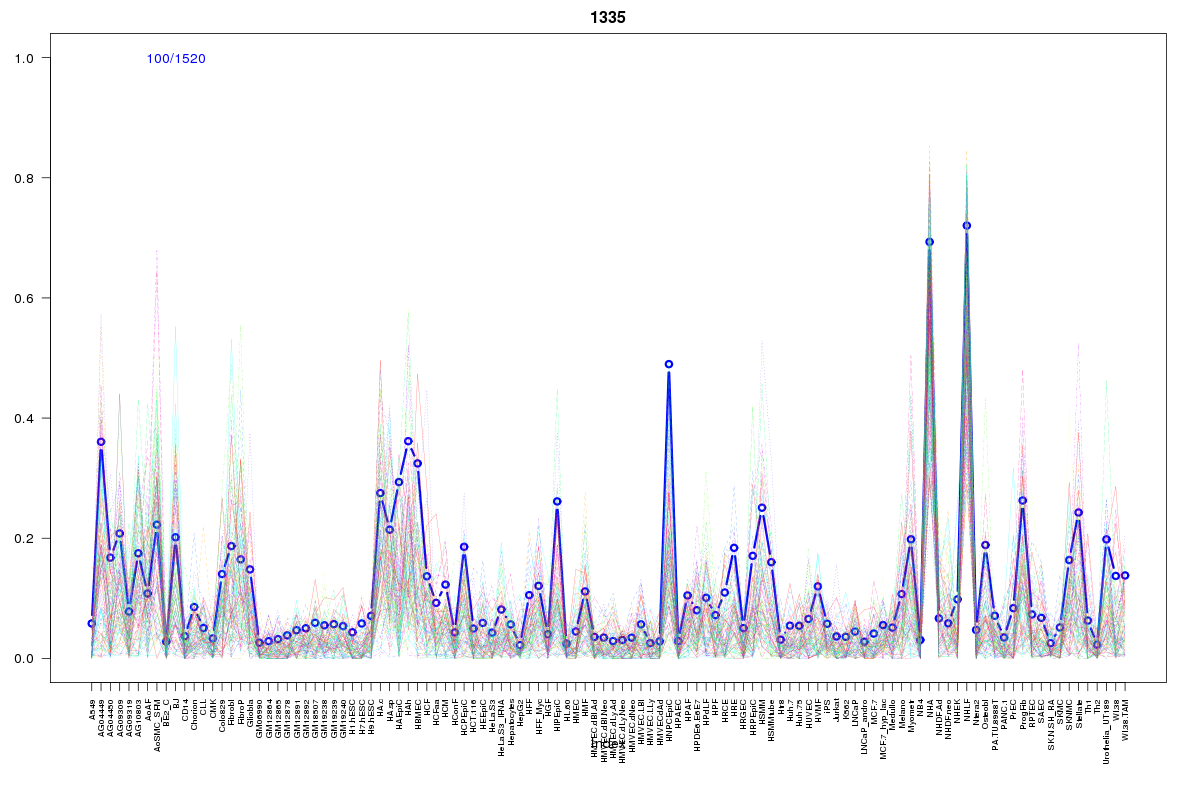 | 1335 | 1 |
 | 1598 | 1 |
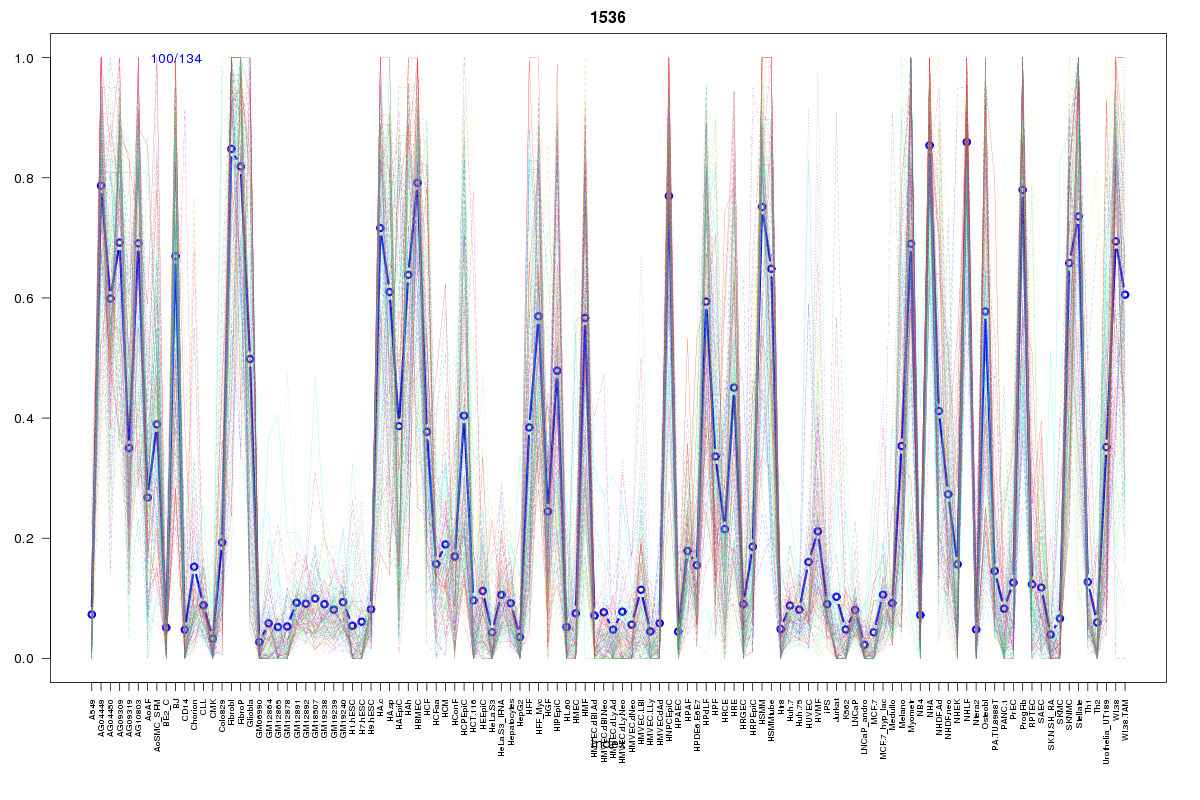 | 1536 | 1 |
 | 2401 | 1 |
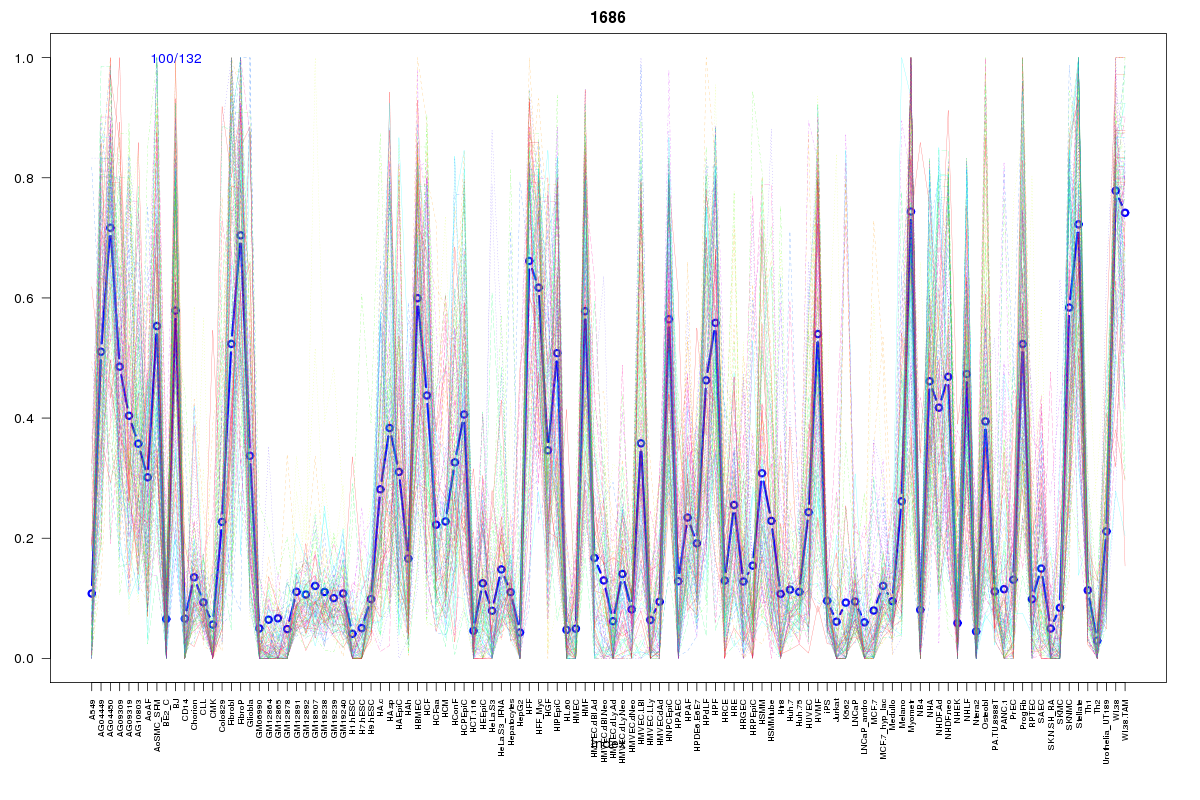 | 1686 | 1 |
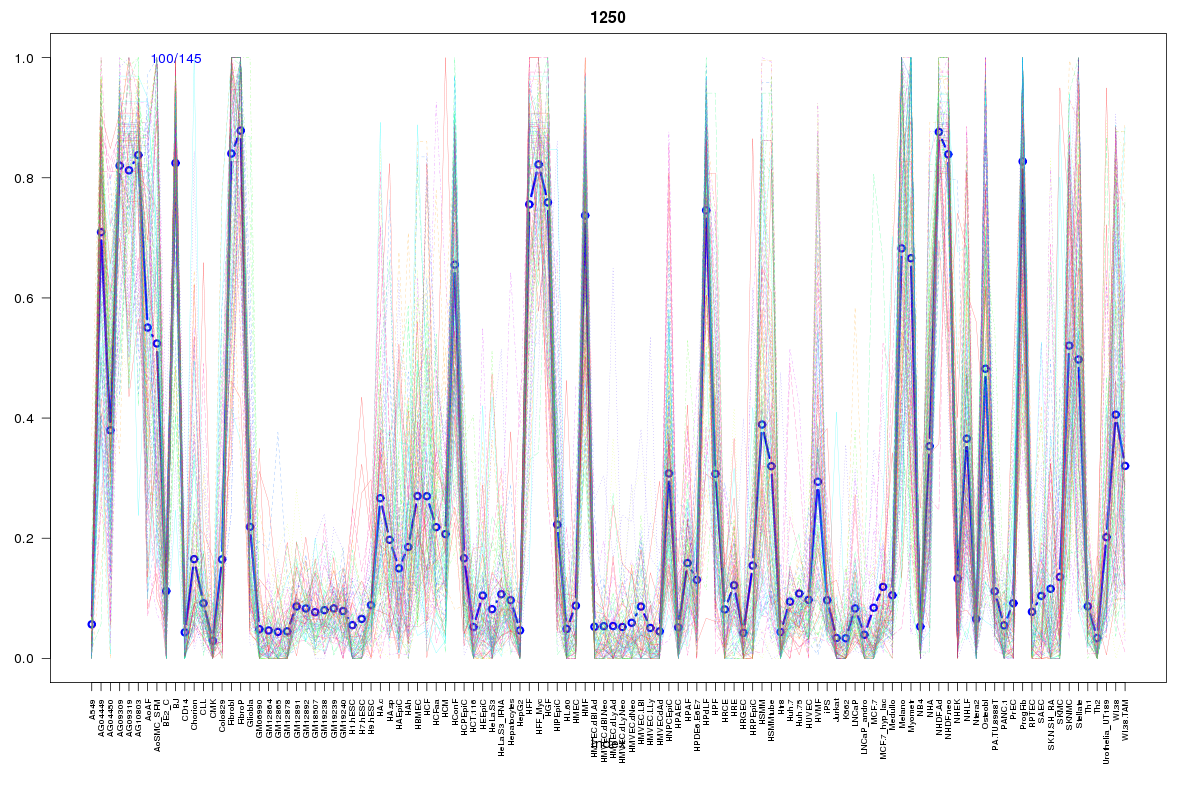 | 1250 | 1 |
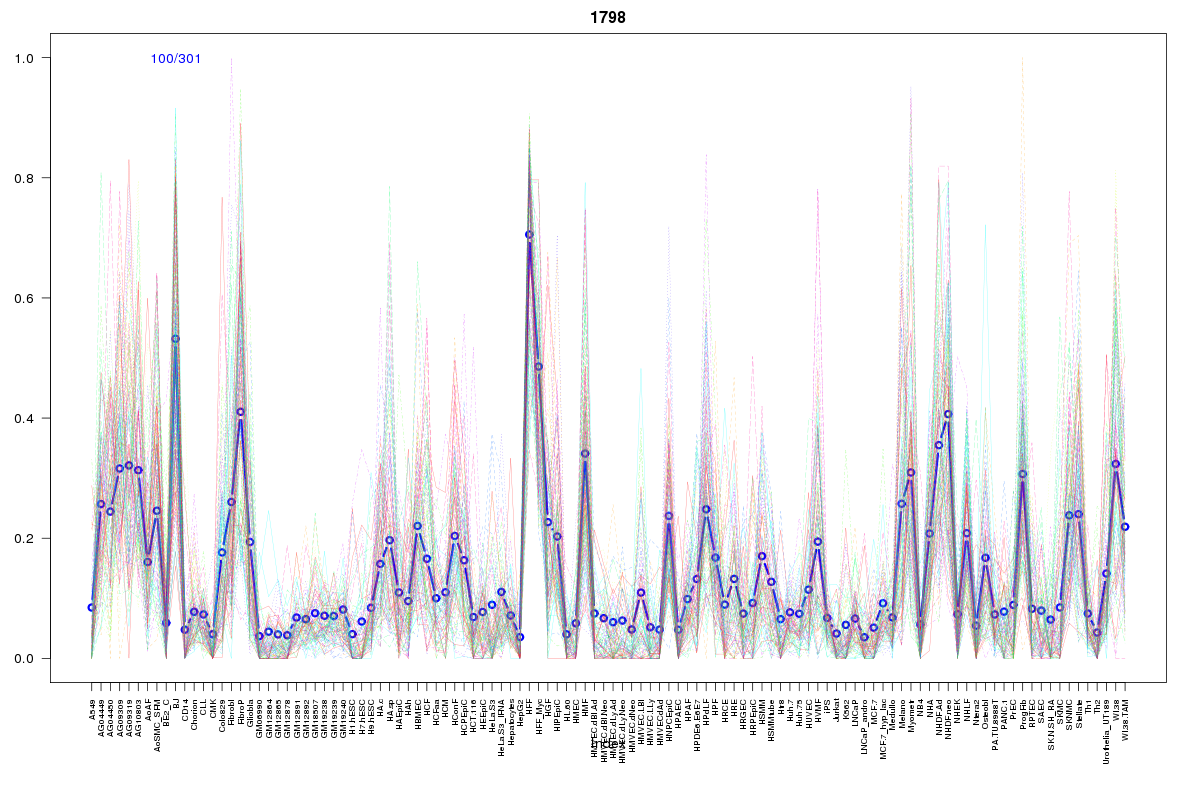 | 1798 | 1 |
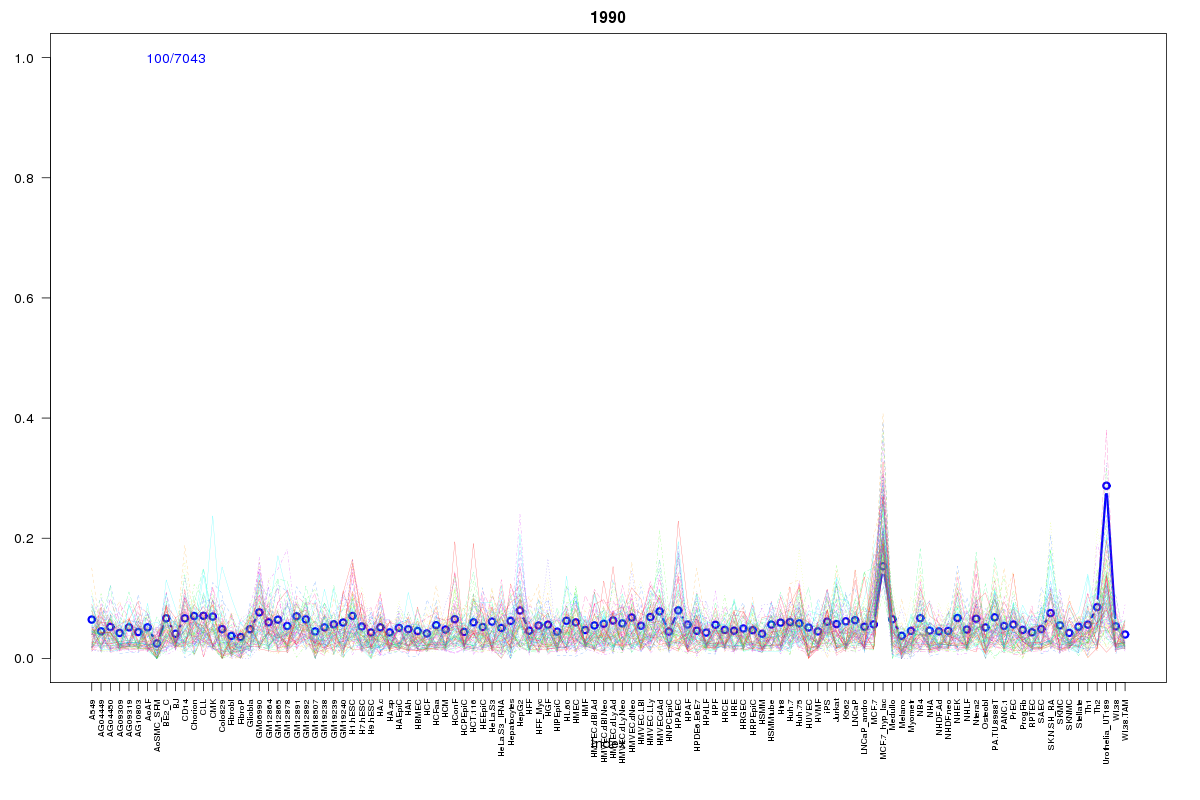 | 1990 | 1 |
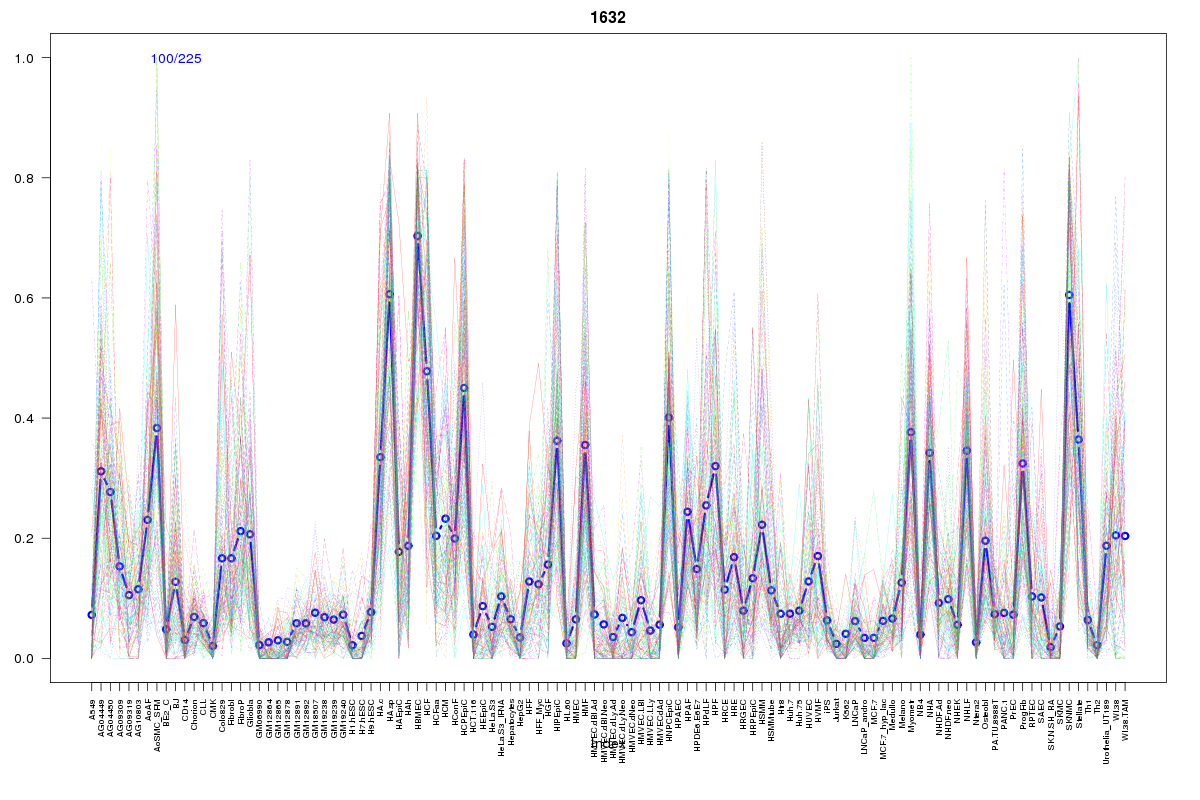 | 1632 | 1 |
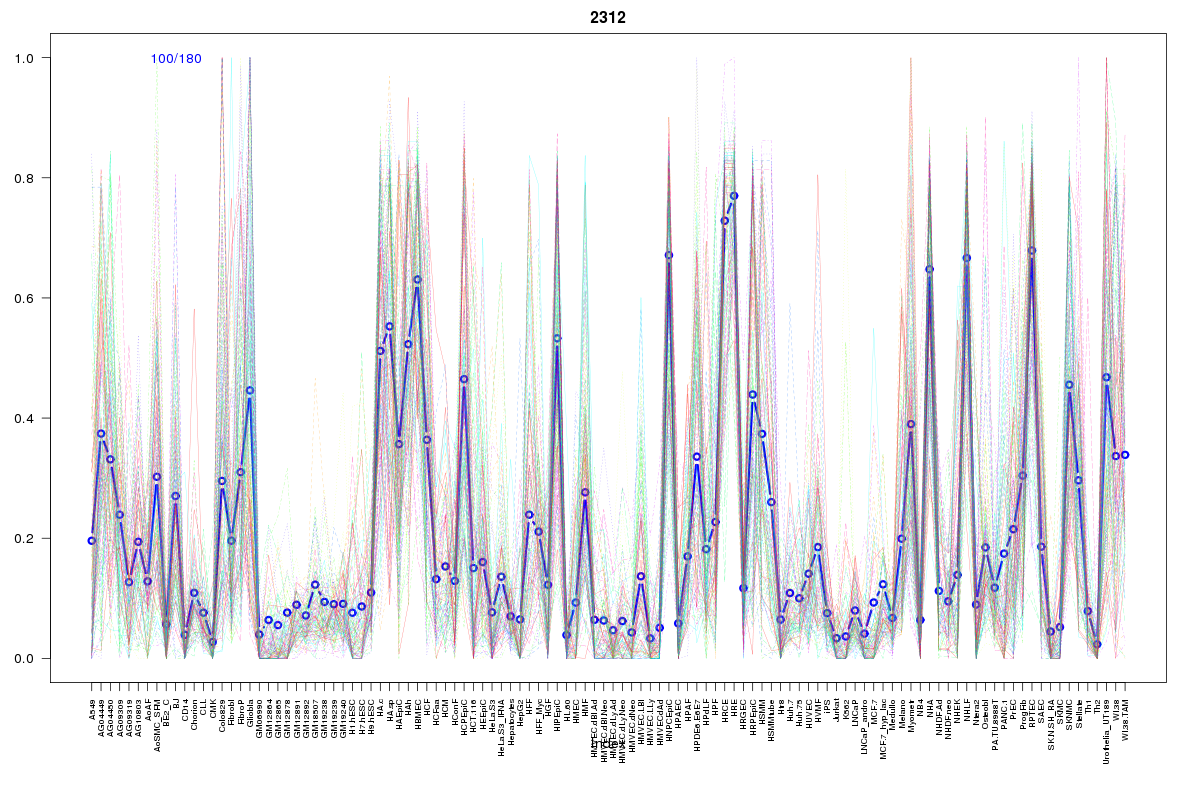 | 2312 | 1 |
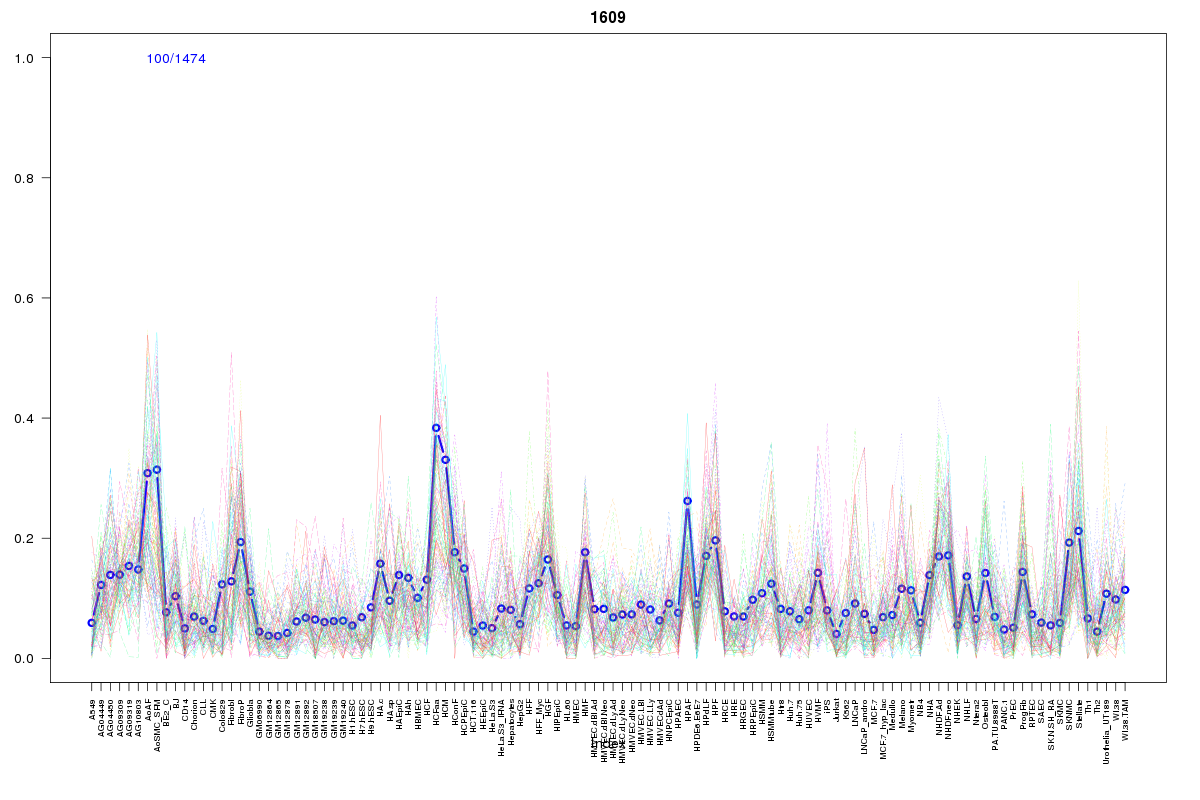 | 1609 | 1 |
 | 927 | 1 |
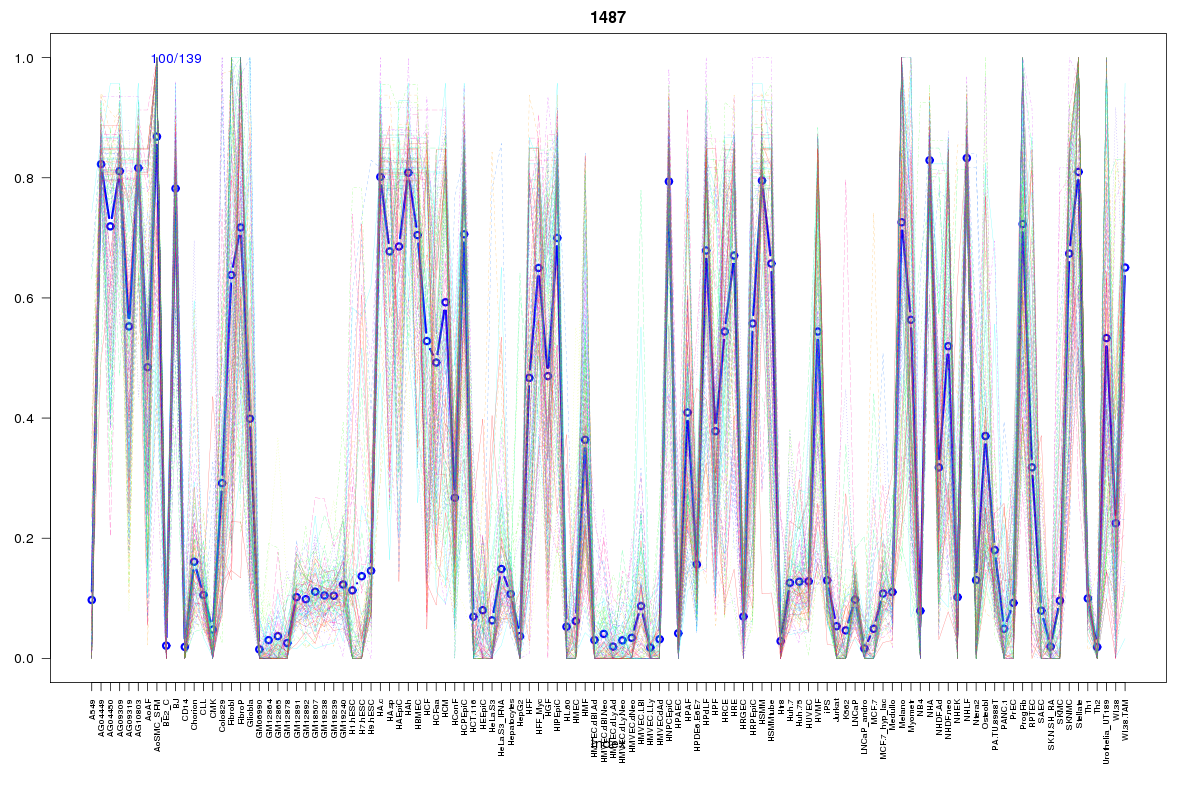 | 1487 | 1 |
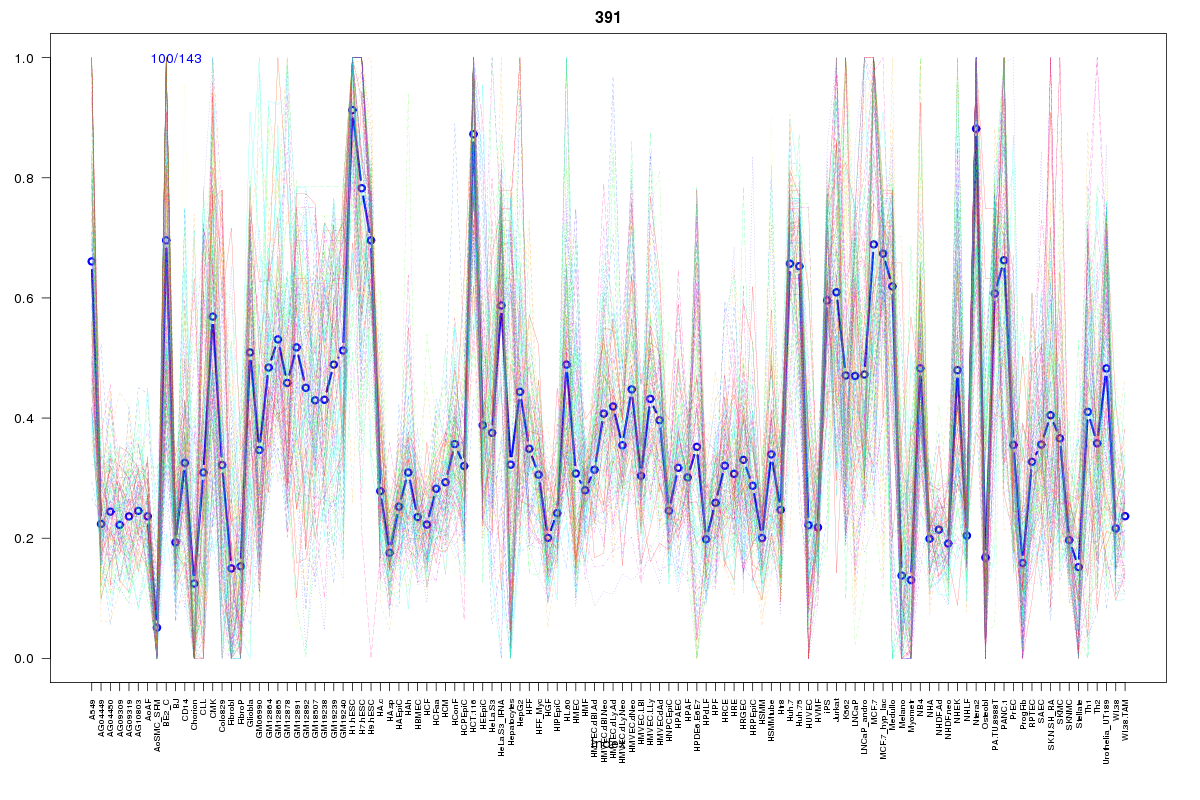 | 391 | 1 |
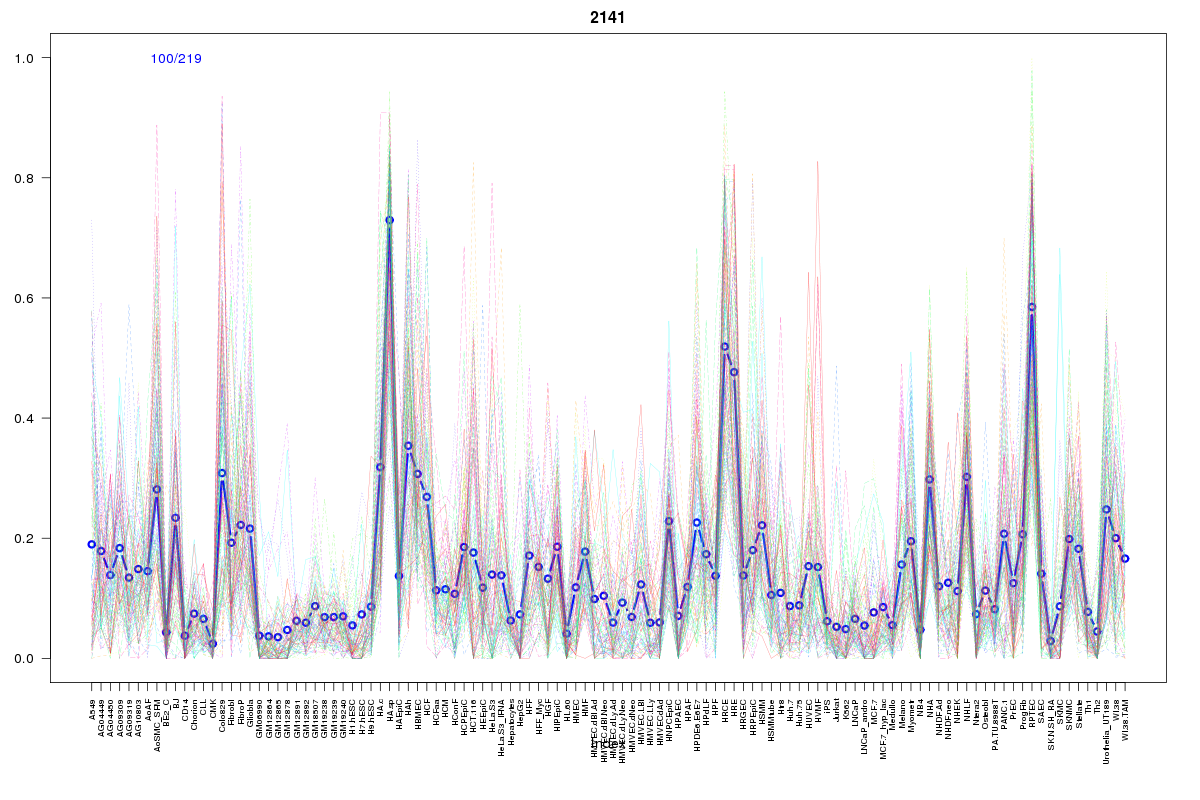 | 2141 | 1 |
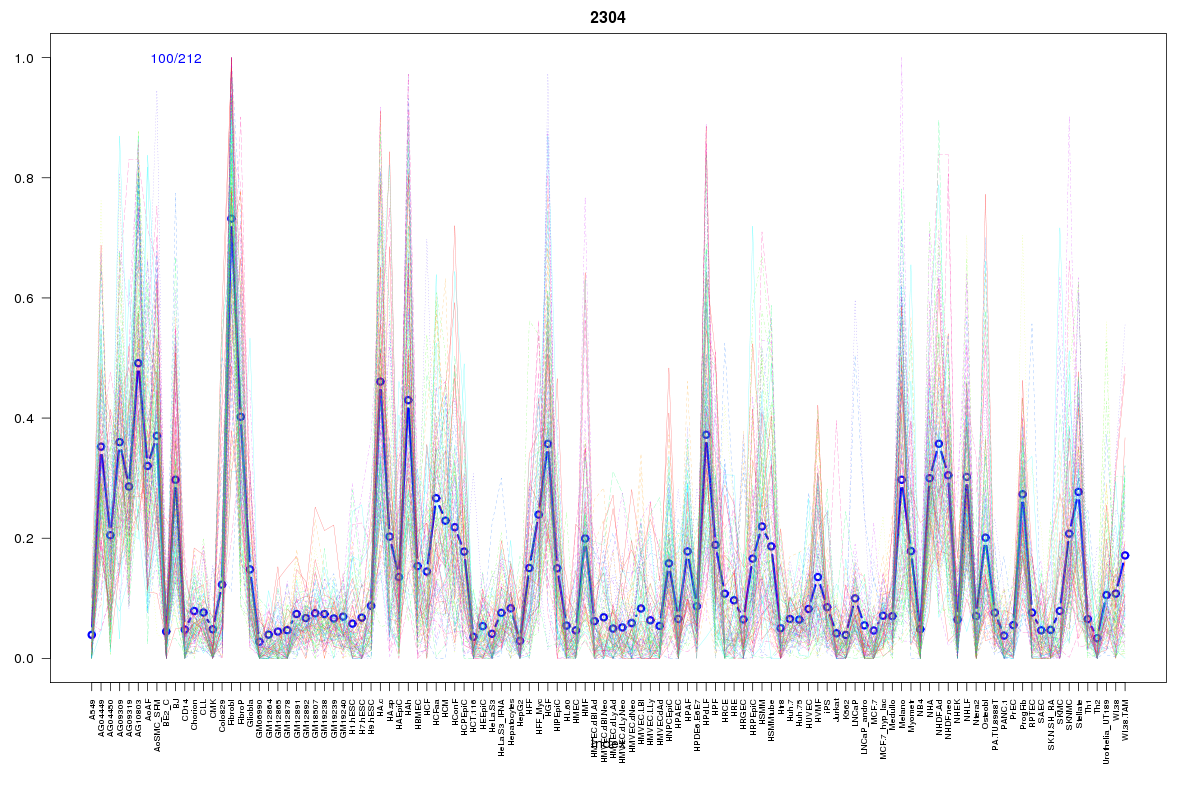 | 2304 | 1 |
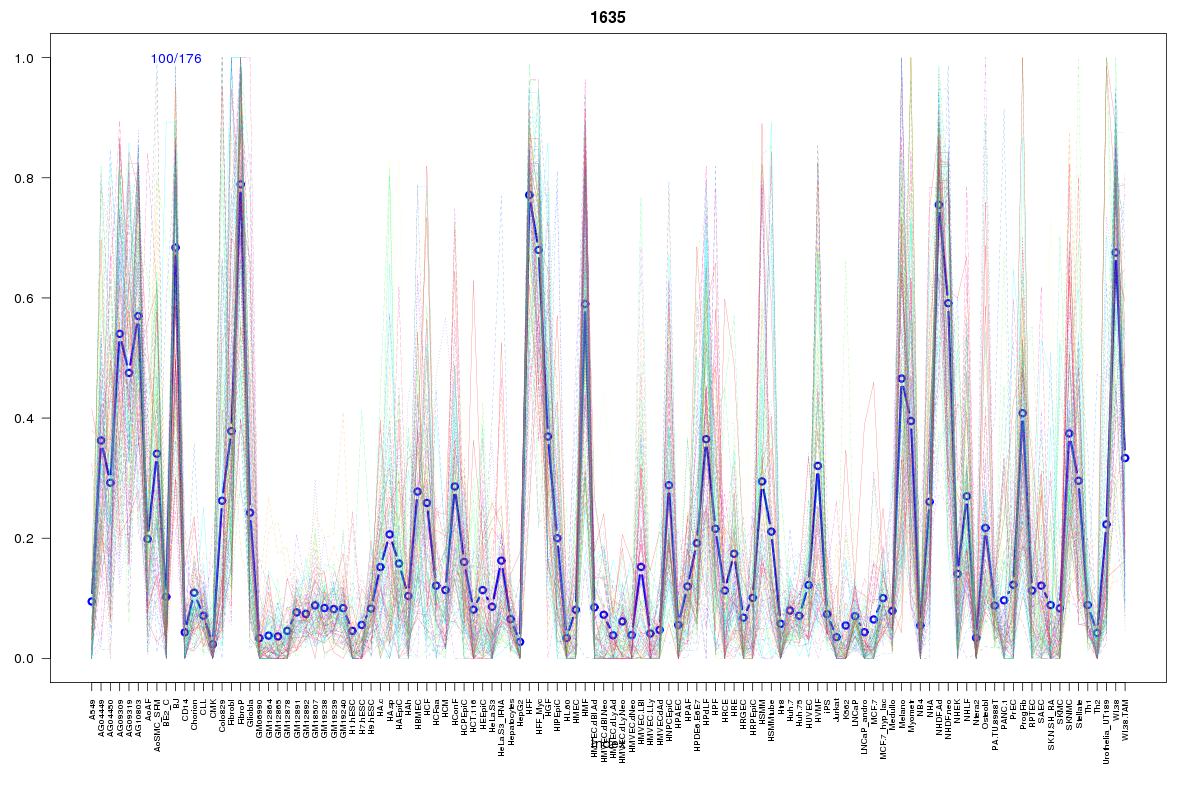 | 1635 | 1 |
 | 1596 | 1 |
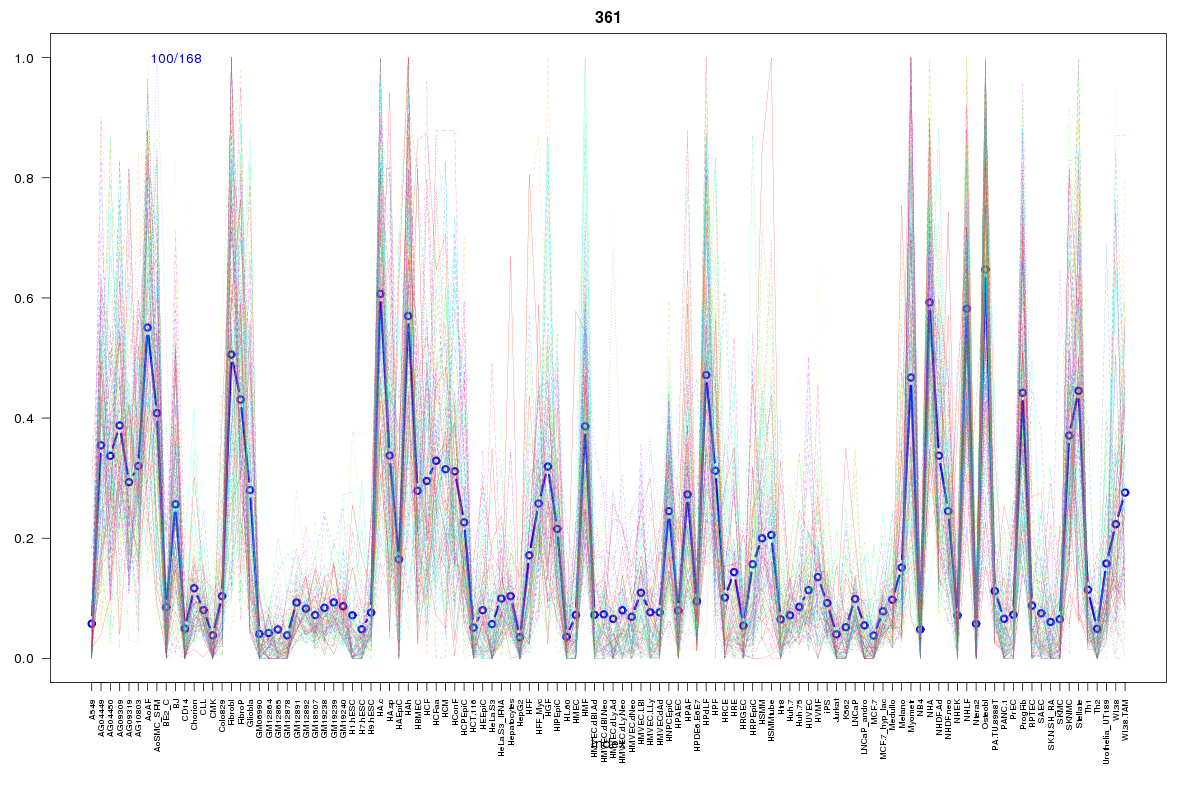 | 361 | 1 |
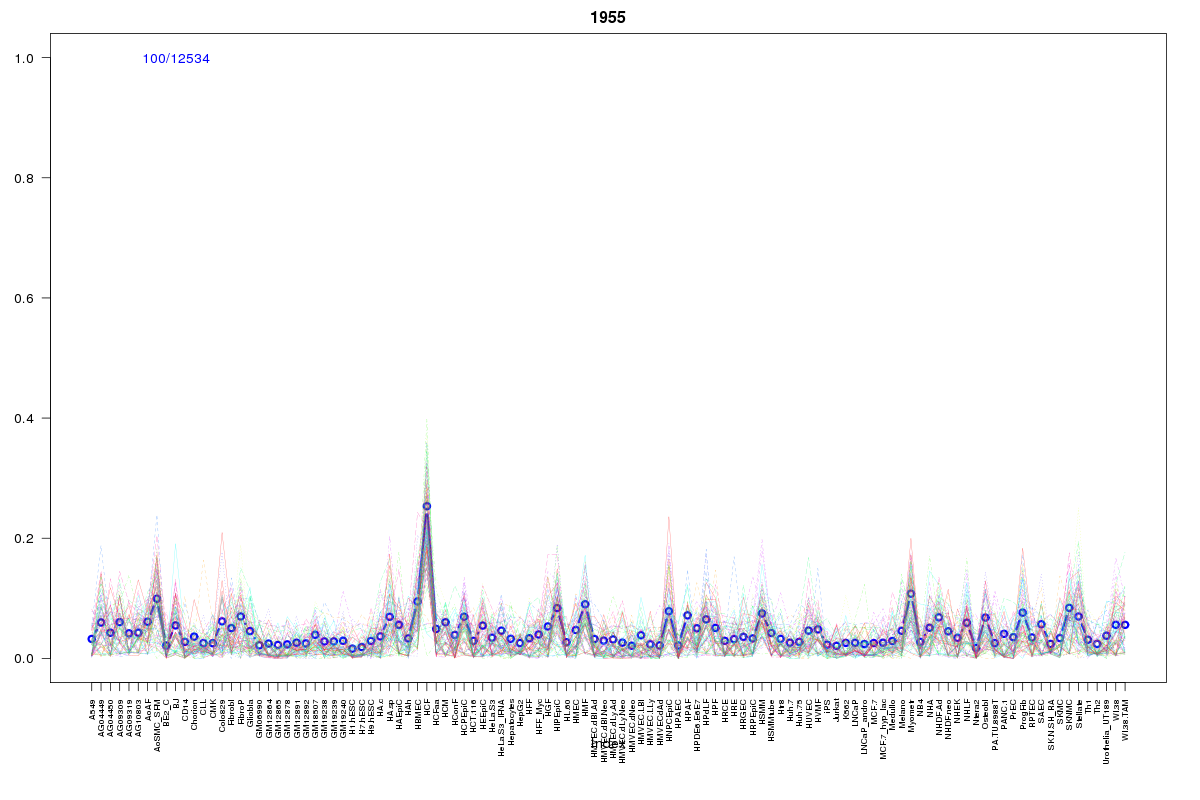 | 1955 | 1 |
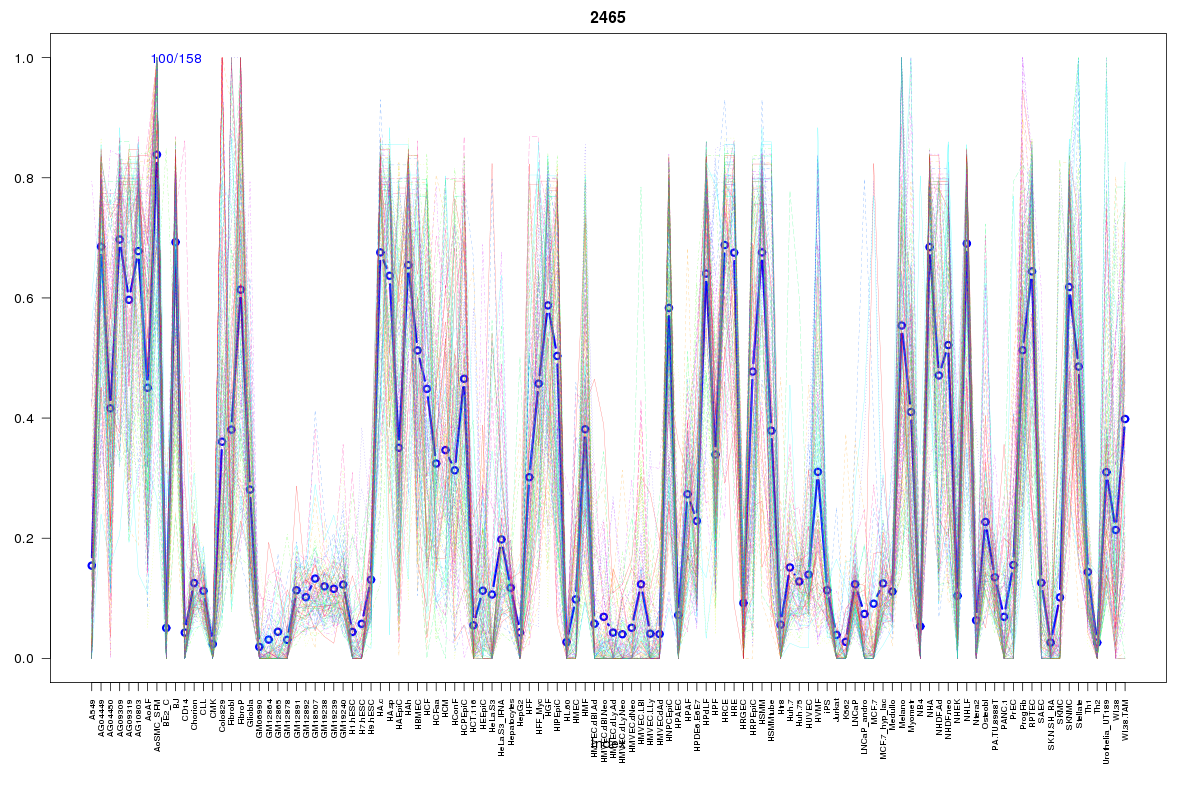 | 2465 | 1 |
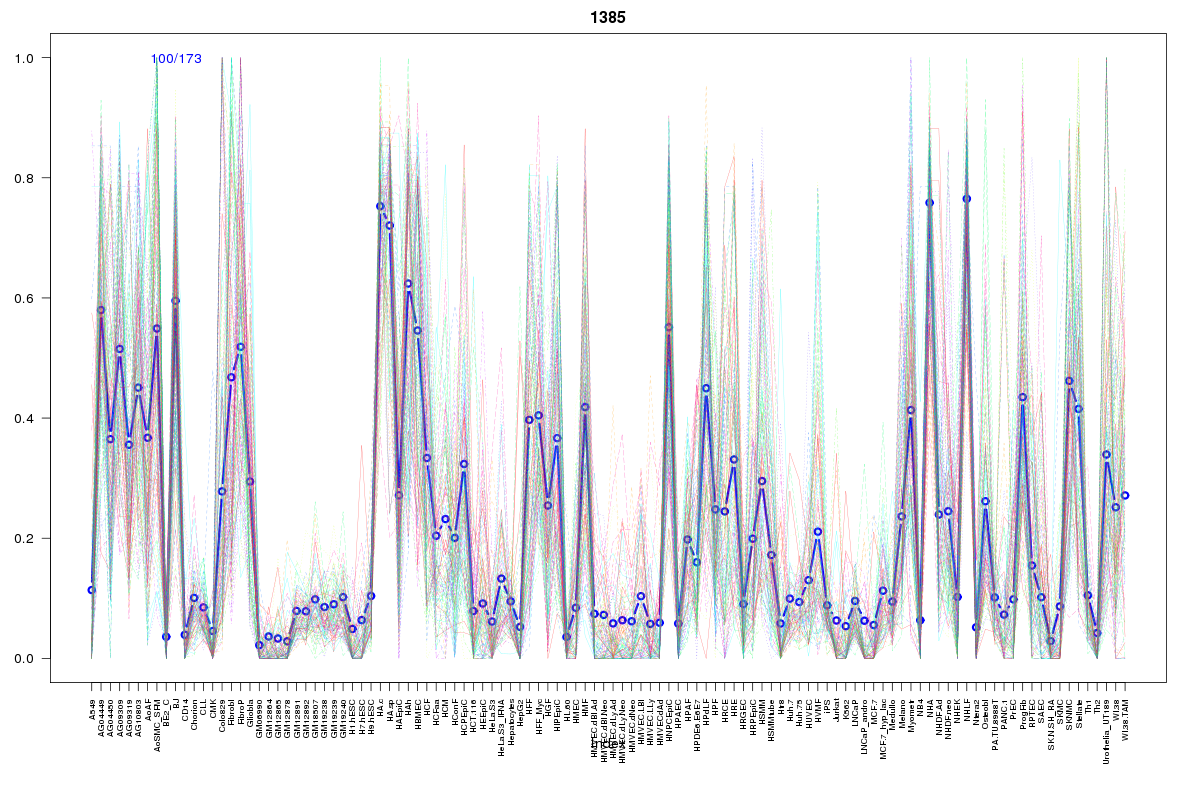 | 1385 | 1 |
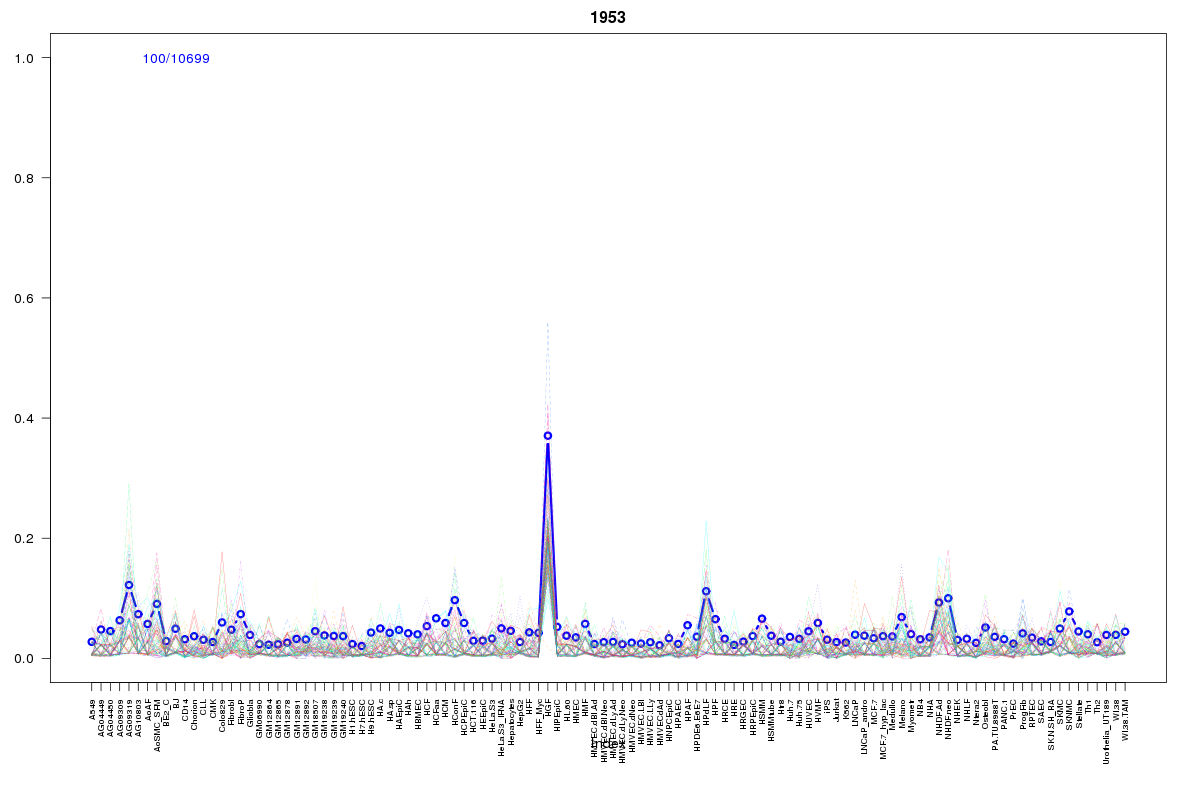 | 1953 | 1 |
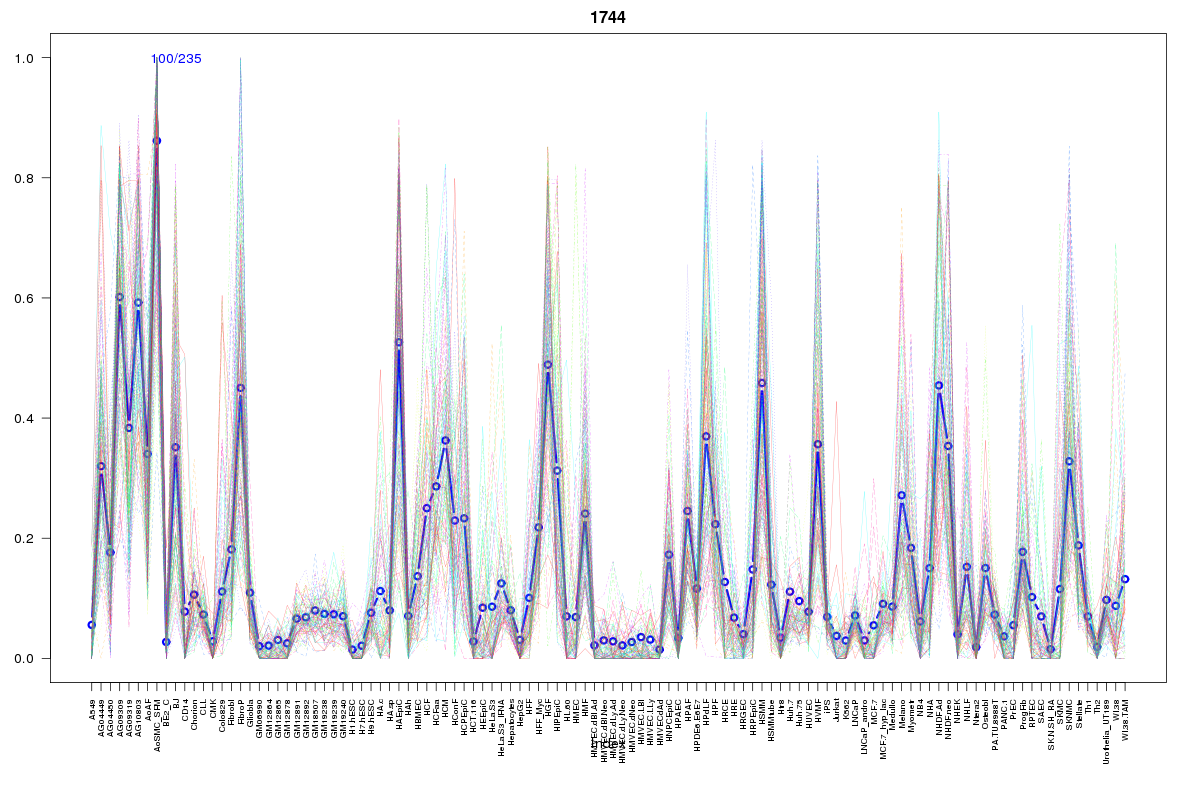 | 1744 | 1 |
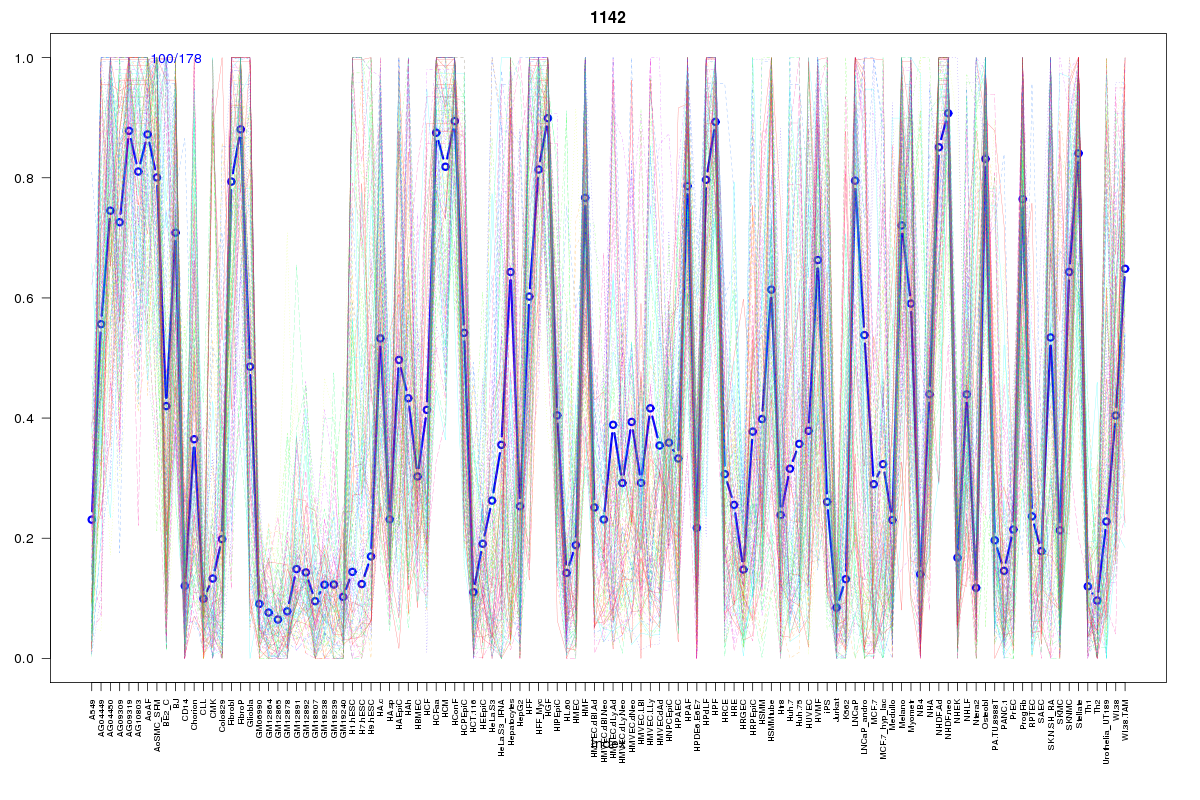 | 1142 | 1 |
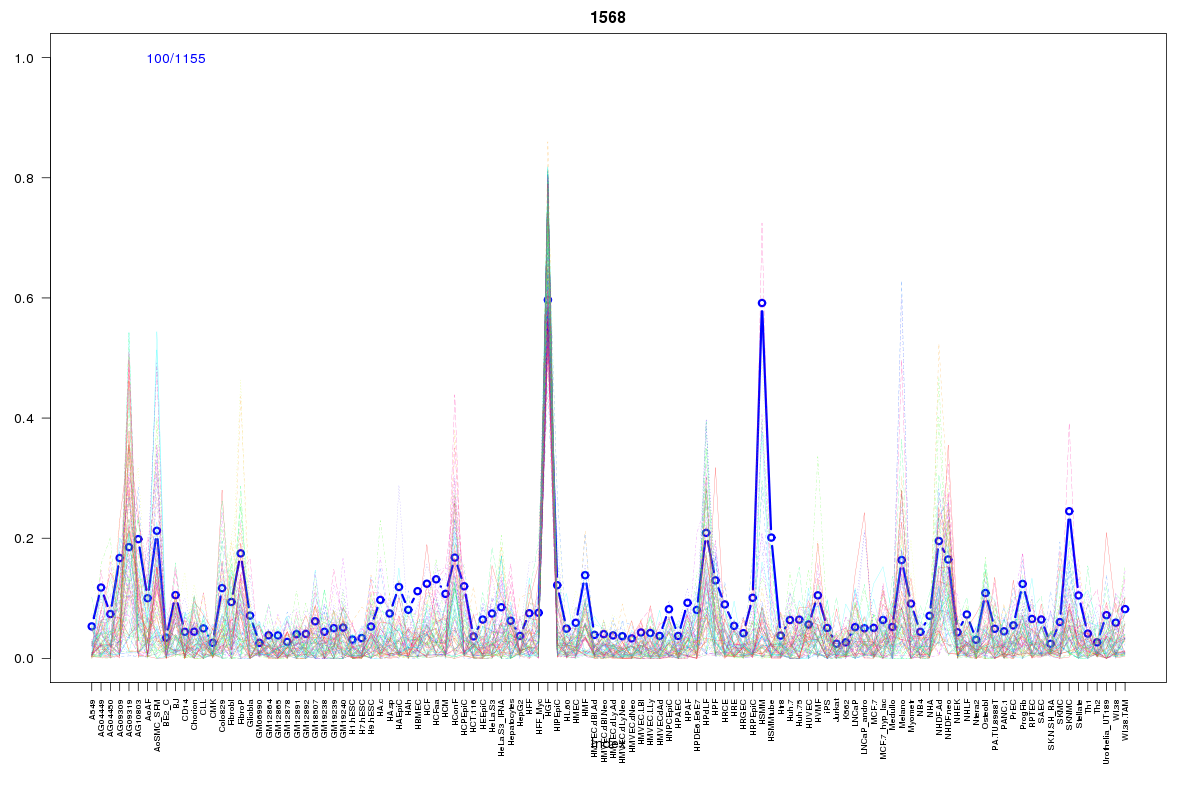 | 1568 | 1 |
Resources
BED file downloads
Connects to 40 DHS sitesTop 10 Correlated DHS Sites
p-values indiciate significant higher or lower correlation| Location | Cluster | P-value |
|---|---|---|
| chr1:54198760-54198910 | 1148 | 0 |
| chr1:54206460-54206610 | 1596 | 0 |
| chr1:54206620-54206770 | 1148 | 0 |
| chr1:54202120-54202270 | 1632 | 0 |
| chr1:54122140-54122290 | 1250 | 0.001 |
| chr1:54199840-54199990 | 1536 | 0.001 |
| chr1:53978120-53978270 | 1385 | 0.002 |
| chr1:54090800-54090950 | 1579 | 0.003 |
| chr1:53977940-53978090 | 361 | 0.003 |
| chr1:54206285-54206435 | 2141 | 0.004 |
| chr1:54197680-54197830 | 2054 | 0.005 |
External Databases
UCSCEnsembl (ENSG00000174332)