Gene: GSTA3
chr6: 52761436-52774483Expression Profile
(log scale)
Graphical Connections
Distribution of linked clusters:
You may find it interesting if many of the connected DHS sites belong to the same cluster.| Cluster Profile | Cluster ID | Number of DHS sites in this cluster |
|---|---|---|
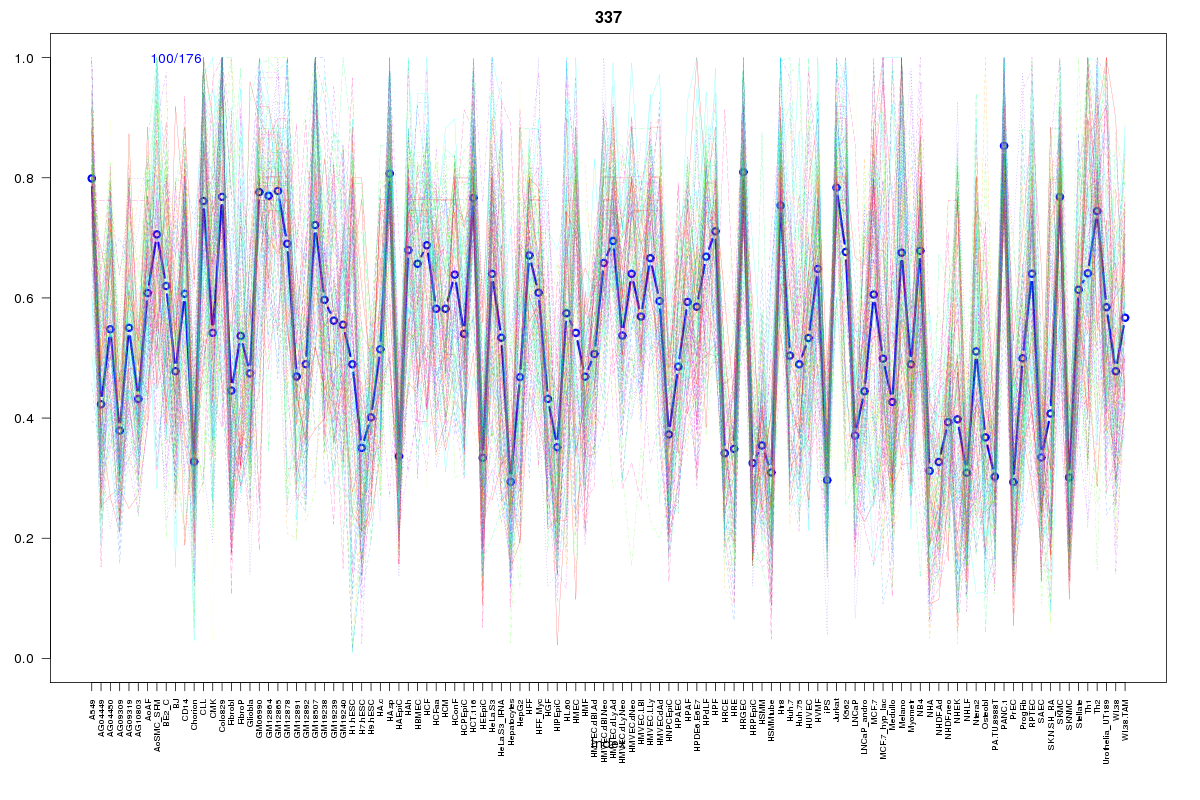 | 337 | 1 |
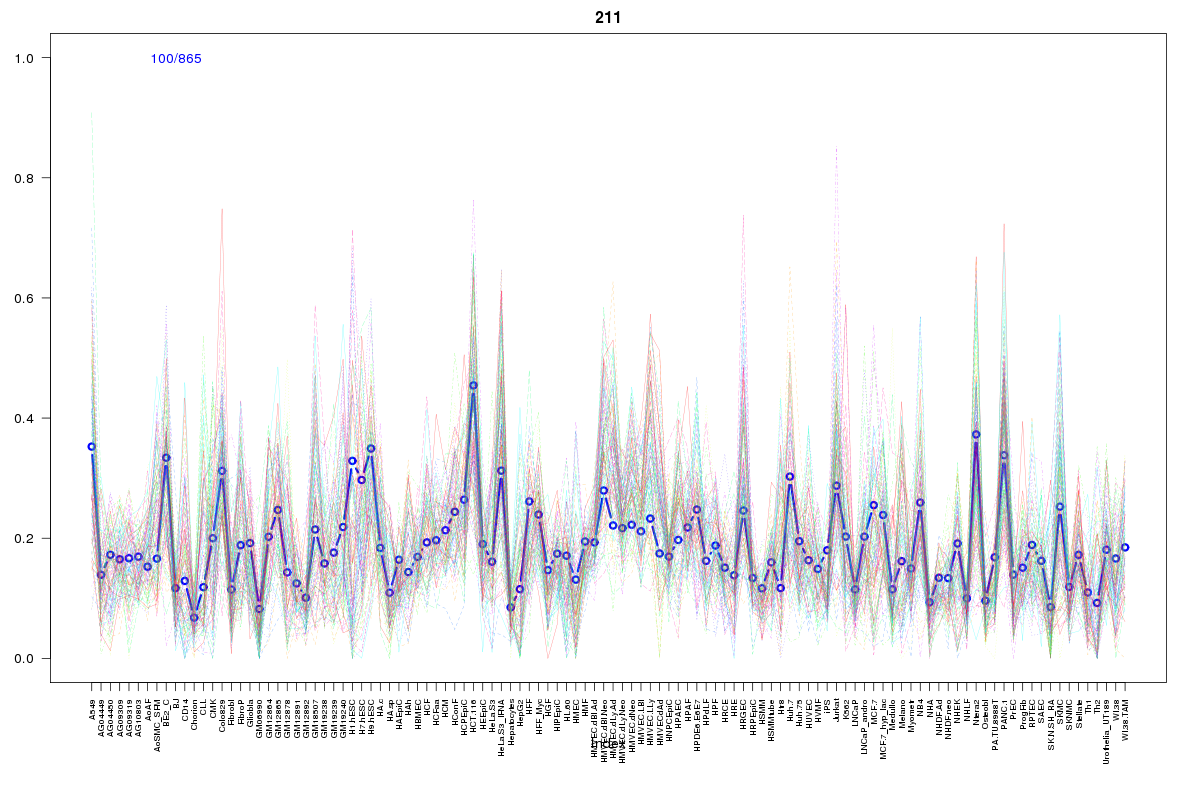 | 211 | 1 |
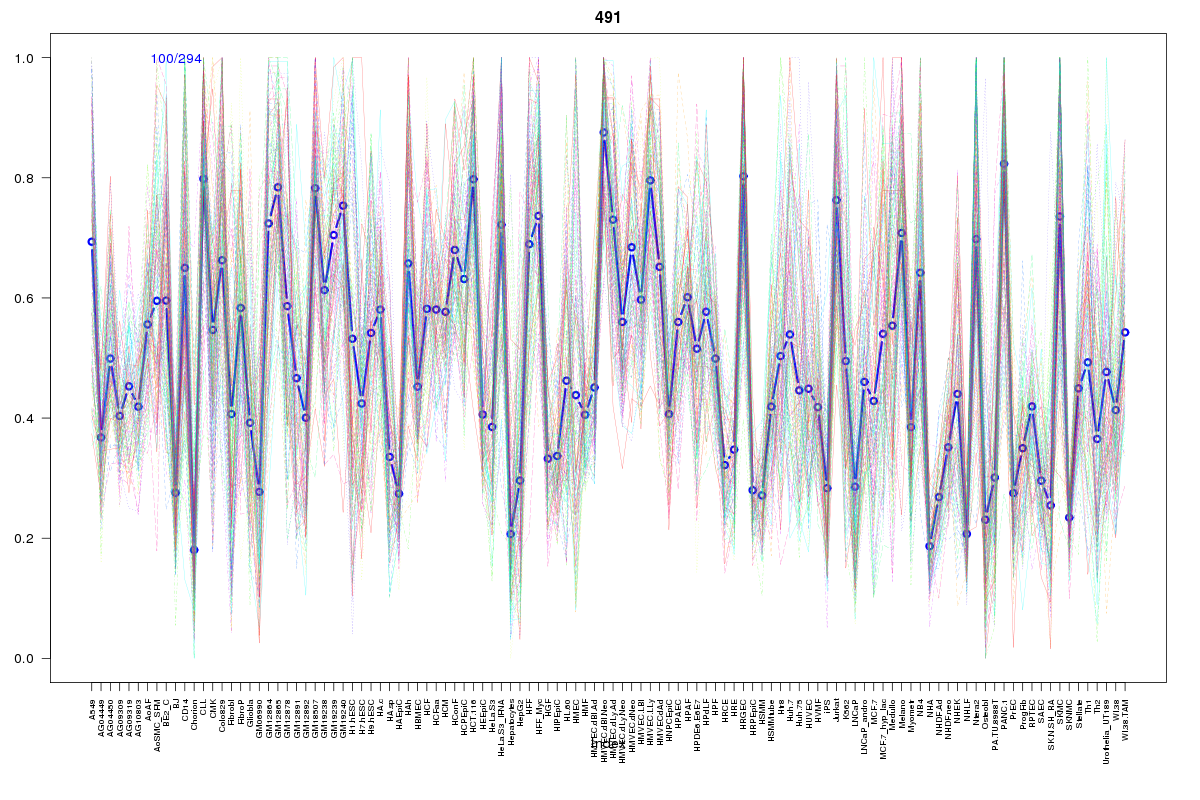 | 491 | 1 |
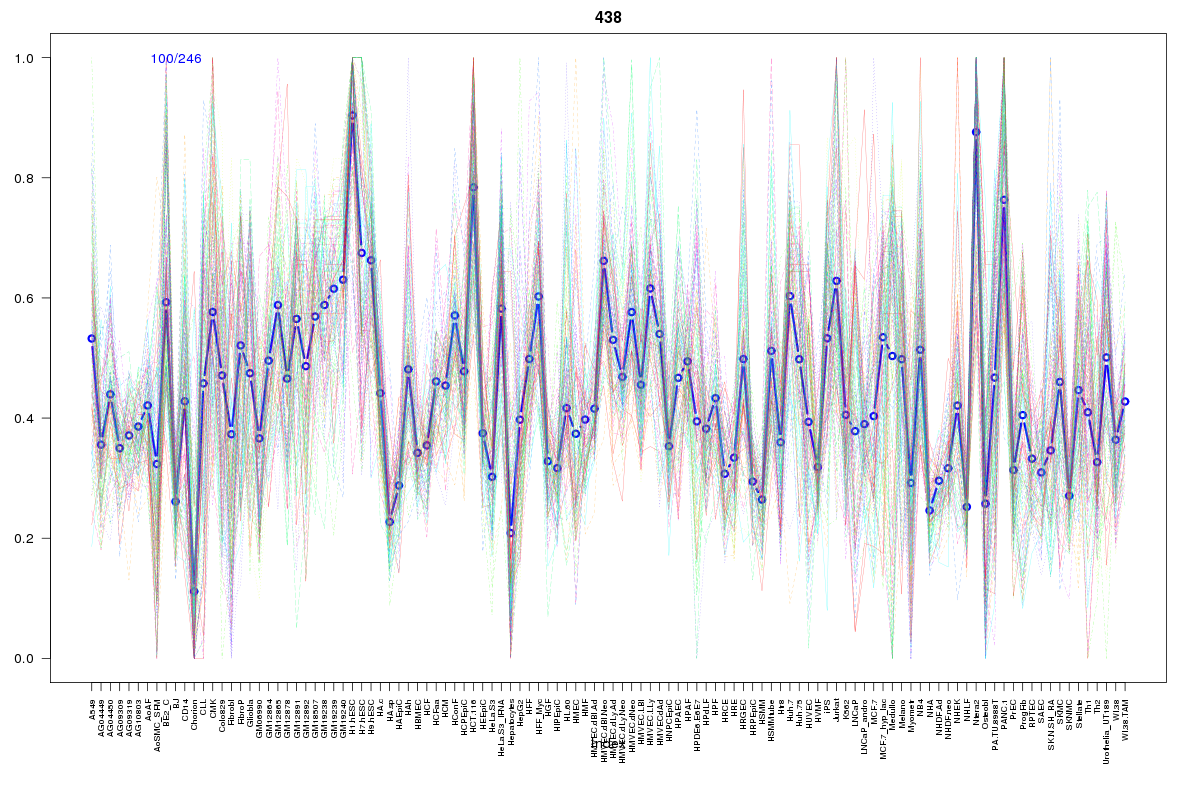 | 438 | 1 |
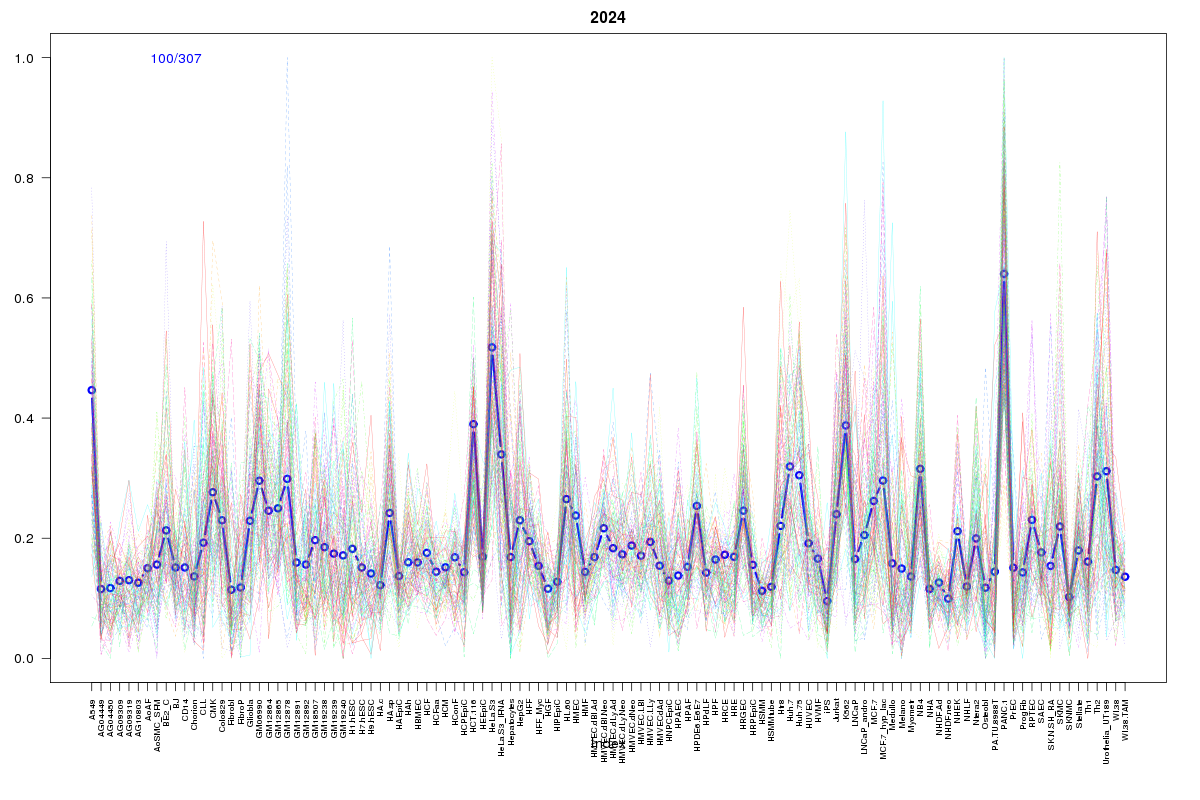 | 2024 | 1 |
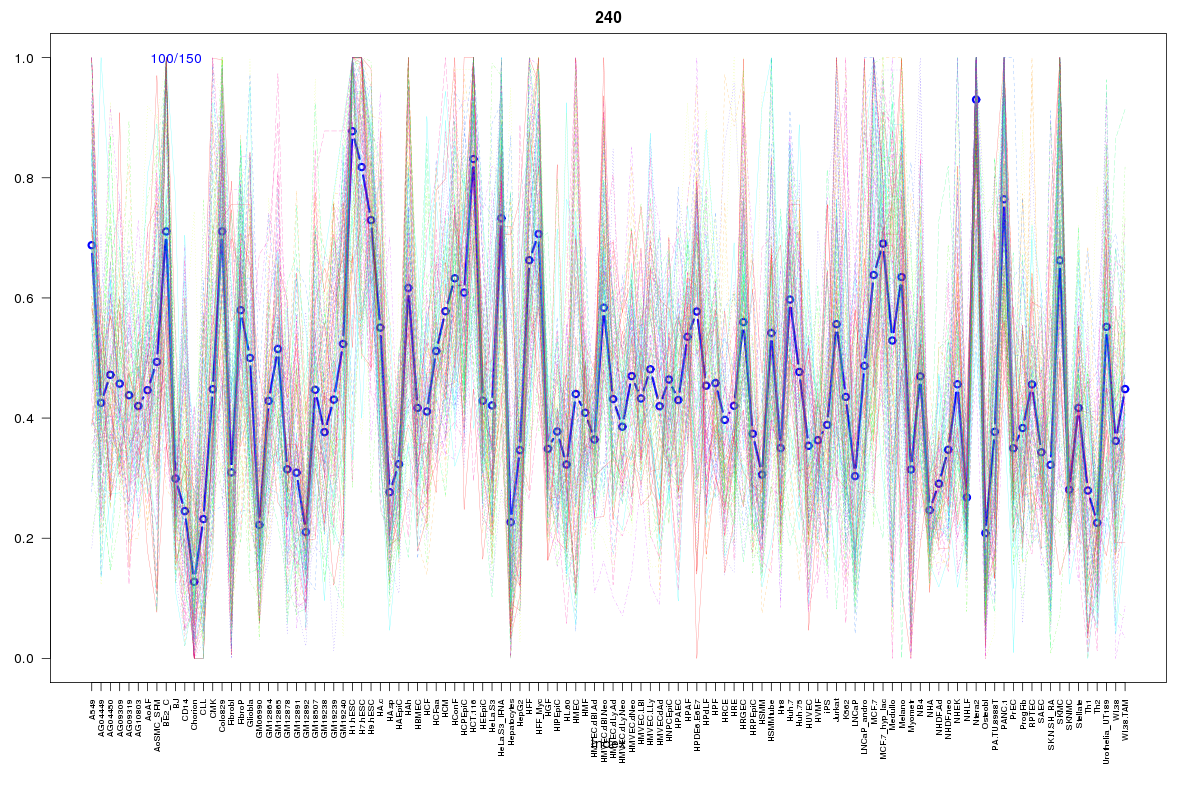 | 240 | 1 |
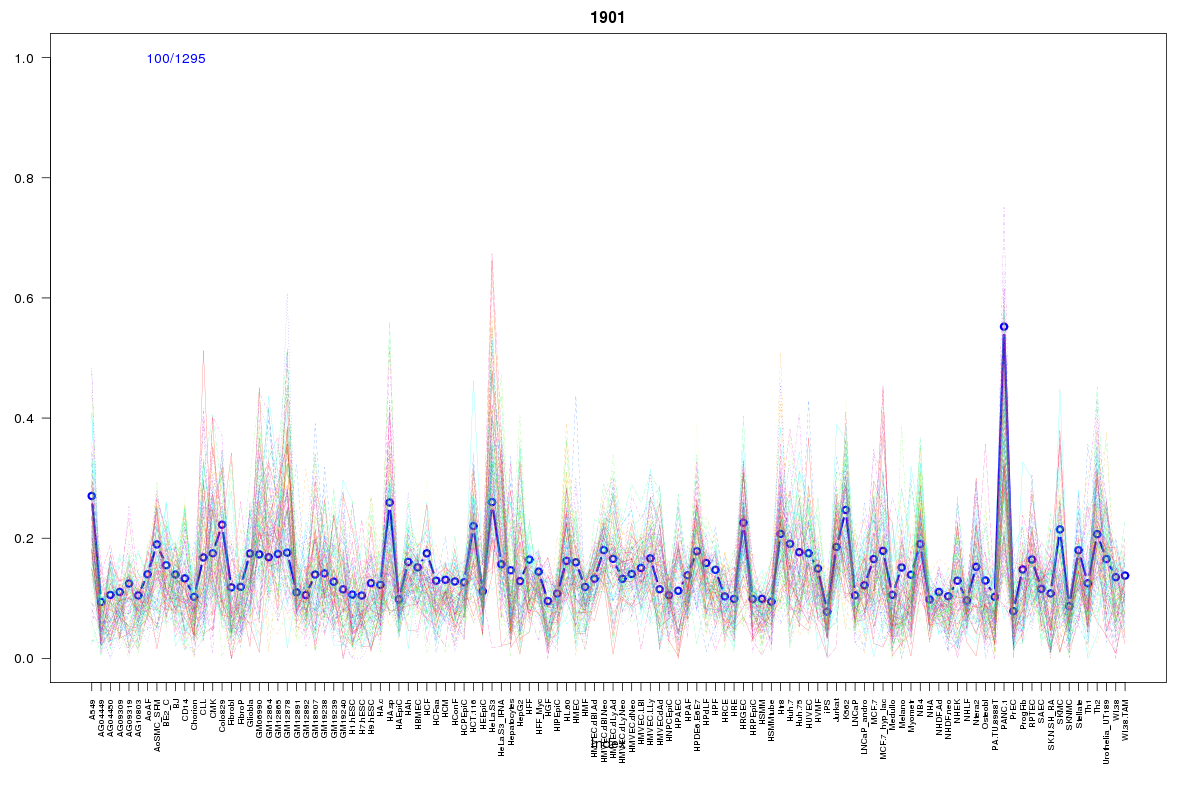 | 1901 | 1 |
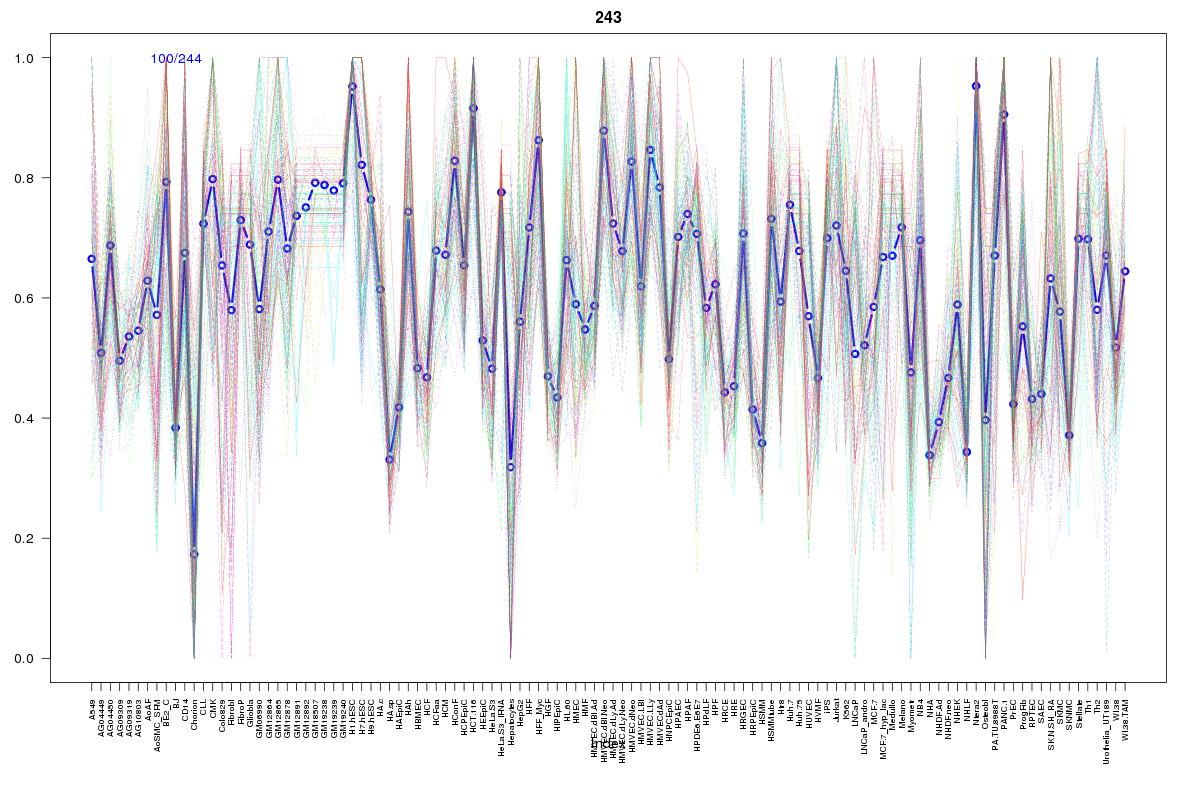 | 243 | 1 |
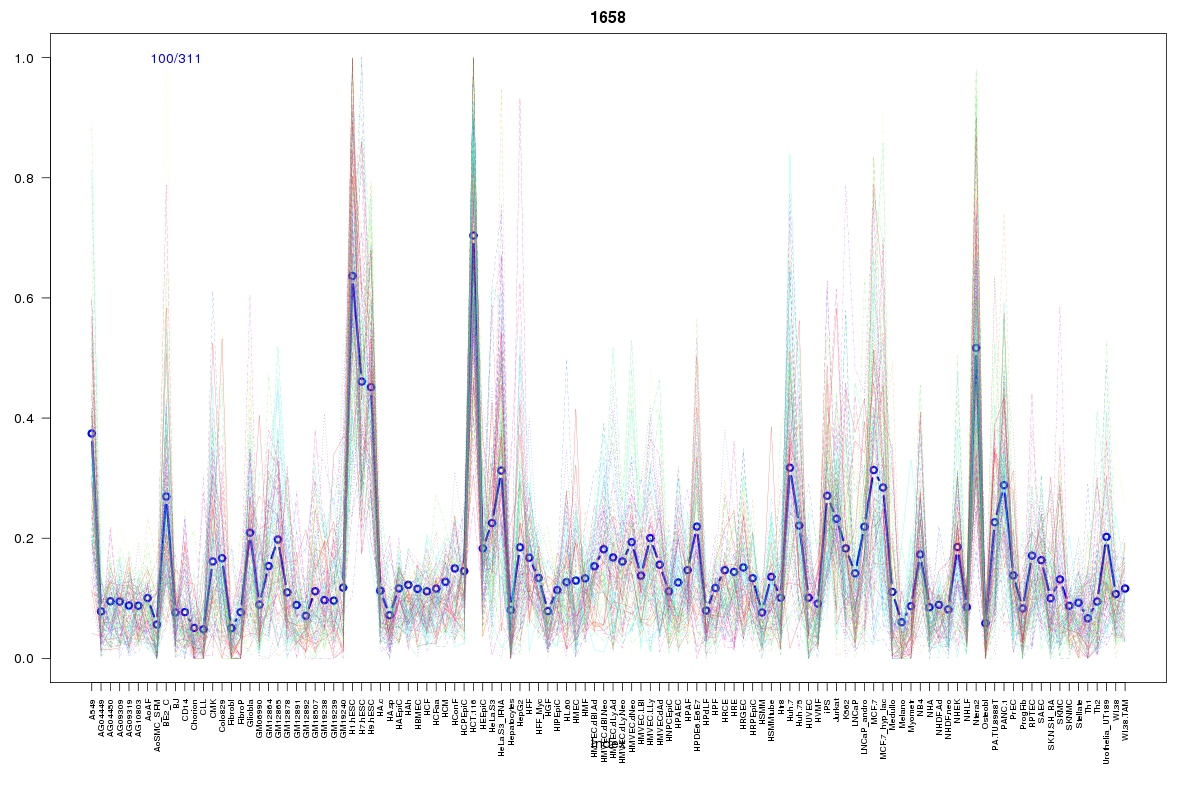 | 1658 | 1 |
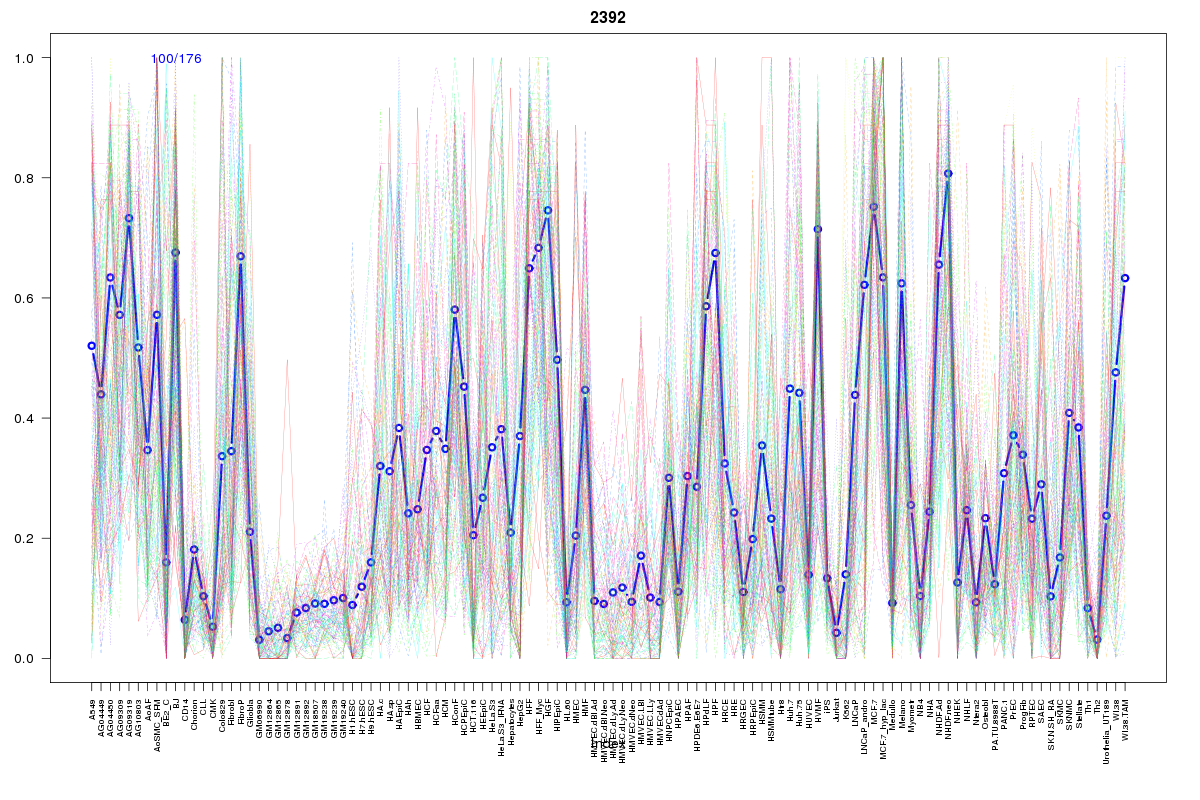 | 2392 | 1 |
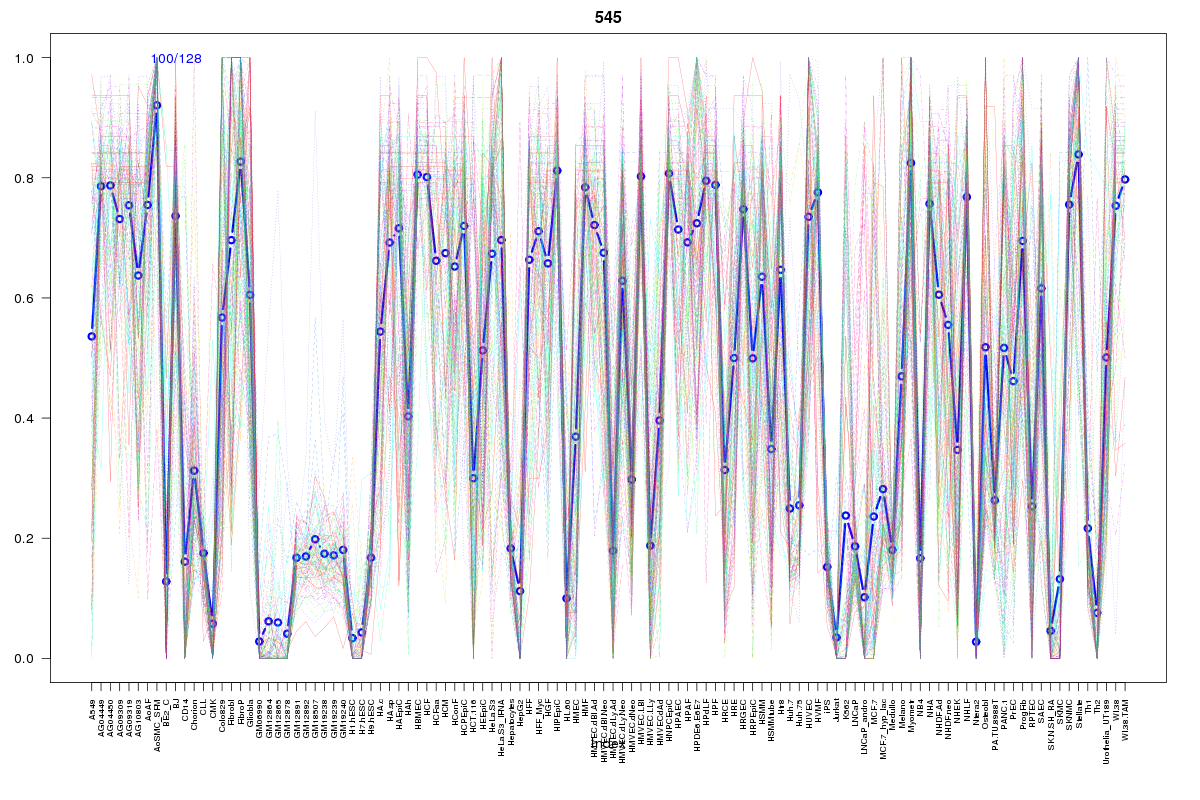 | 545 | 1 |
 | 2055 | 1 |
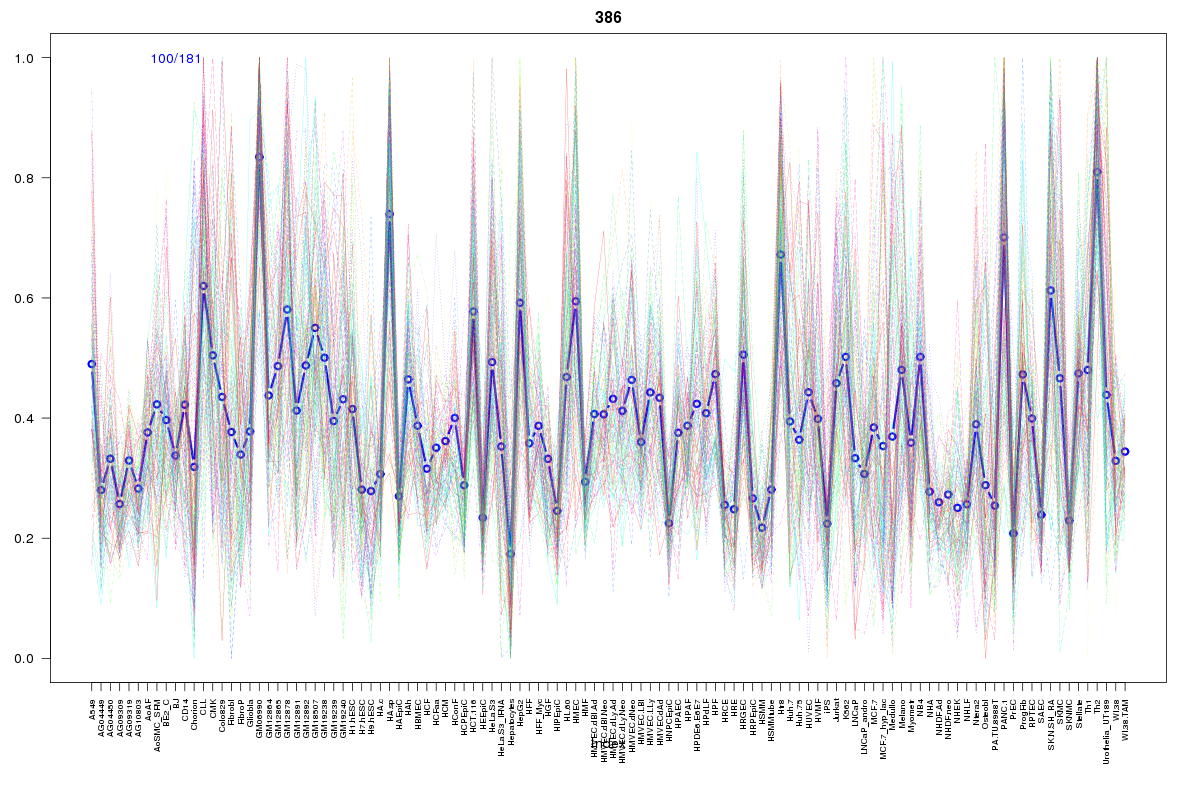 | 386 | 1 |
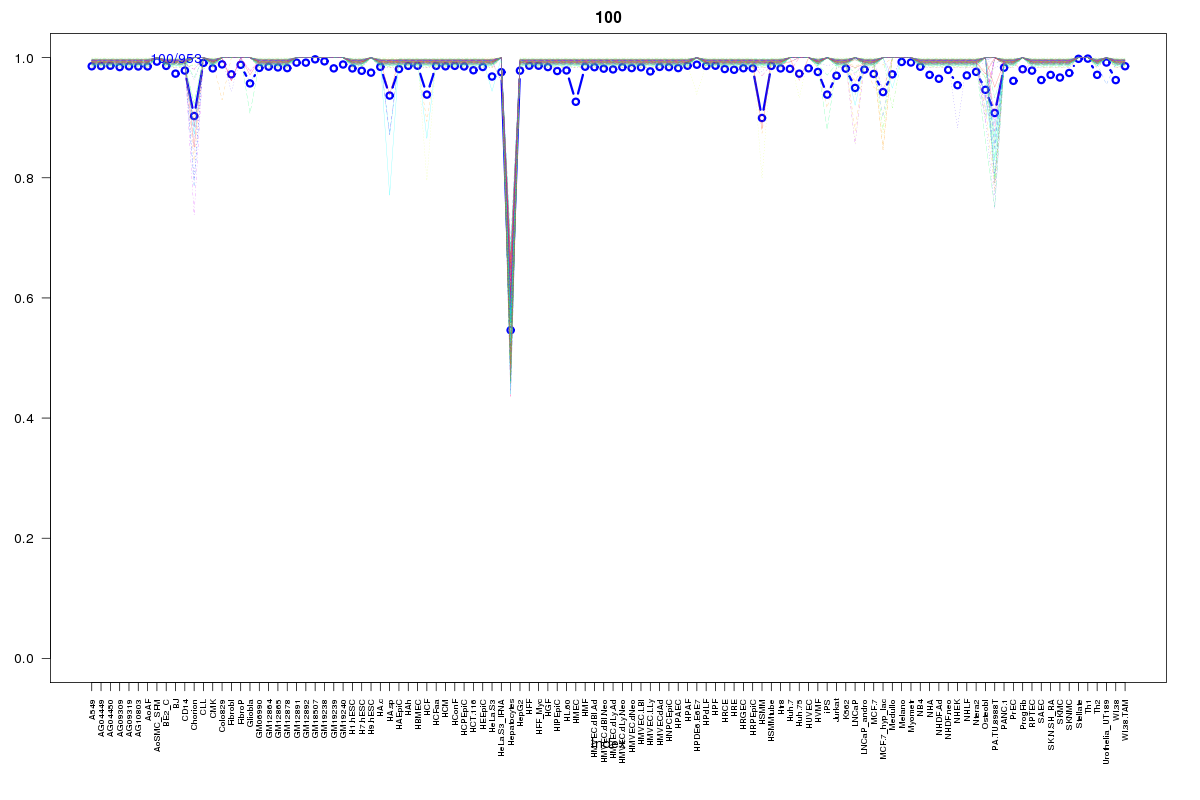 | 100 | 1 |
Resources
BED file downloads
Connects to 14 DHS sitesTop 10 Correlated DHS Sites
p-values indiciate significant higher or lower correlation| Location | Cluster | P-value |
|---|---|---|
| chr6:52830080-52830230 | 2055 | 0.008 |
| chr6:52746965-52747115 | 1901 | 0.018 |
| chr6:52769485-52769635 | 1658 | 0.018 |
| chr6:52859860-52860010 | 386 | 0.013 |
| chr6:52680540-52680690 | 2024 | 0.012 |
| chr6:52783240-52783390 | 2392 | 0.012 |
| chr6:52860280-52860430 | 337 | 0.011 |
| chr6:52860980-52861130 | 211 | 0.01 |
| chr6:52794200-52794350 | 545 | 0.009 |
| chr6:52861580-52861730 | 491 | 0.005 |
| chr6:52704560-52704710 | 240 | 0.005 |
External Databases
UCSCEnsembl (ENSG00000174156)