Gene: GOLIM4
chr3: 167726464-167813763Expression Profile
(log scale)
Graphical Connections
Distribution of linked clusters:
You may find it interesting if many of the connected DHS sites belong to the same cluster.| Cluster Profile | Cluster ID | Number of DHS sites in this cluster |
|---|---|---|
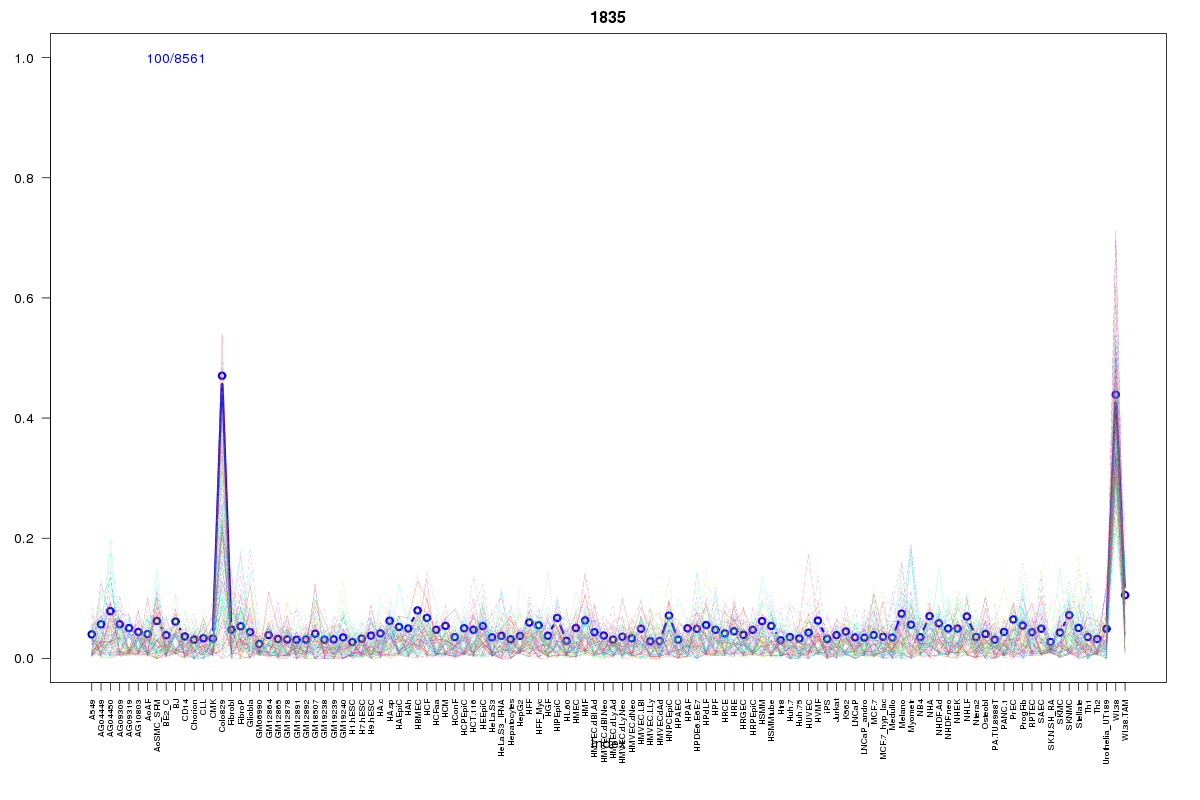 | 1835 | 3 |
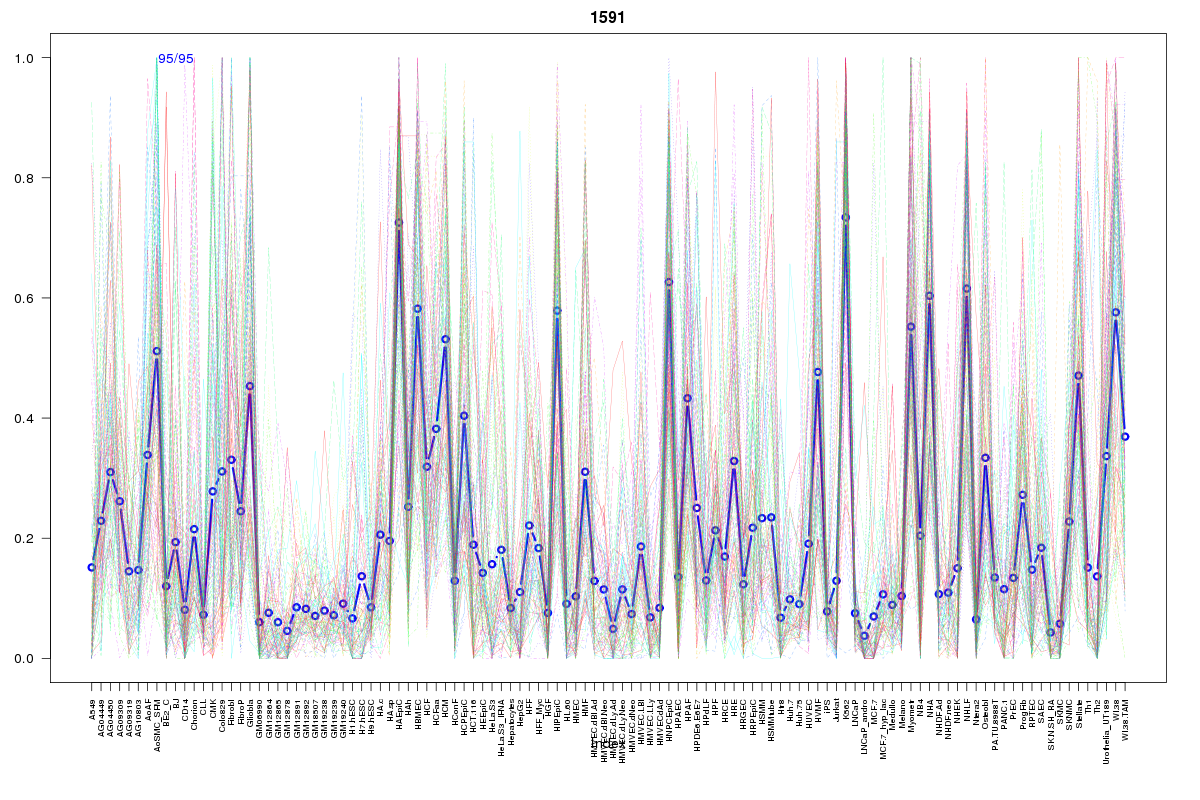 | 1591 | 1 |
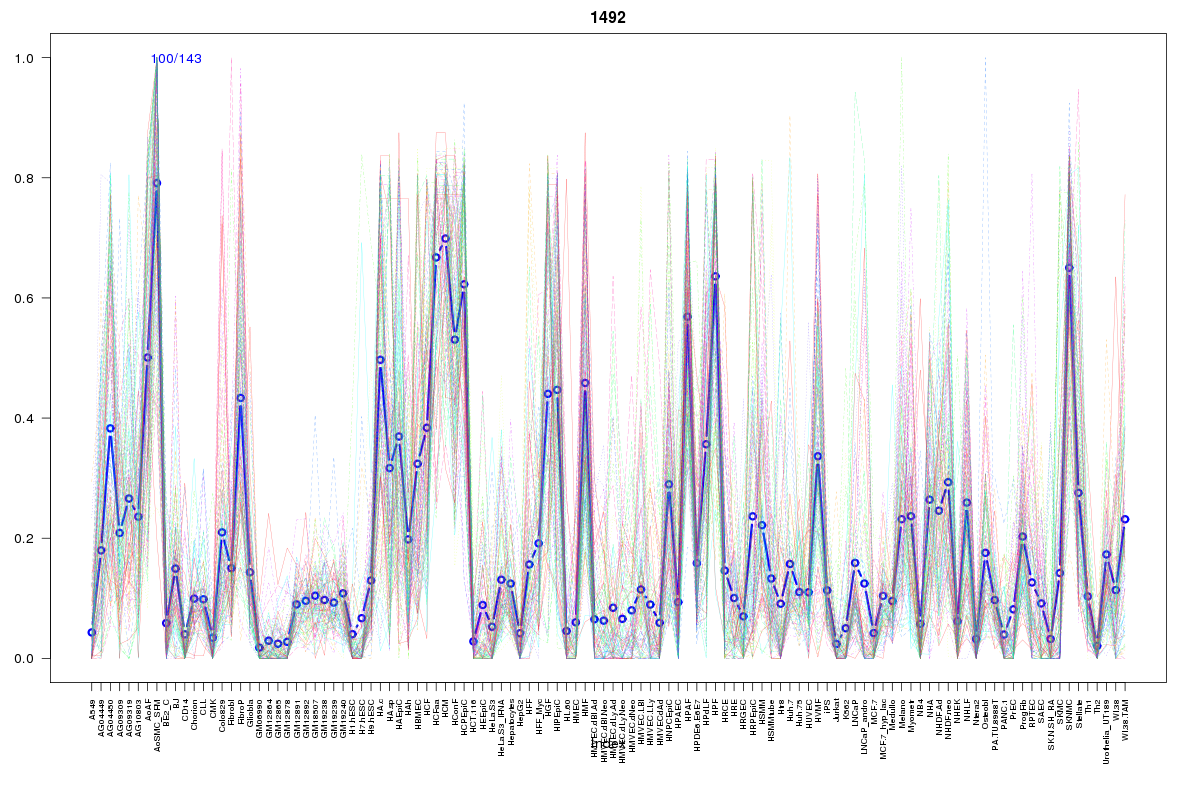 | 1492 | 1 |
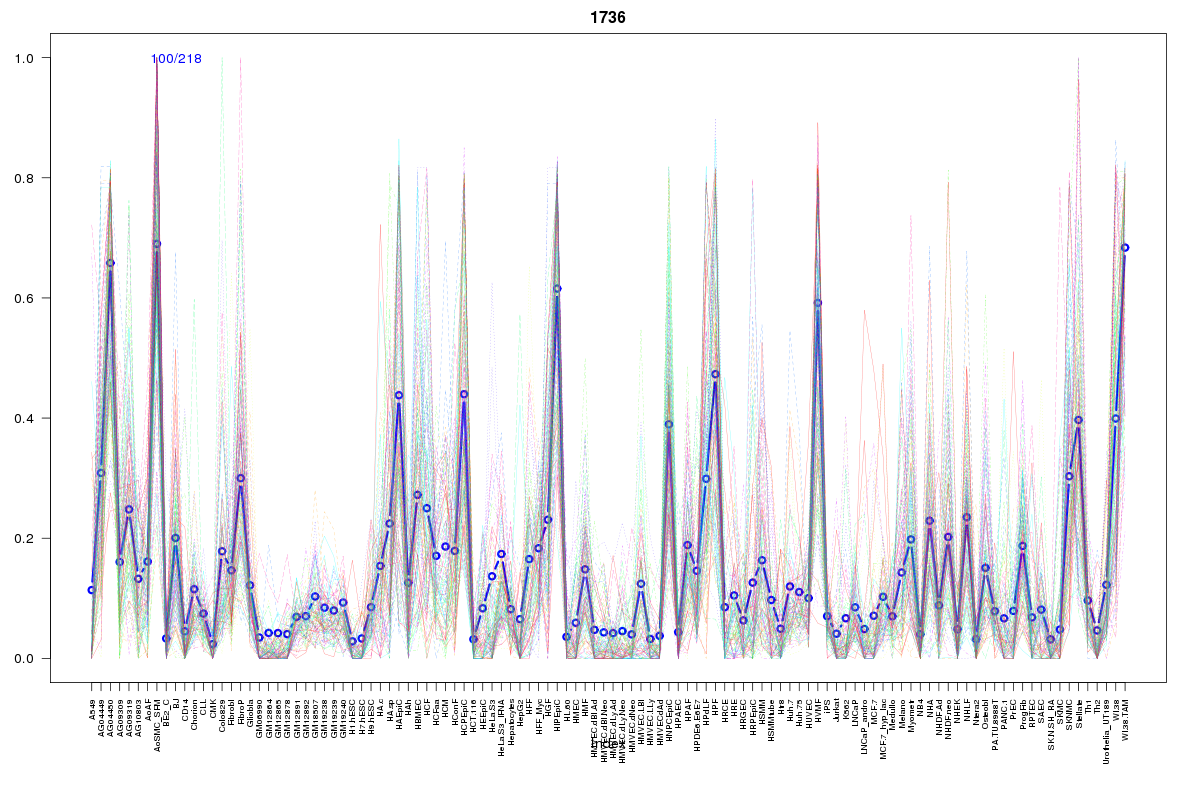 | 1736 | 1 |
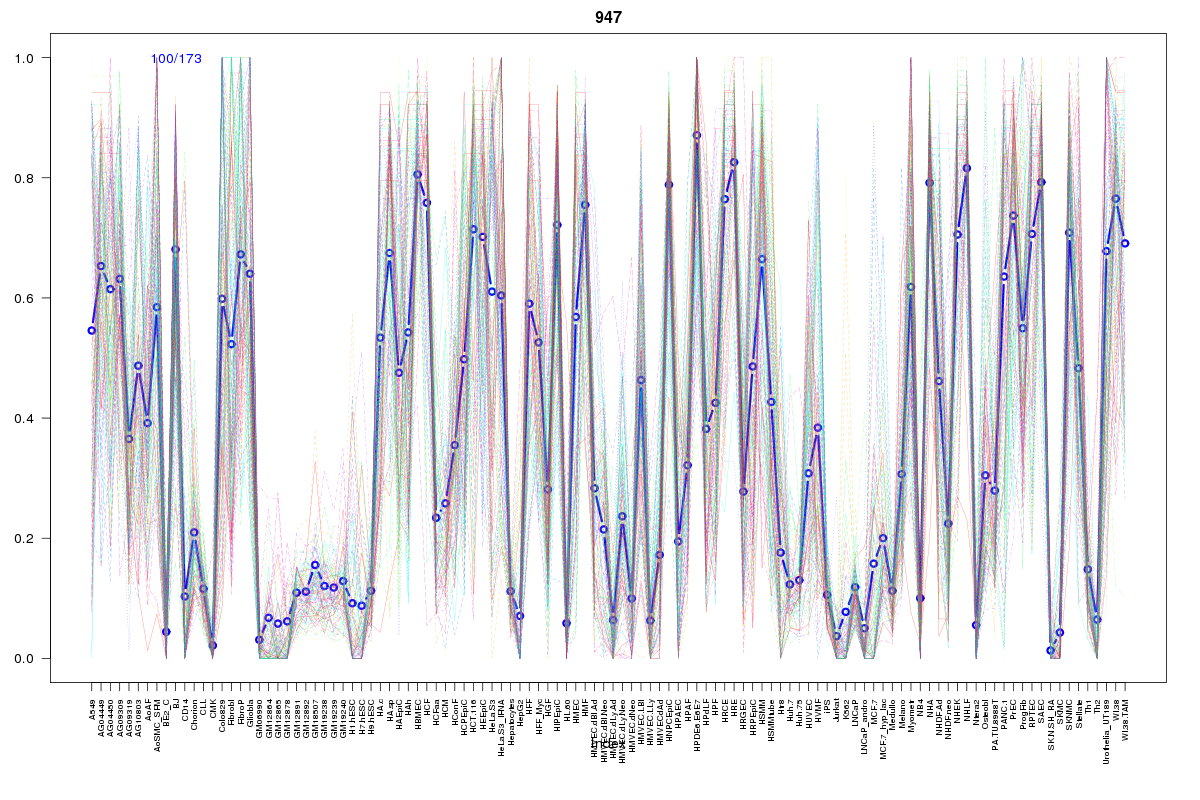 | 947 | 1 |
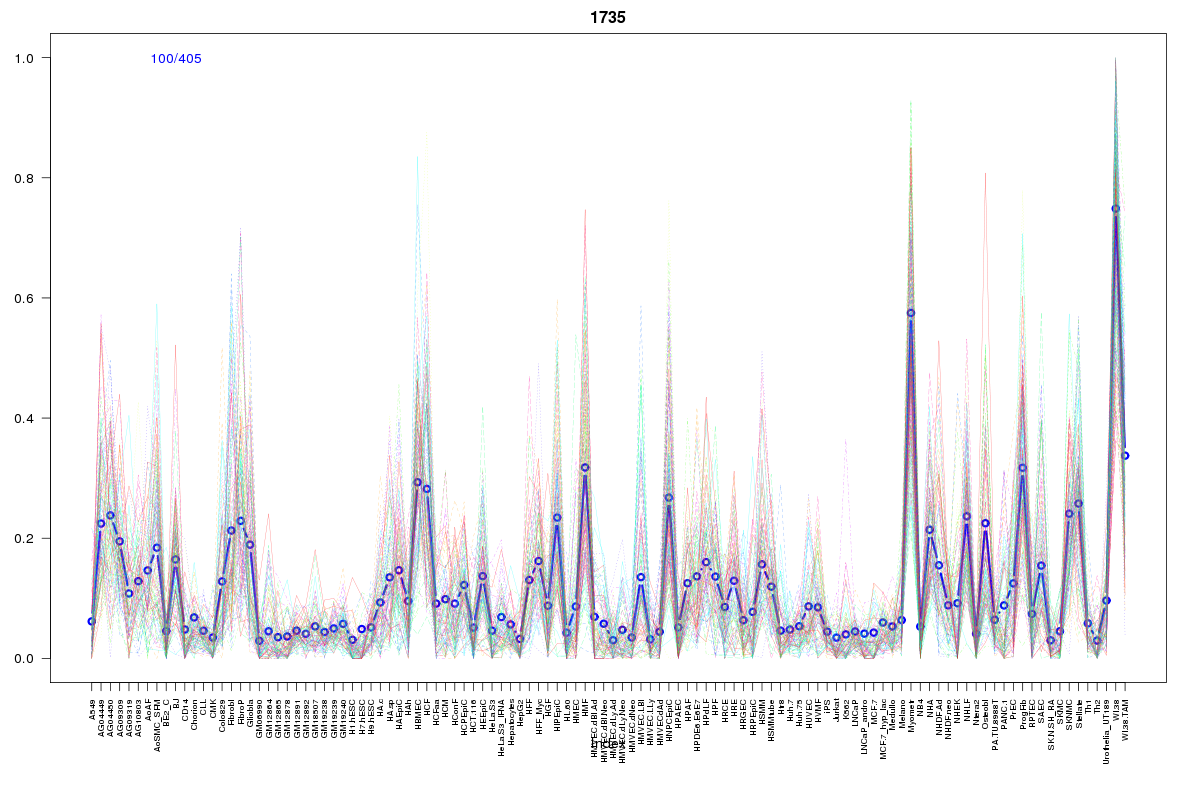 | 1735 | 1 |
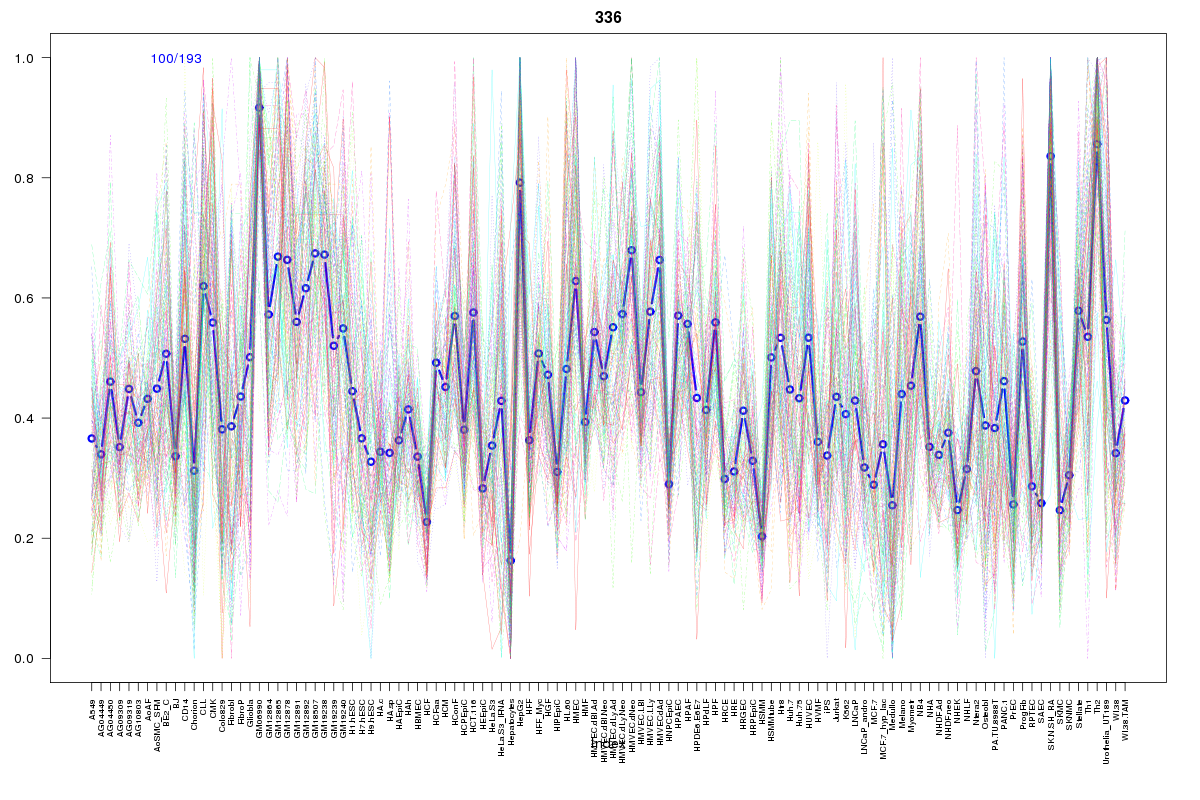 | 336 | 1 |
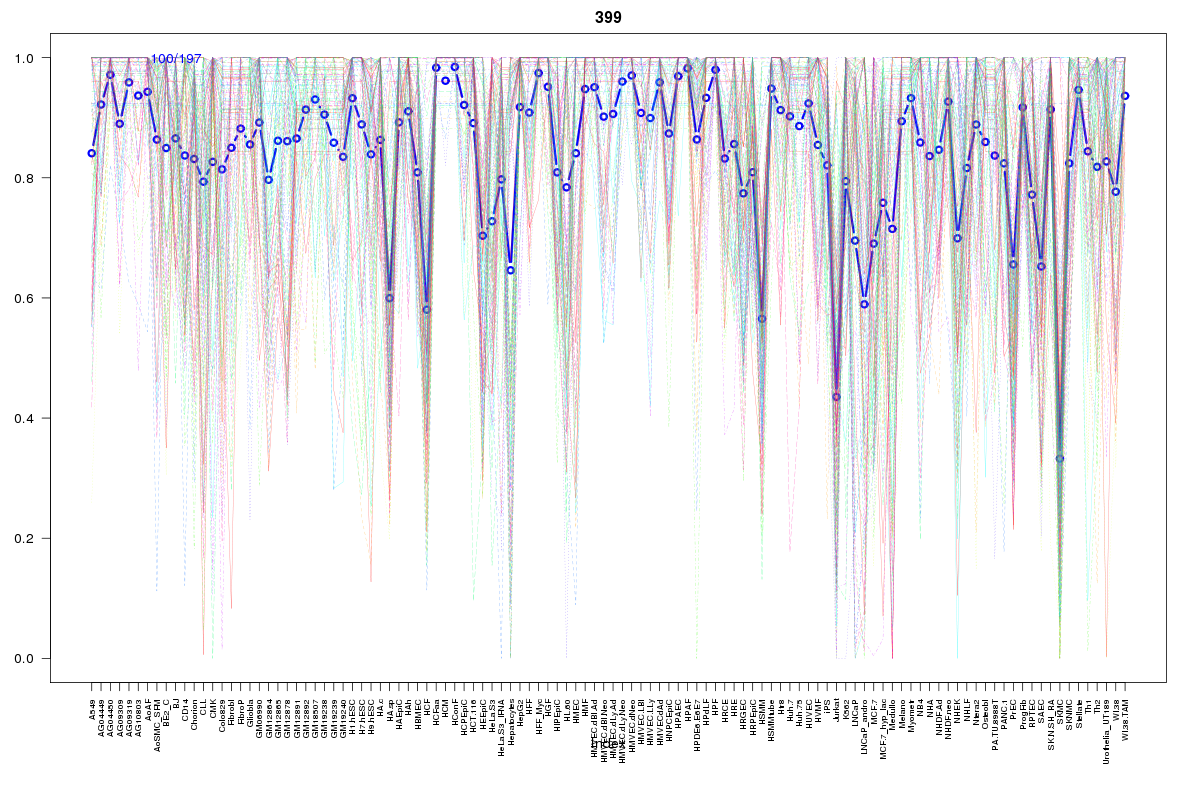 | 399 | 1 |
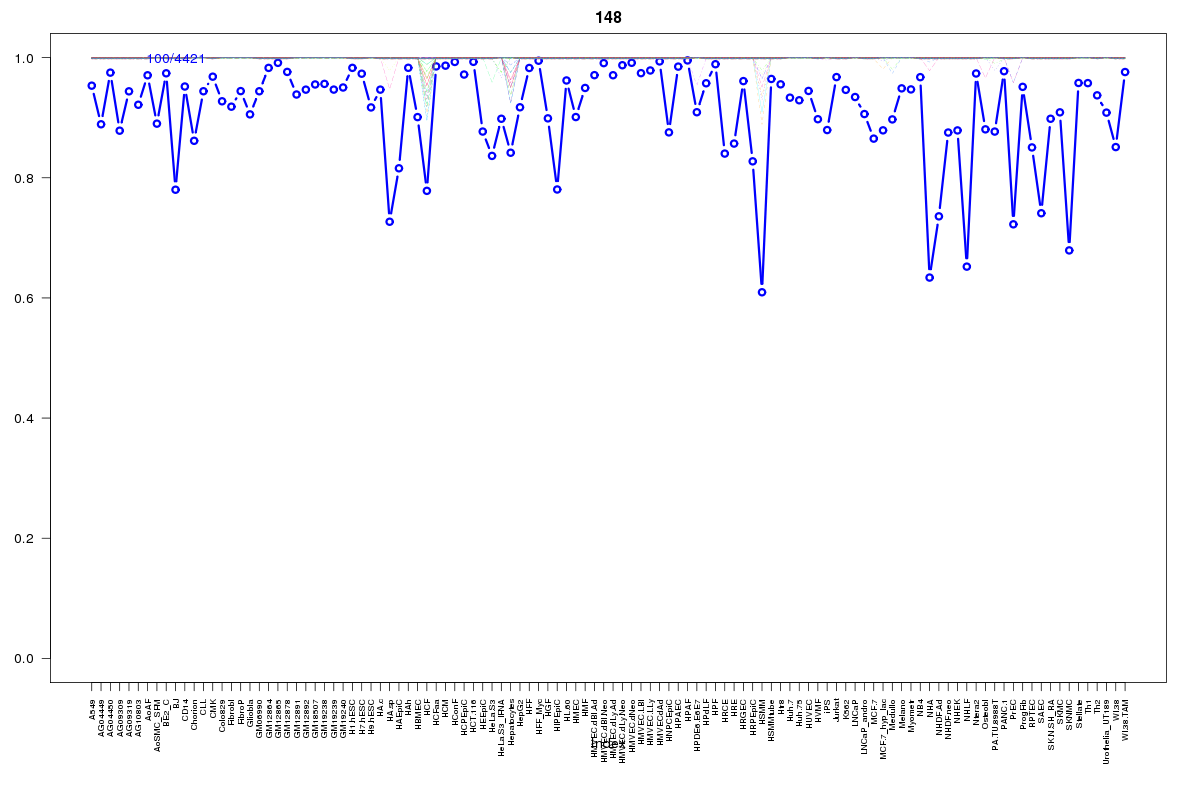 | 148 | 1 |
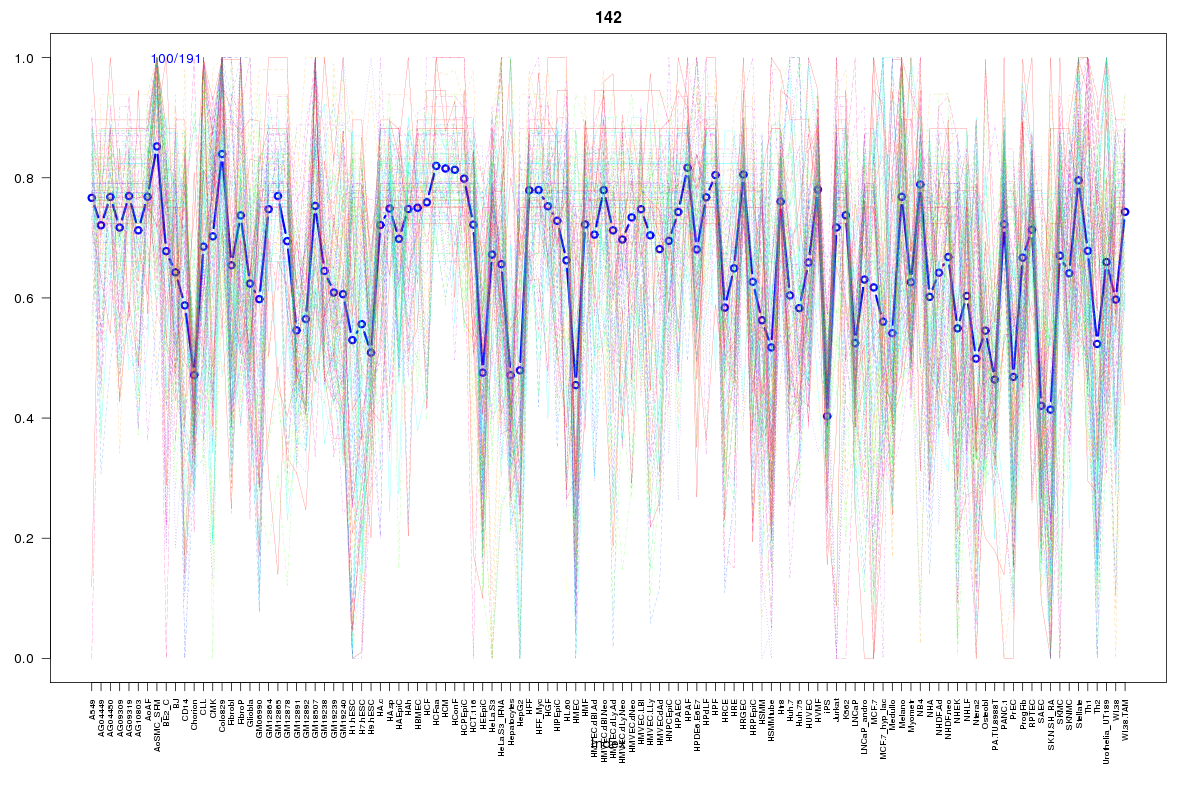 | 142 | 1 |
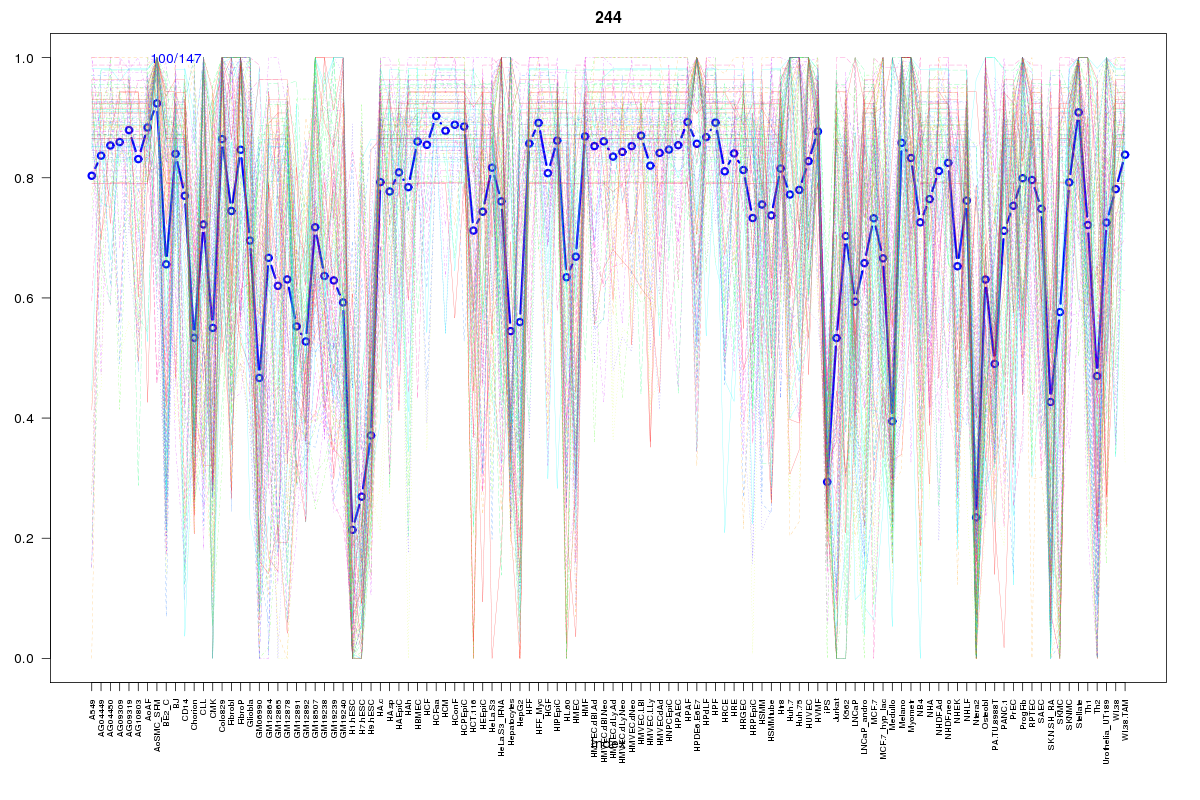 | 244 | 1 |
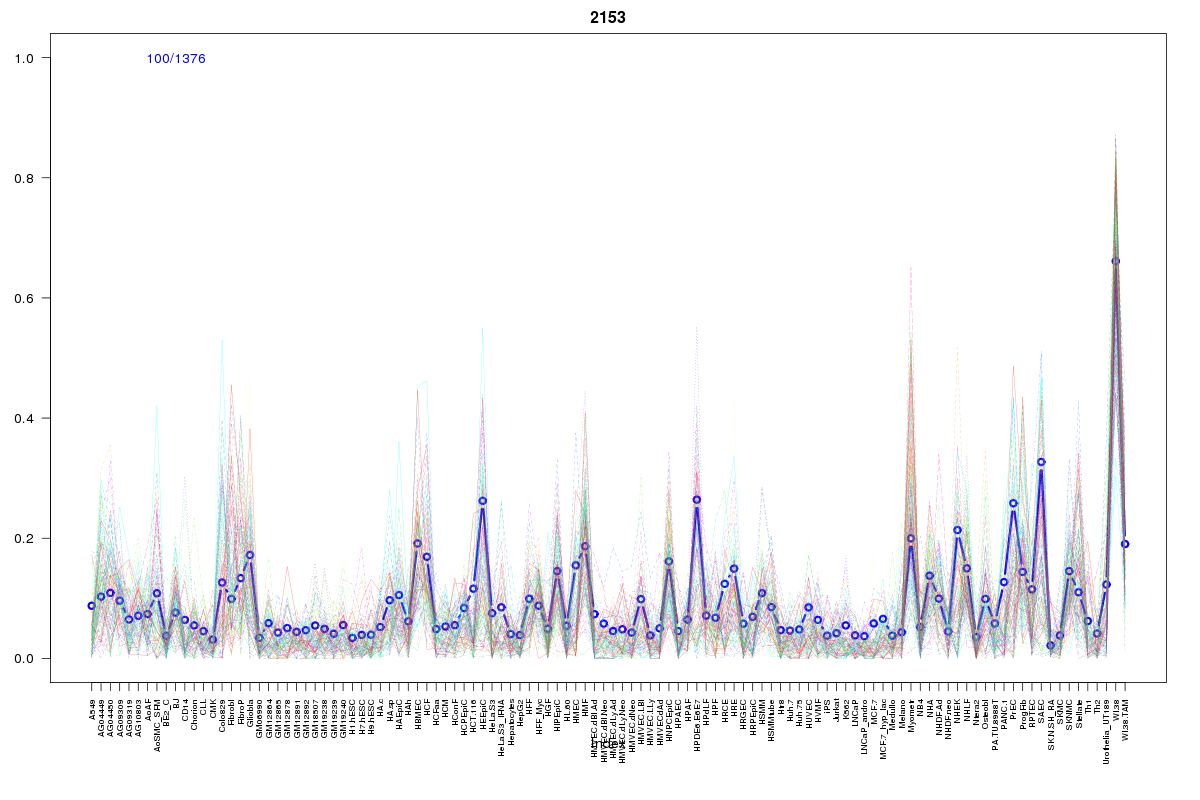 | 2153 | 1 |
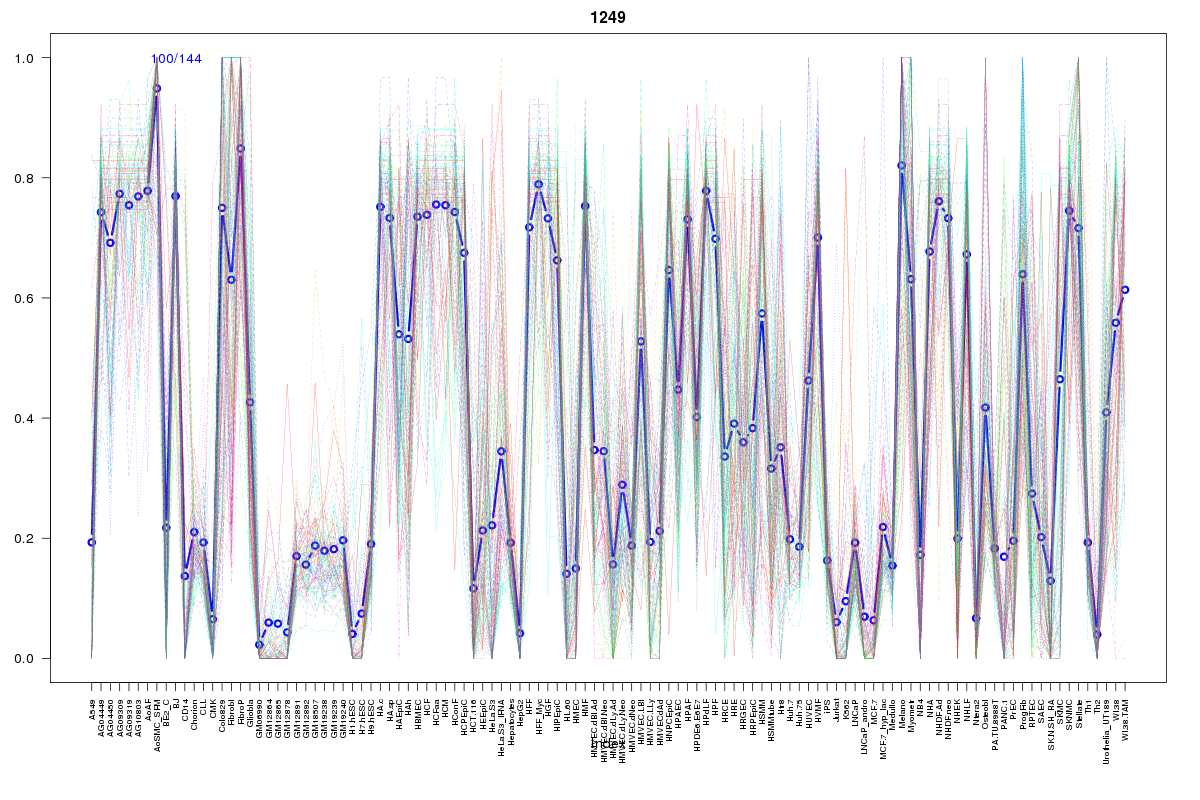 | 1249 | 1 |
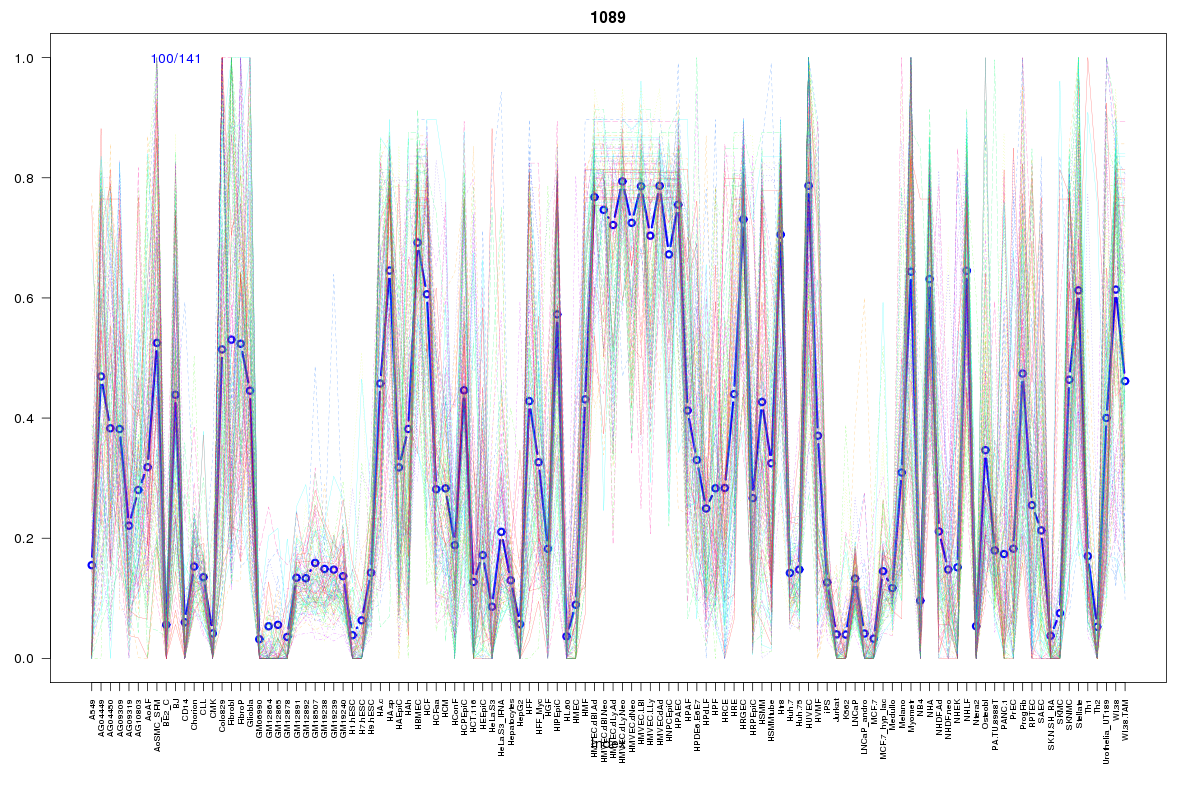 | 1089 | 1 |
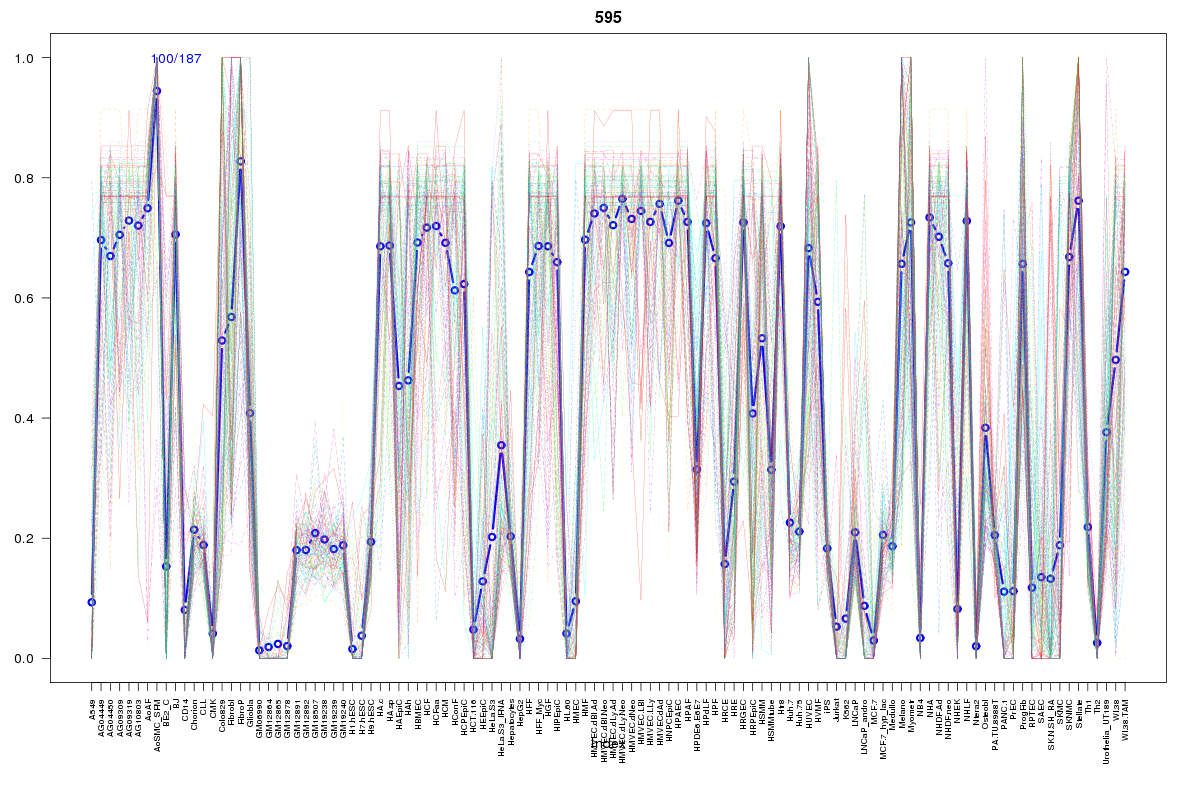 | 595 | 1 |
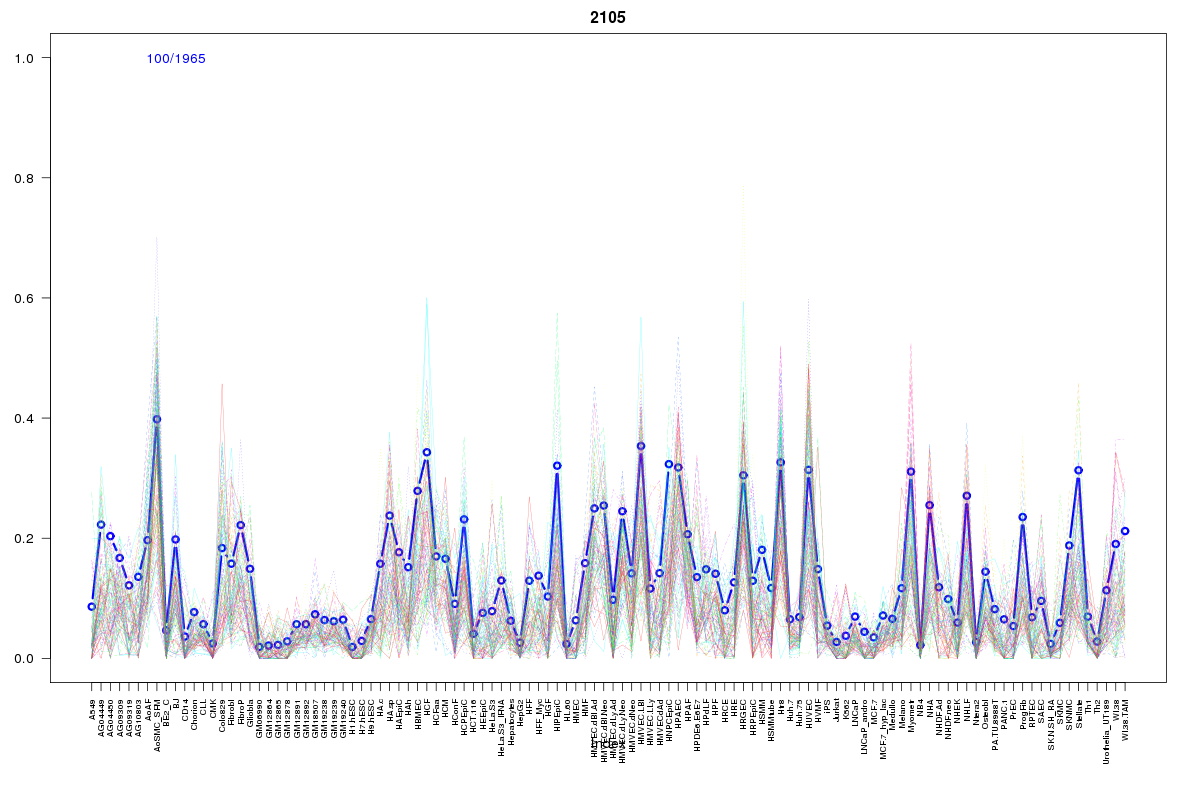 | 2105 | 1 |
Resources
BED file downloads
Connects to 18 DHS sitesTop 10 Correlated DHS Sites
p-values indiciate significant higher or lower correlation| Location | Cluster | P-value |
|---|---|---|
| chr3:167814260-167814410 | 244 | 0 |
| chr3:167813800-167813950 | 148 | 0 |
| chr3:167813640-167813790 | 399 | 0.004 |
| chr3:167789440-167789590 | 947 | 0.005 |
| chr3:167752060-167752210 | 1591 | 0.005 |
| chr3:167743000-167743150 | 2105 | 0.007 |
| chr3:167799320-167799470 | 1735 | 0.008 |
| chr3:167818700-167818850 | 1835 | 0.009 |
| chr3:167814000-167814150 | 142 | 0.009 |
| chr3:167819040-167819190 | 2153 | 0.009 |
| chr3:167742540-167742690 | 595 | 0.009 |
External Databases
UCSCEnsembl (ENSG00000173905)