Gene: ECEL1
chr2: 233344536-233352538Expression Profile
(log scale)
Graphical Connections
Distribution of linked clusters:
You may find it interesting if many of the connected DHS sites belong to the same cluster.| Cluster Profile | Cluster ID | Number of DHS sites in this cluster |
|---|---|---|
 | 1008 | 10 |
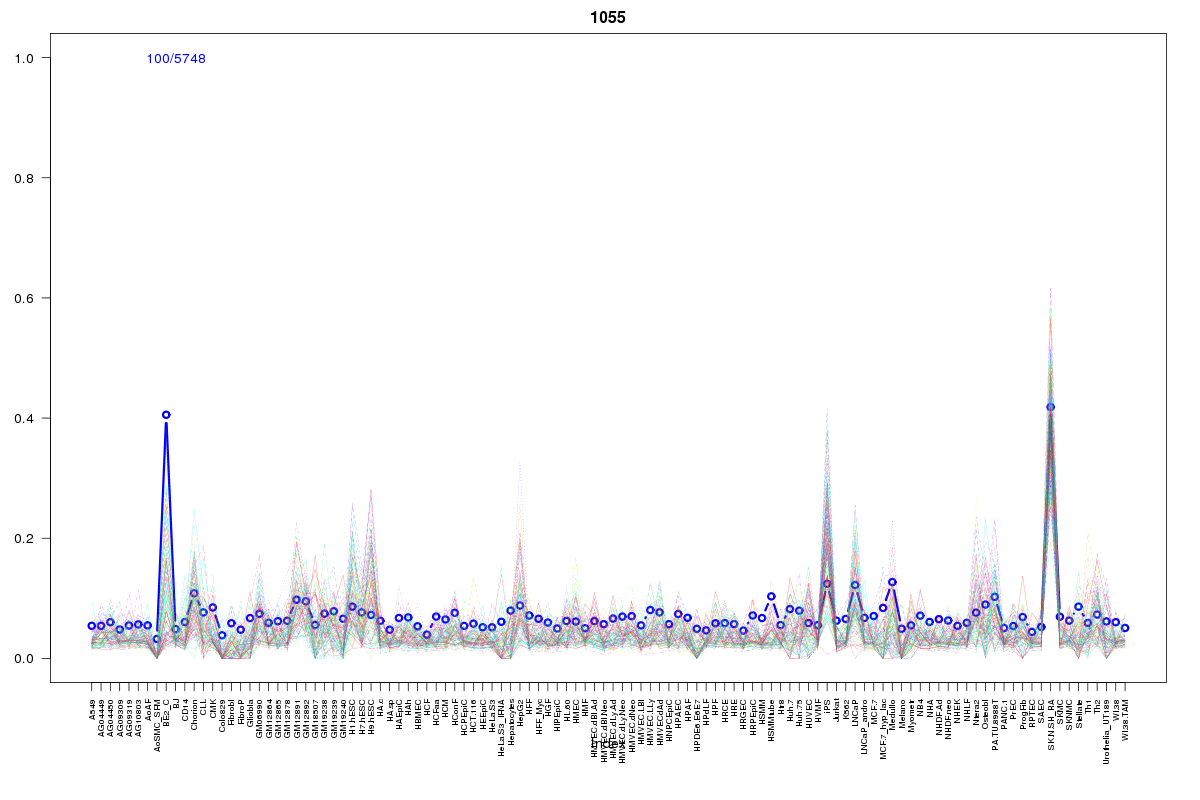 | 1055 | 4 |
 | 570 | 3 |
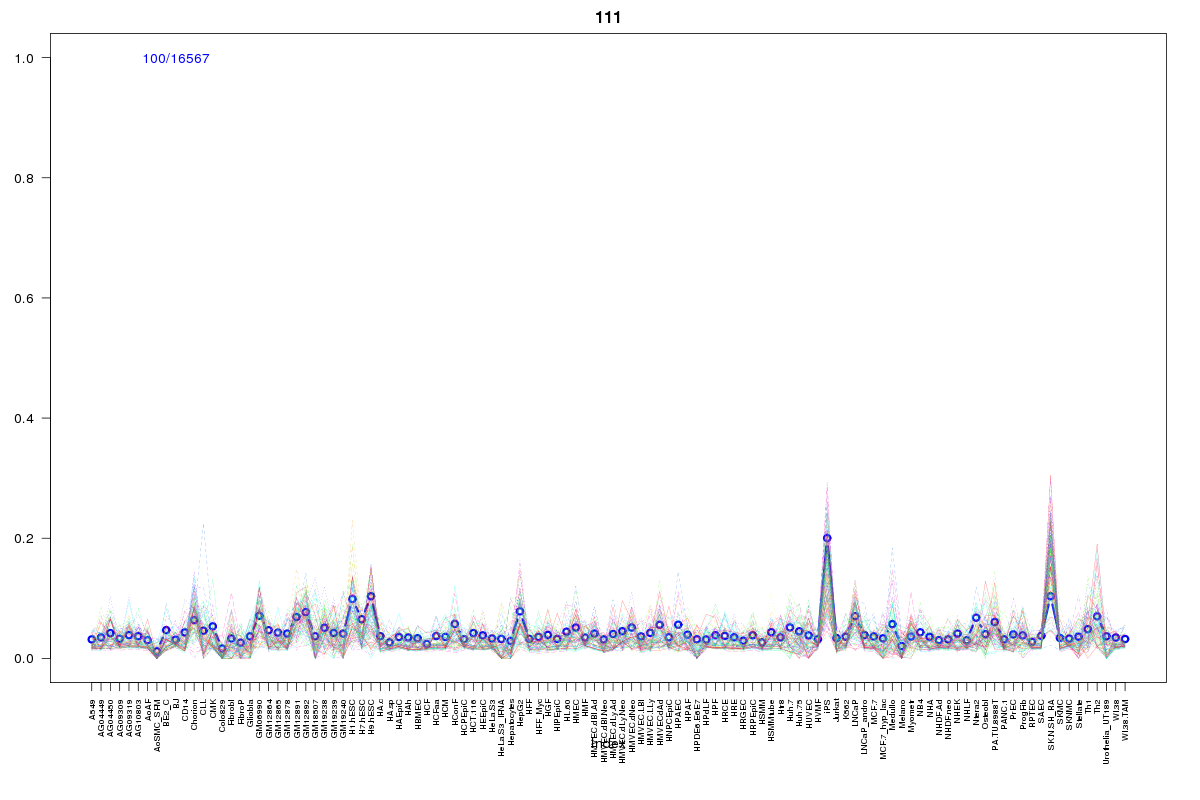 | 111 | 2 |
 | 770 | 2 |
 | 568 | 2 |
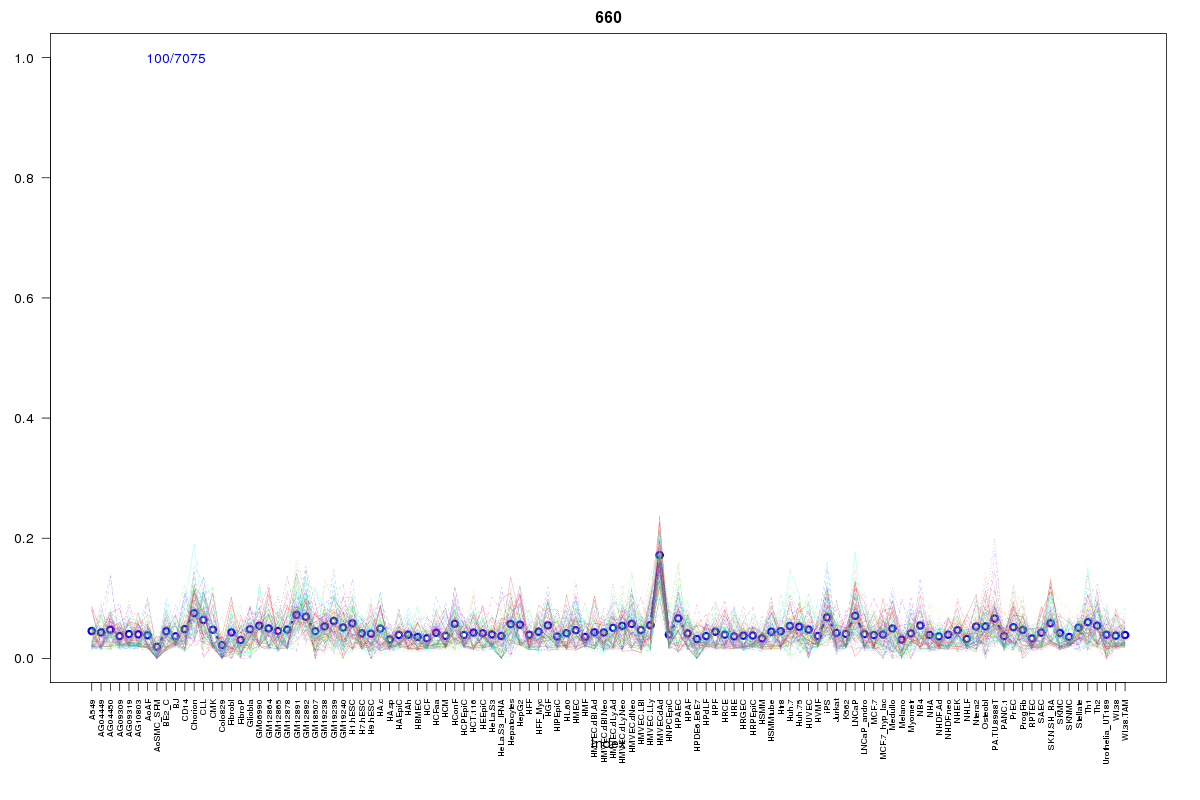 | 660 | 2 |
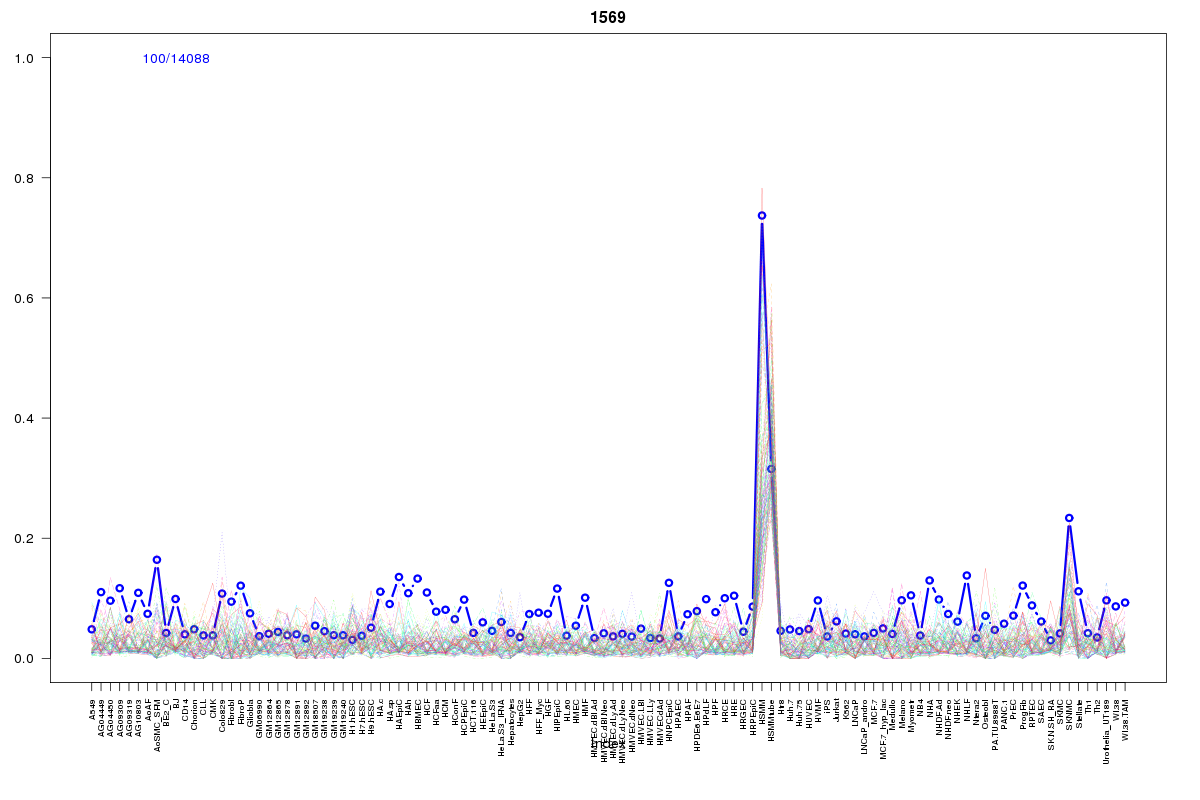 | 1569 | 1 |
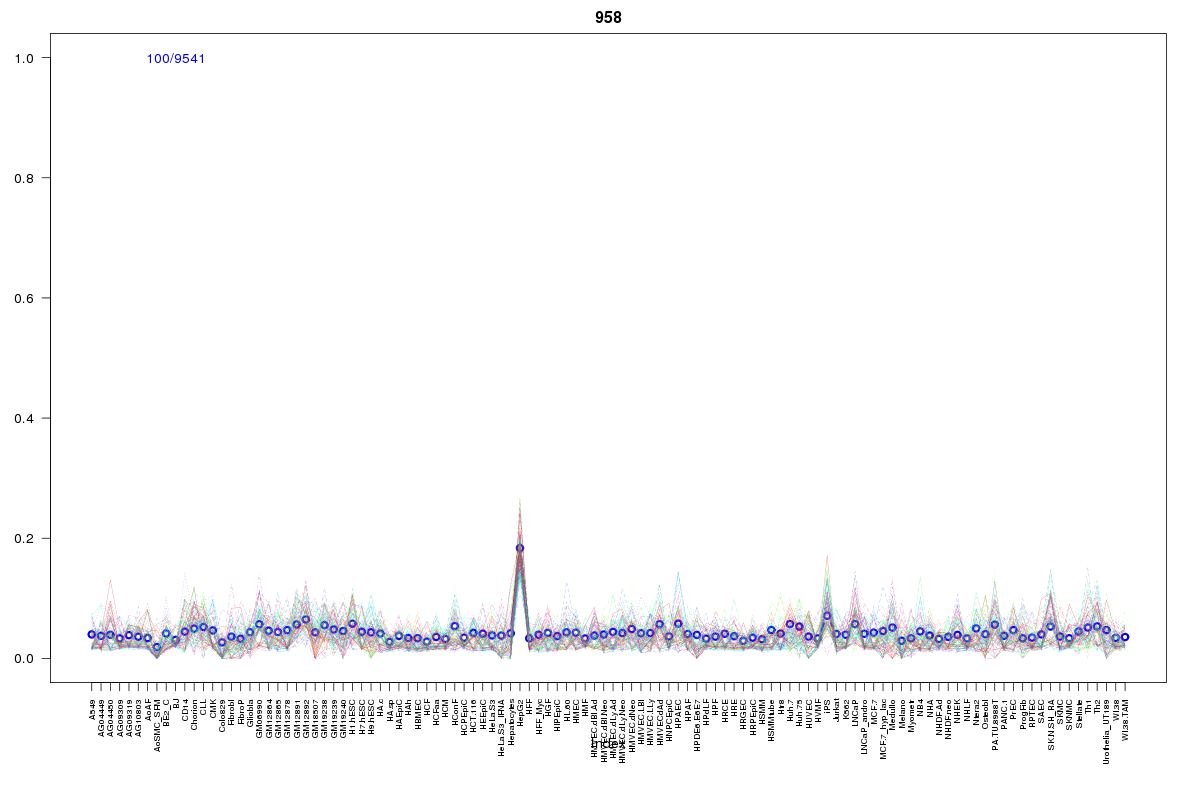 | 958 | 1 |
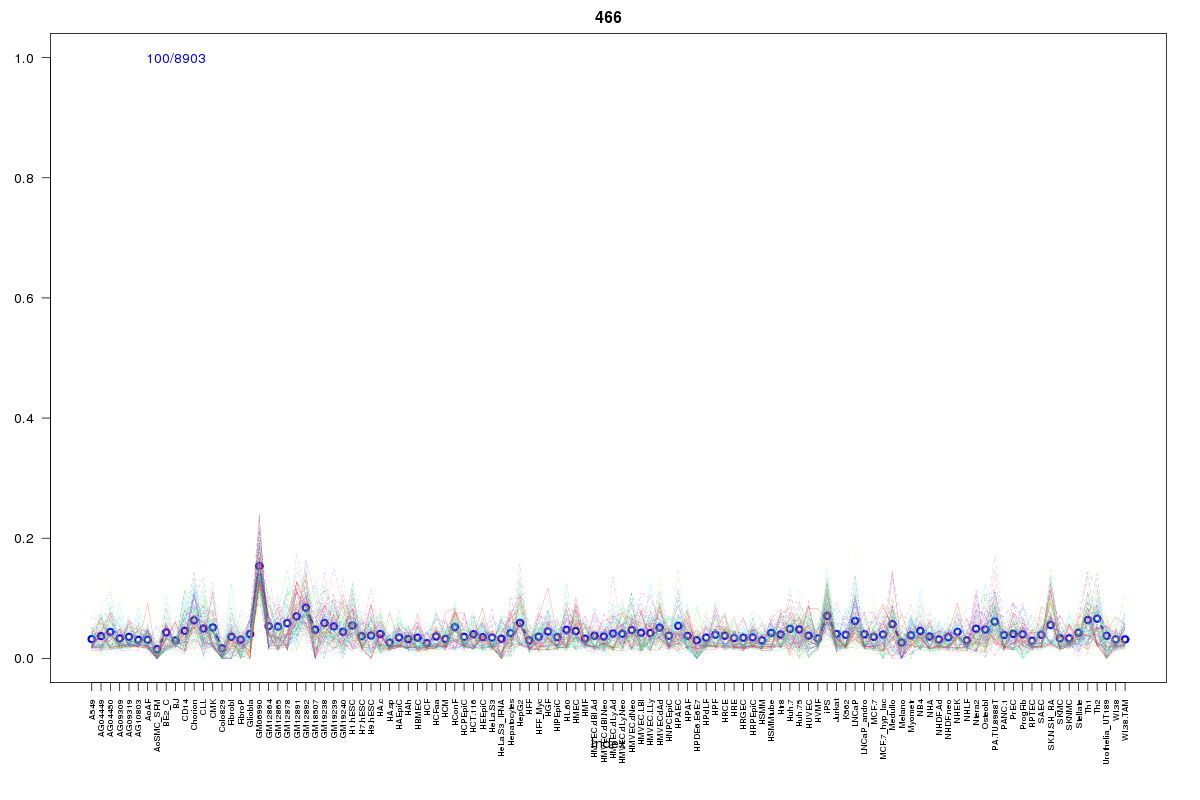 | 466 | 1 |
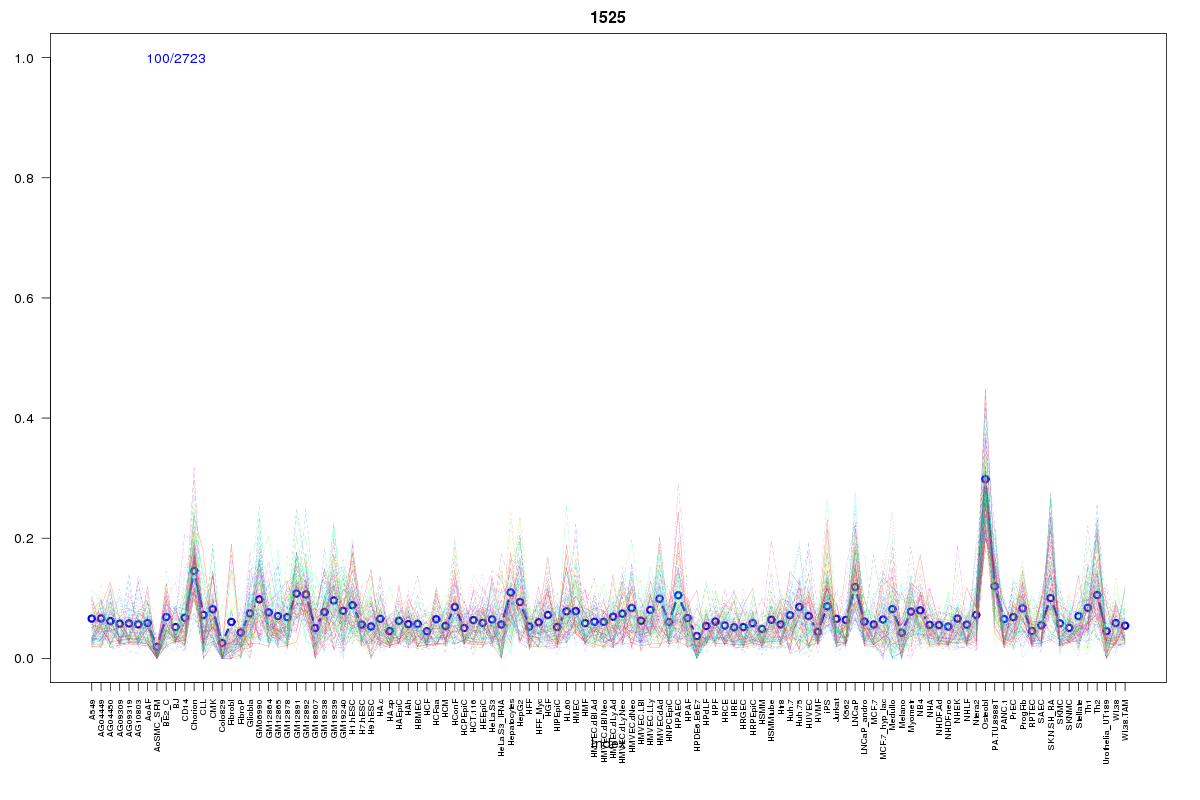 | 1525 | 1 |
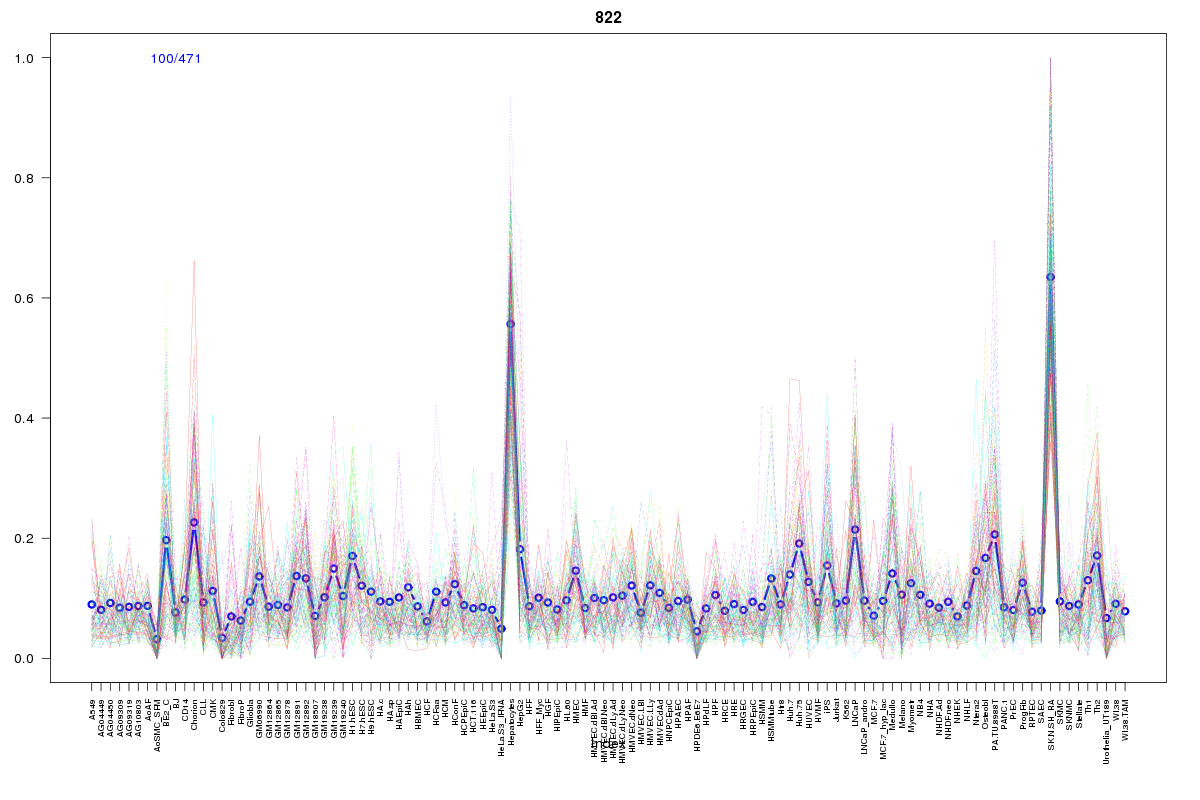 | 822 | 1 |
 | 862 | 1 |
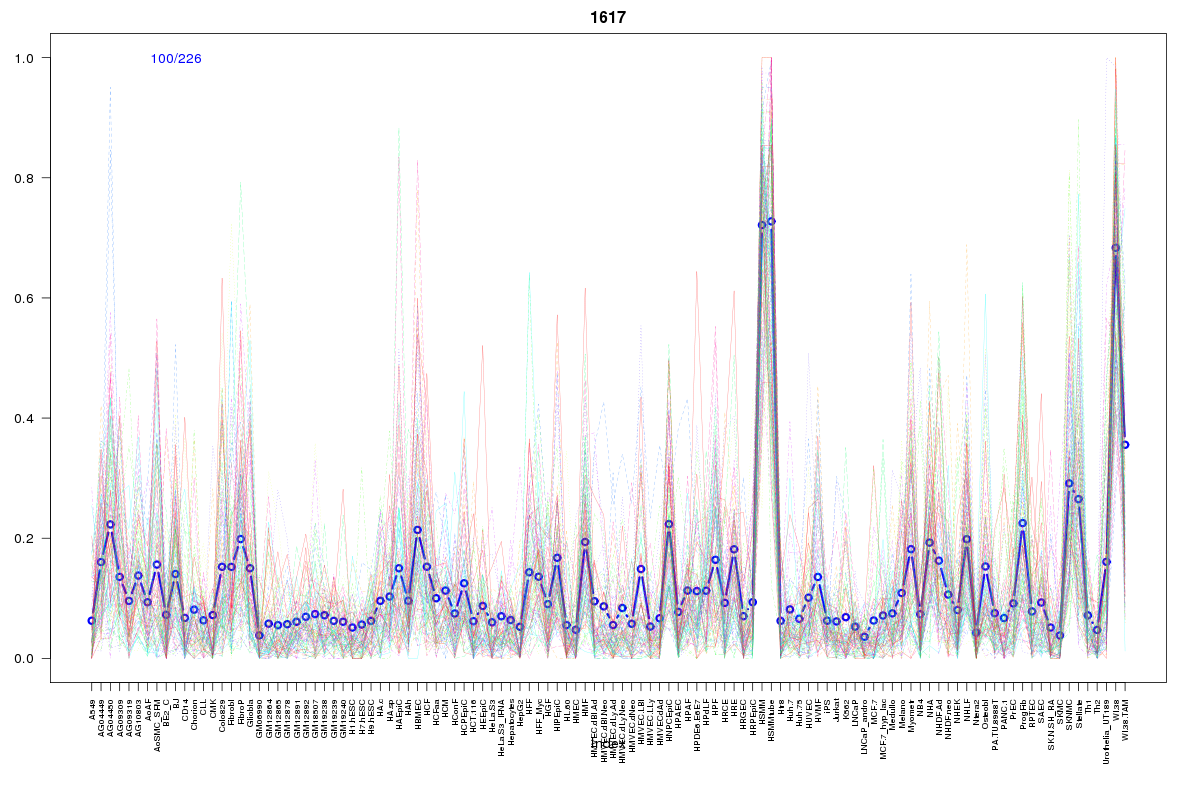 | 1617 | 1 |
 | 1078 | 1 |
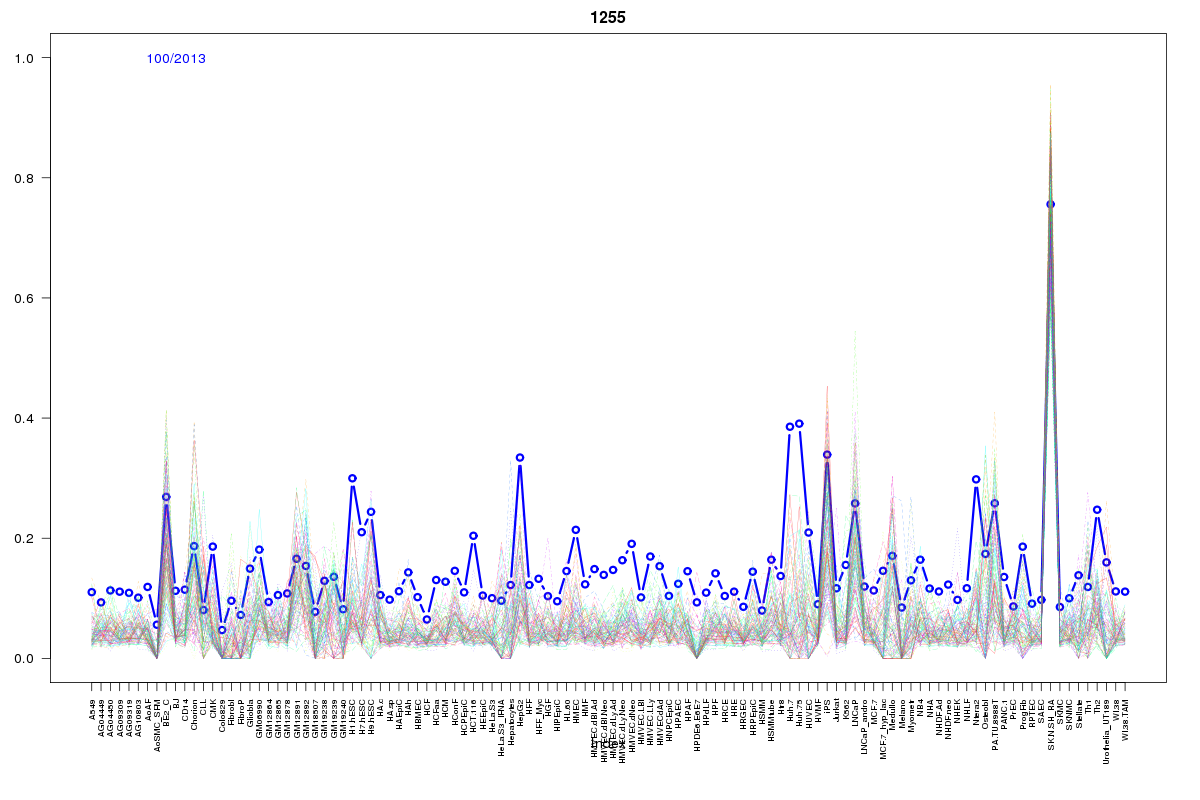 | 1255 | 1 |
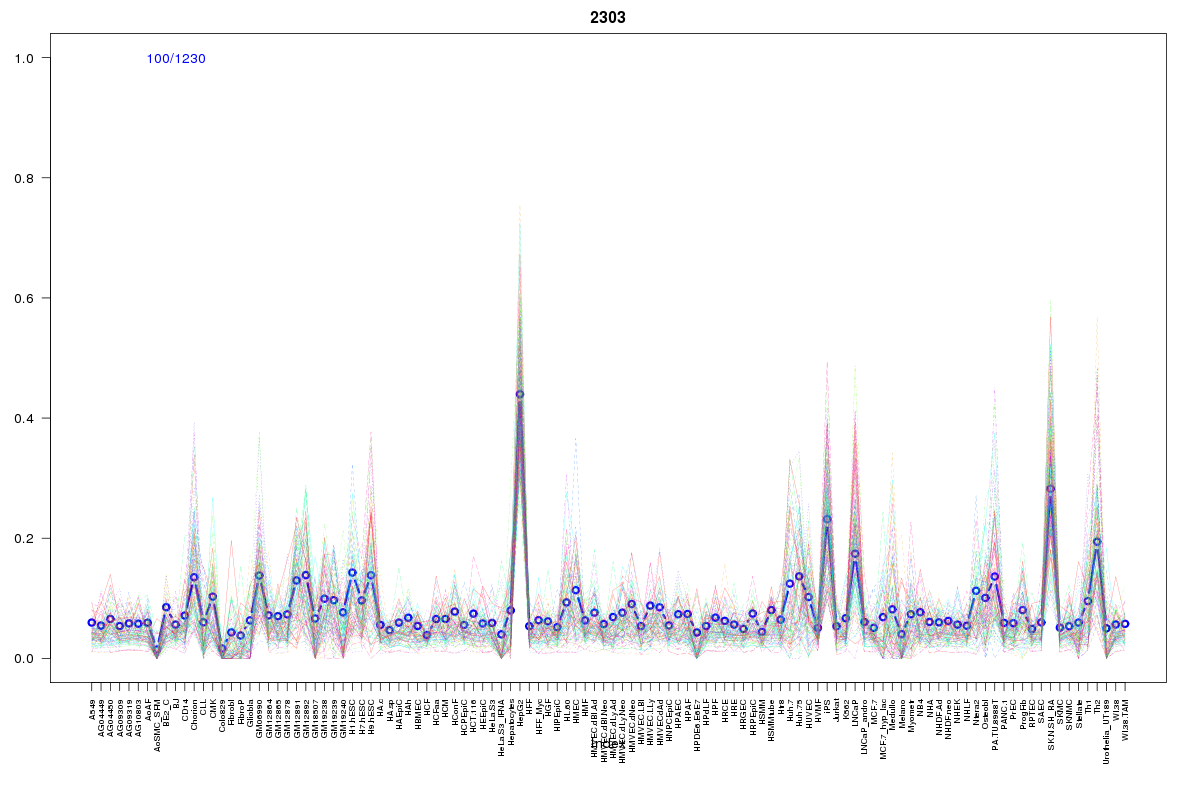 | 2303 | 1 |
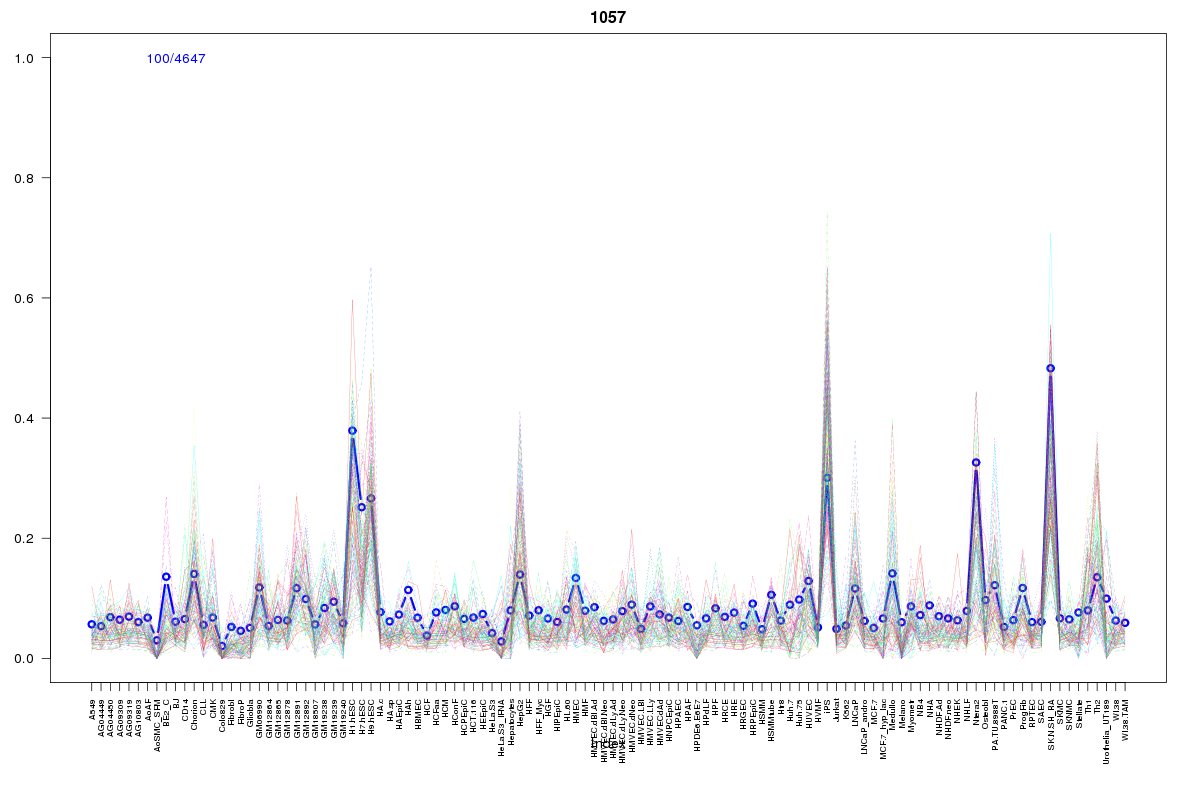 | 1057 | 1 |
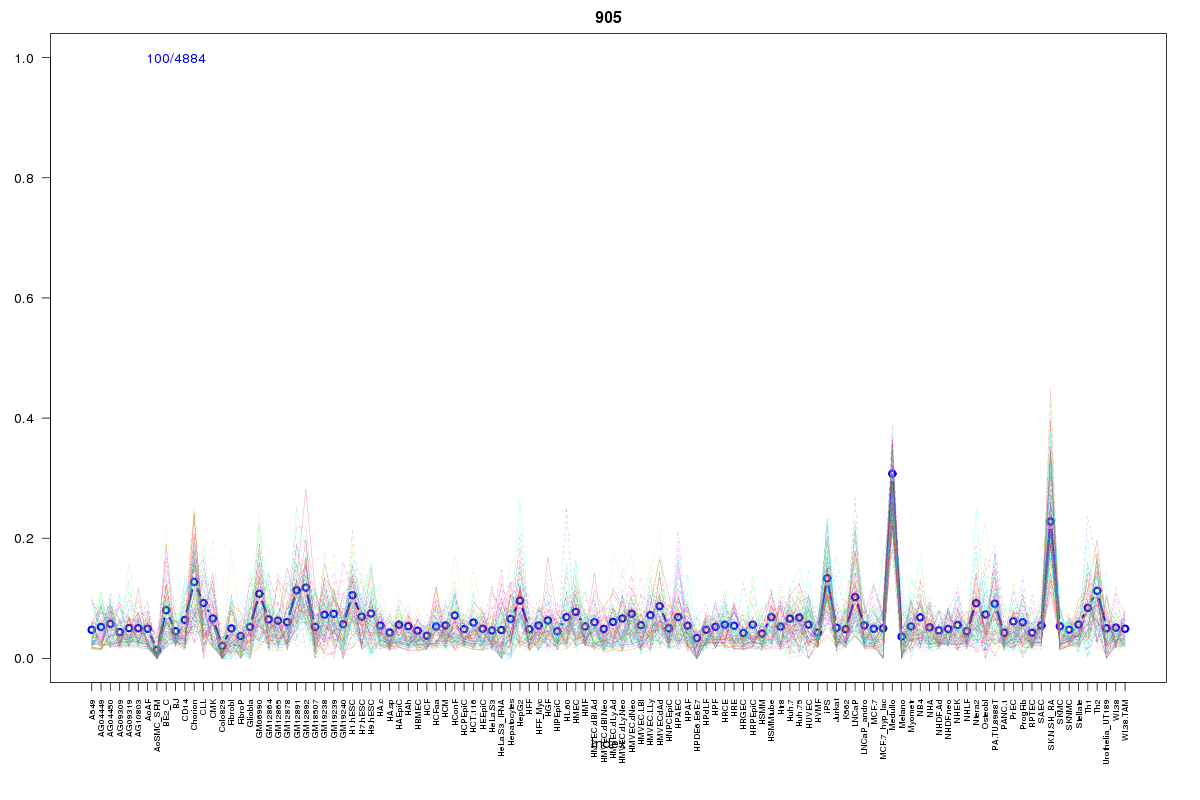 | 905 | 1 |
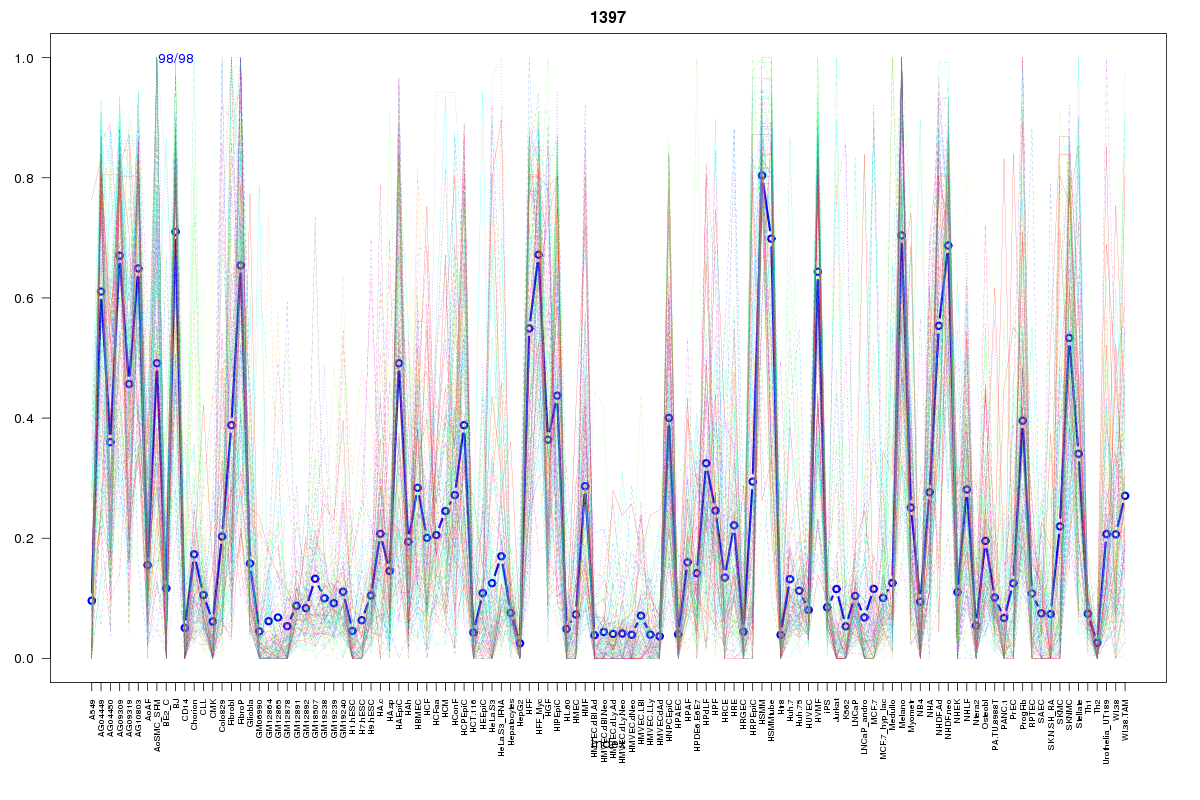 | 1397 | 1 |
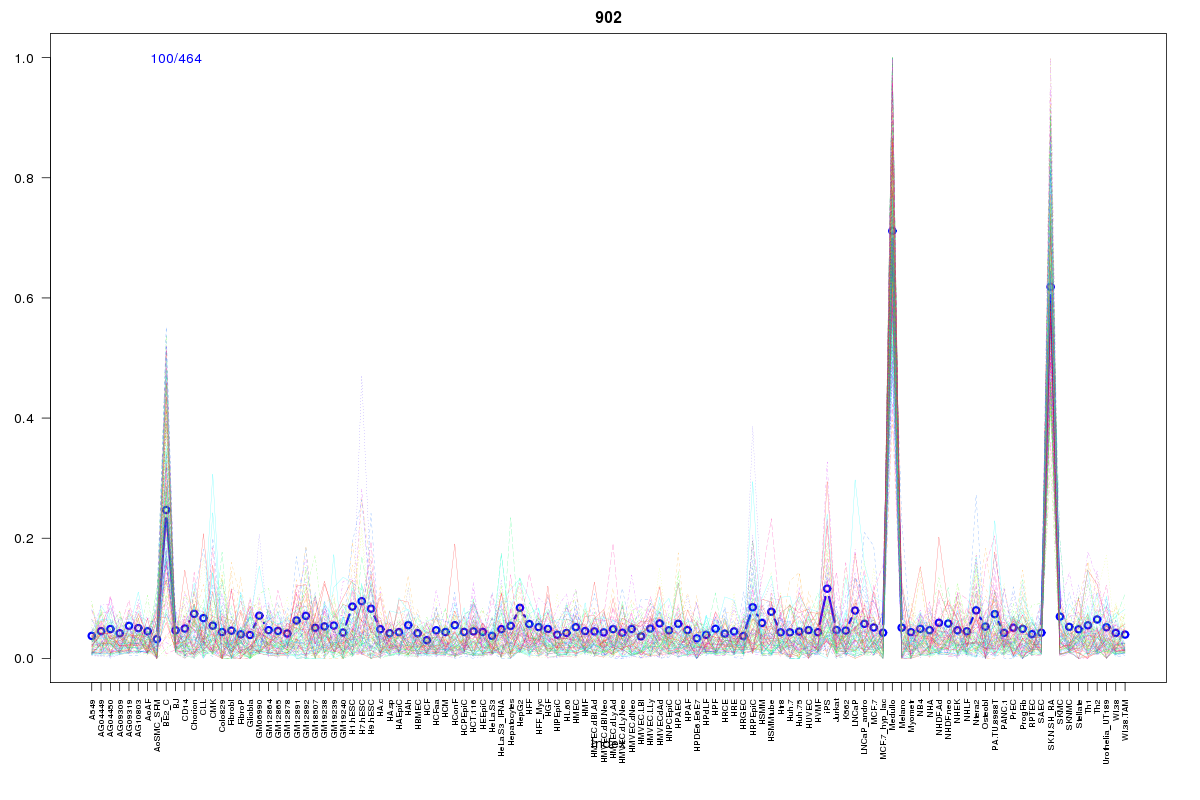 | 902 | 1 |
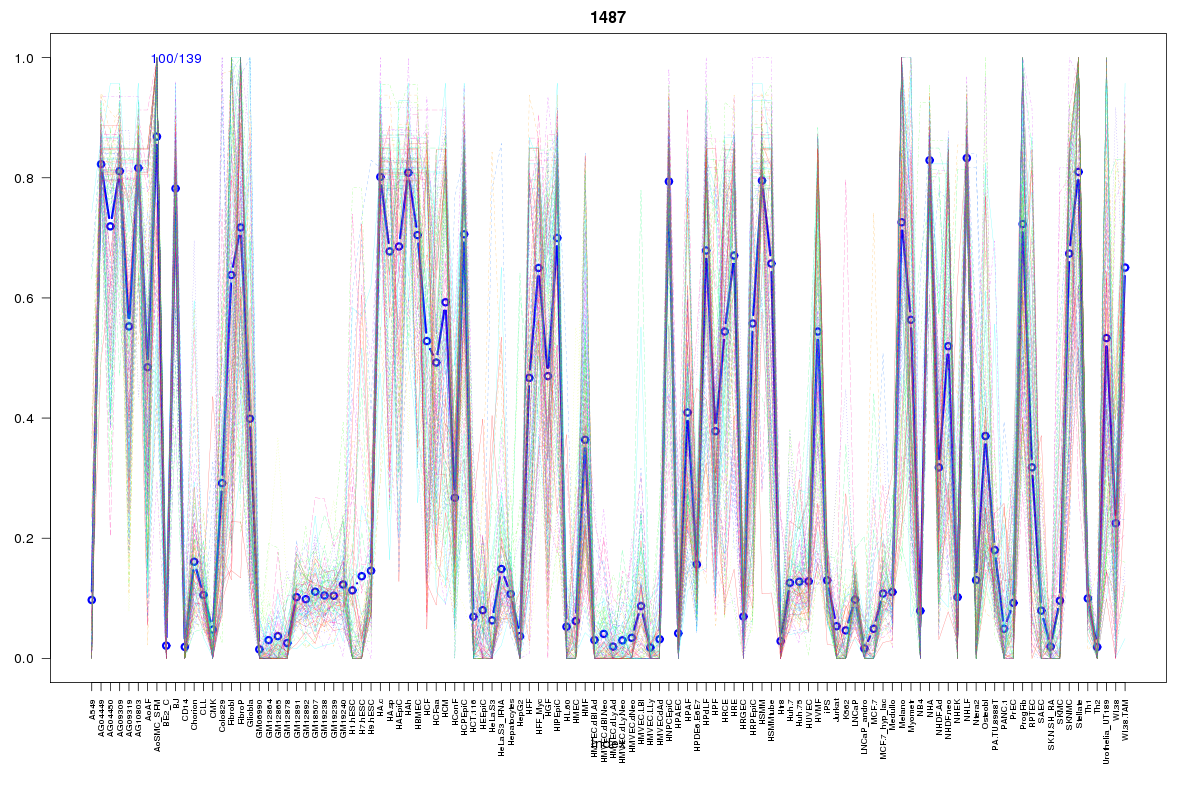 | 1487 | 1 |
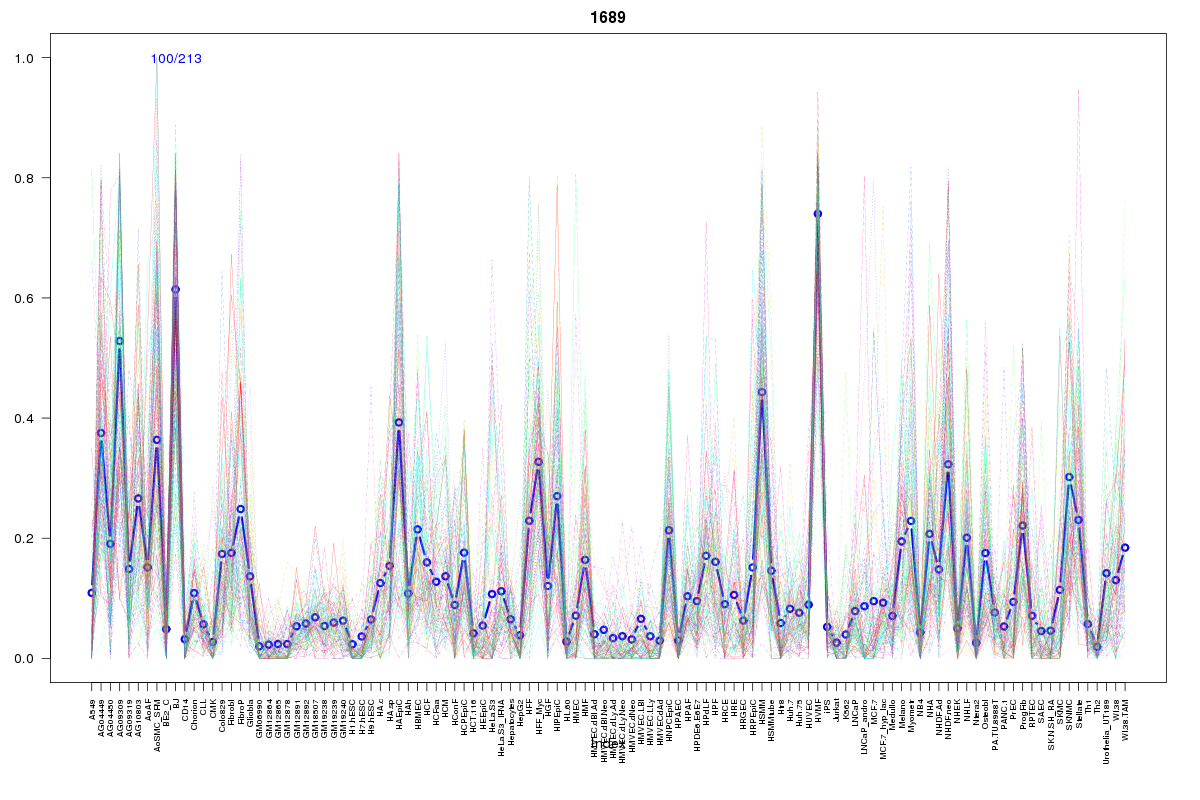 | 1689 | 1 |
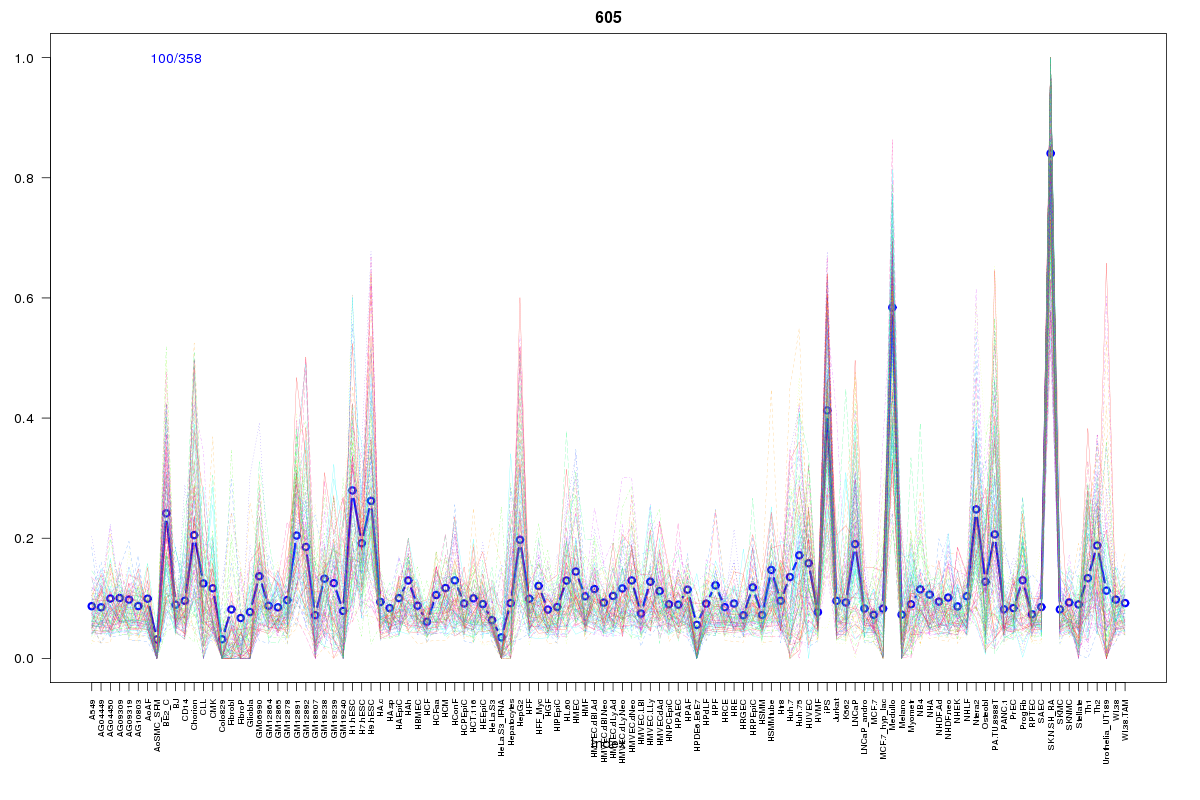 | 605 | 1 |
 | 860 | 1 |
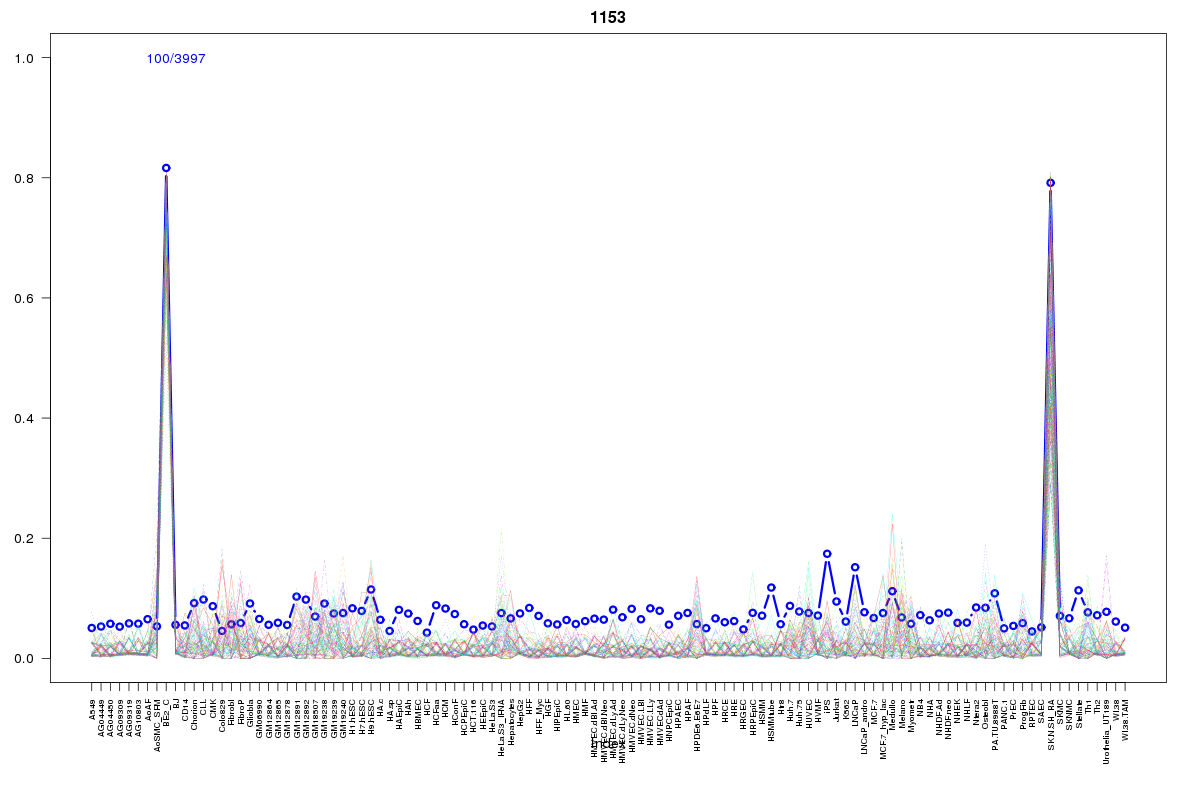 | 1153 | 1 |
 | 2055 | 1 |
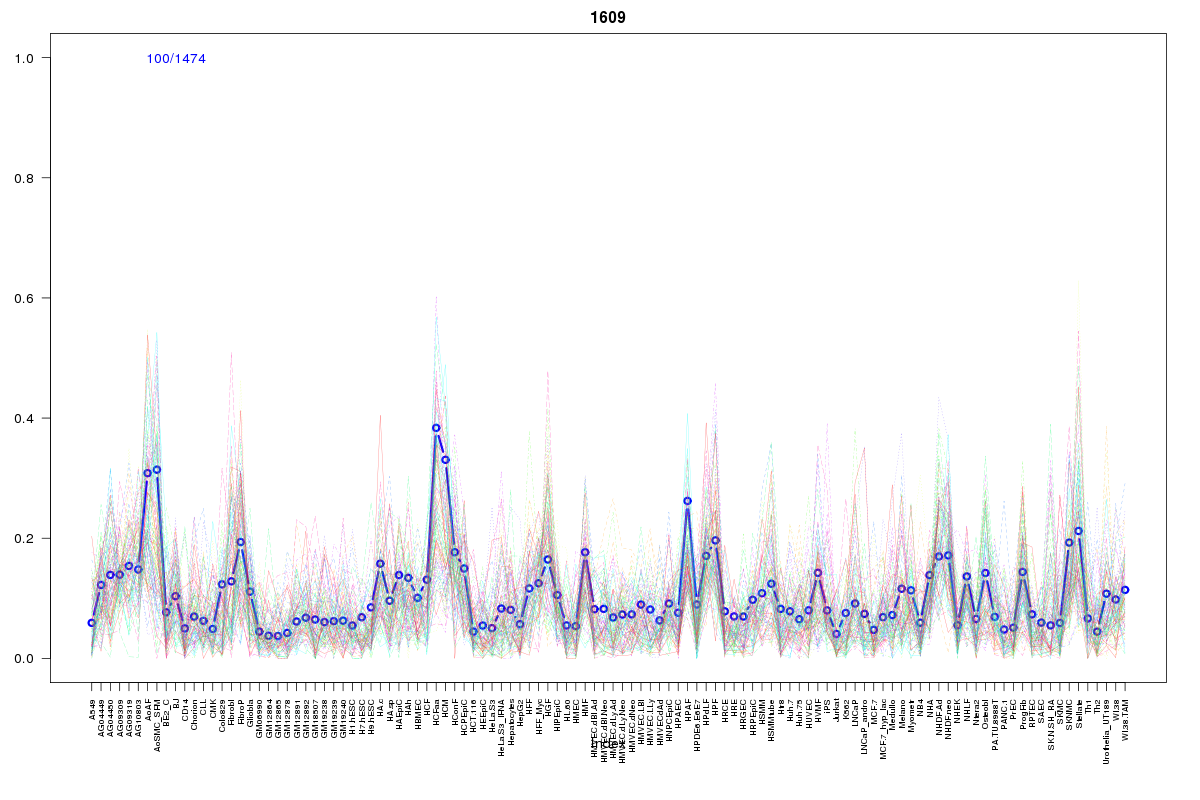 | 1609 | 1 |
Resources
BED file downloads
Connects to 46 DHS sitesTop 10 Correlated DHS Sites
p-values indiciate significant higher or lower correlation| Location | Cluster | P-value |
|---|---|---|
| chr2:233361540-233361690 | 1255 | 0.004 |
| chr2:233361945-233362095 | 111 | 0.004 |
| chr2:233344185-233344335 | 1008 | 0.007 |
| chr2:233368320-233368470 | 1057 | 0.009 |
| chr2:233323725-233323875 | 1055 | 0.01 |
| chr2:233386085-233386235 | 1008 | 0.013 |
| chr2:233370505-233370655 | 905 | 0.013 |
| chr2:233388505-233388655 | 605 | 0.013 |
| chr2:233321860-233322010 | 111 | 0.013 |
| chr2:233342885-233343035 | 1008 | 0.013 |
| chr2:233356020-233356170 | 822 | 0.013 |
External Databases
UCSCEnsembl (ENSG00000171551)