Gene: LETM1
chr4: 1813205-1857974Expression Profile
(log scale)
Graphical Connections
Distribution of linked clusters:
You may find it interesting if many of the connected DHS sites belong to the same cluster.| Cluster Profile | Cluster ID | Number of DHS sites in this cluster |
|---|---|---|
 | 2114 | 3 |
 | 615 | 3 |
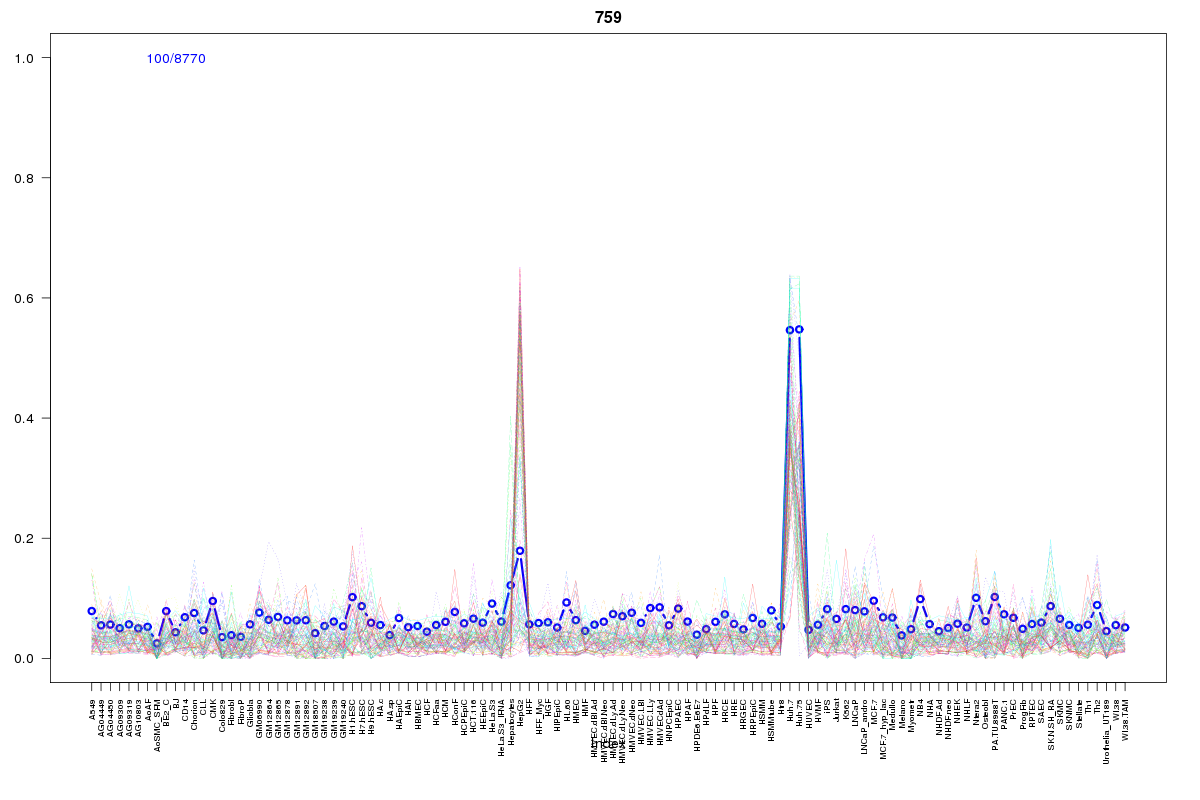 | 759 | 2 |
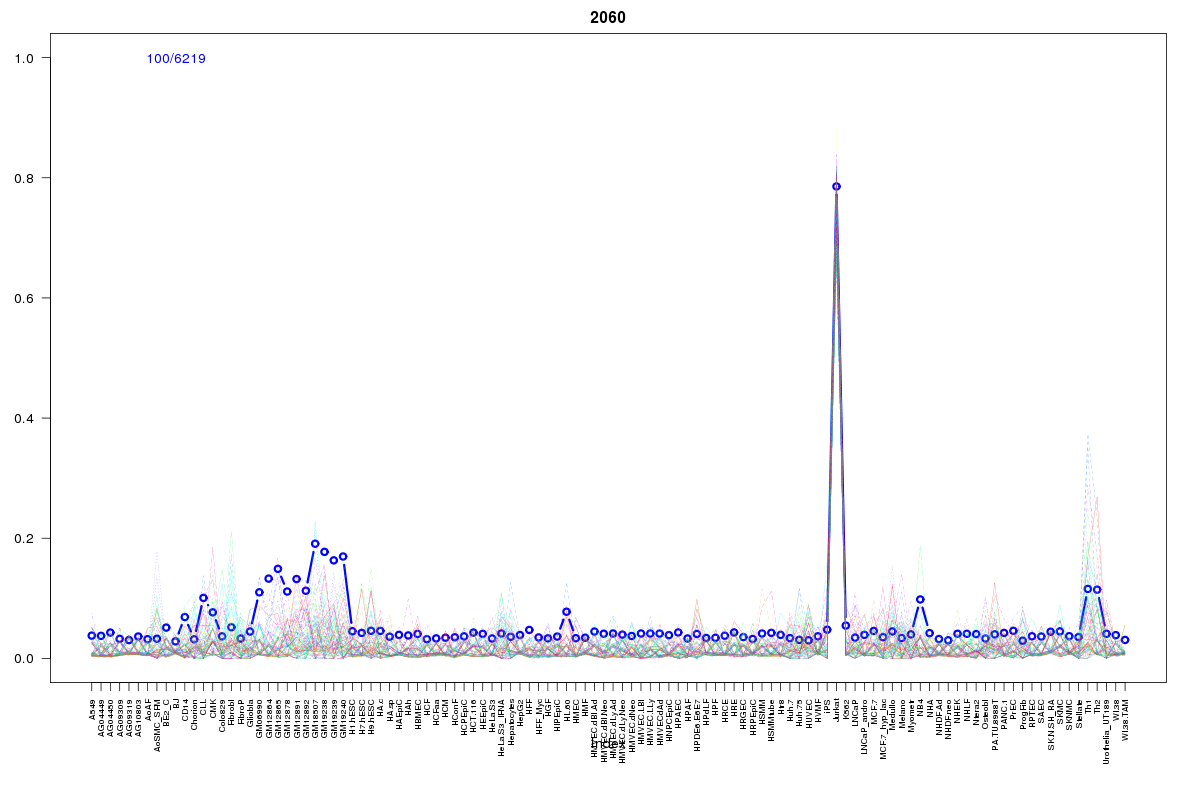 | 2060 | 2 |
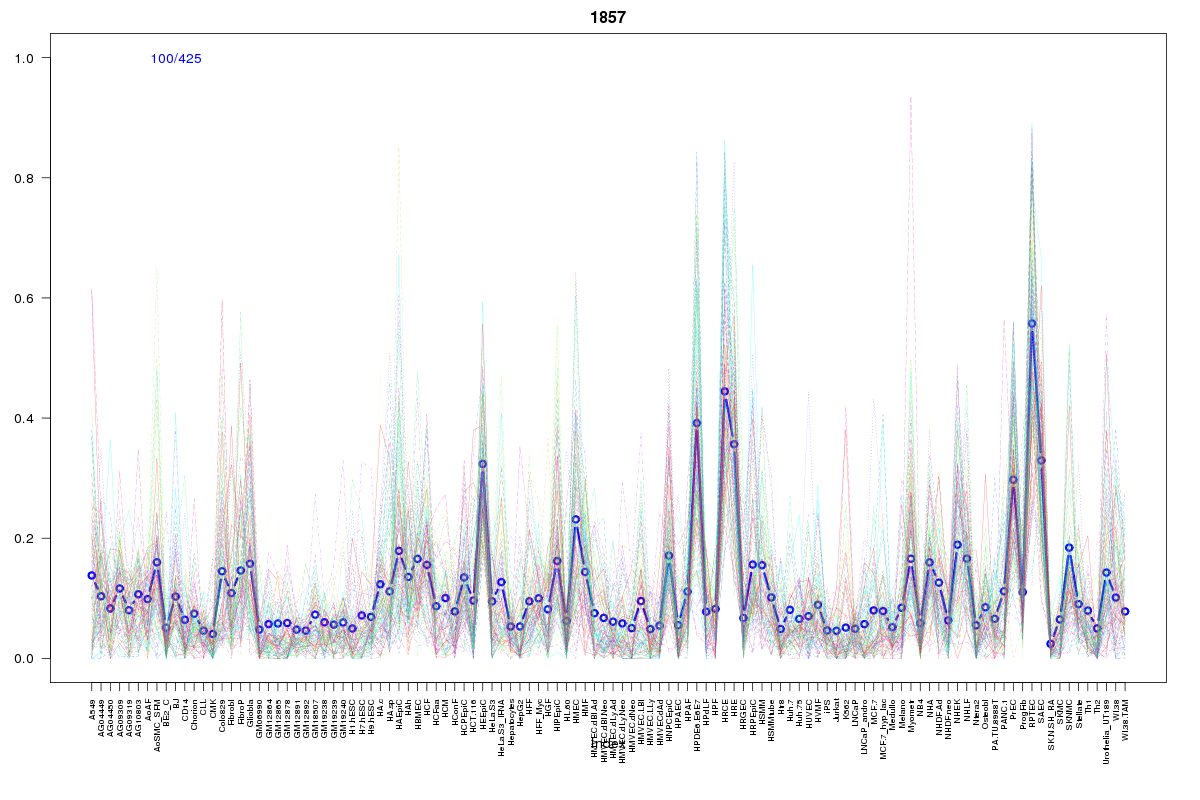 | 1857 | 1 |
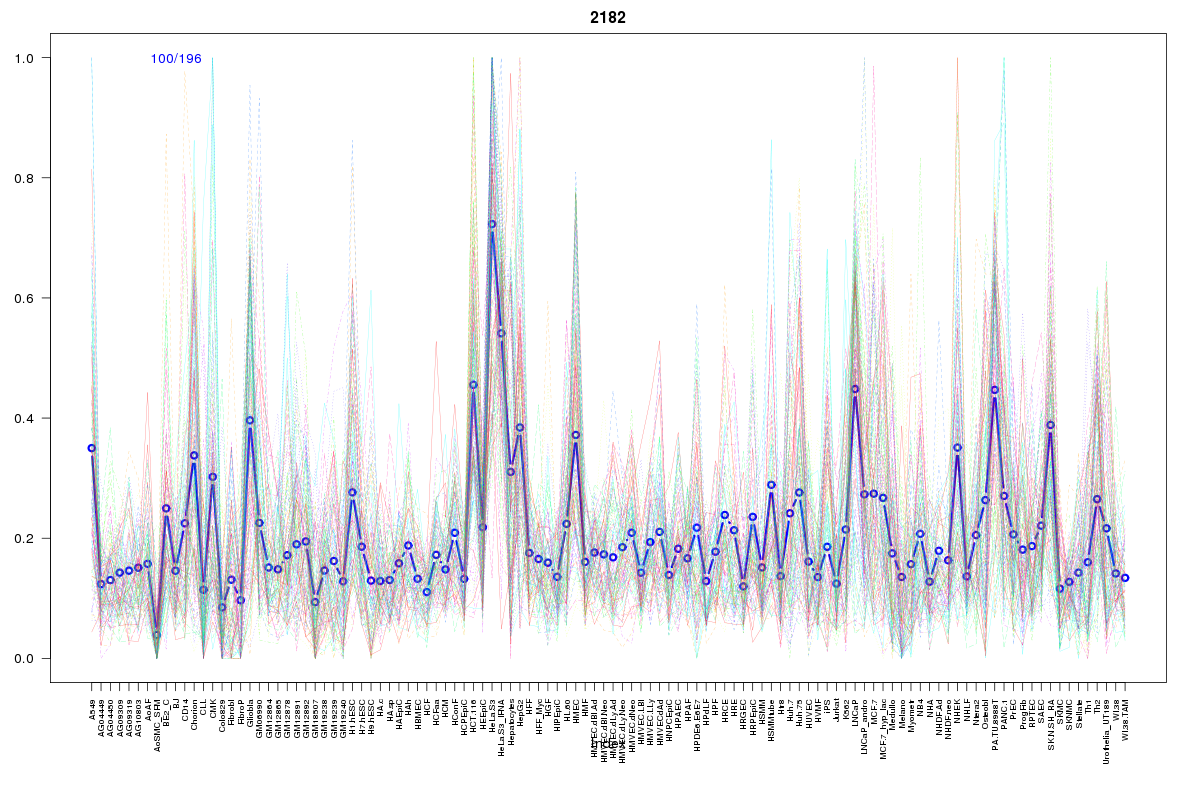 | 2182 | 1 |
 | 2012 | 1 |
 | 2110 | 1 |
 | 1355 | 1 |
 | 2017 | 1 |
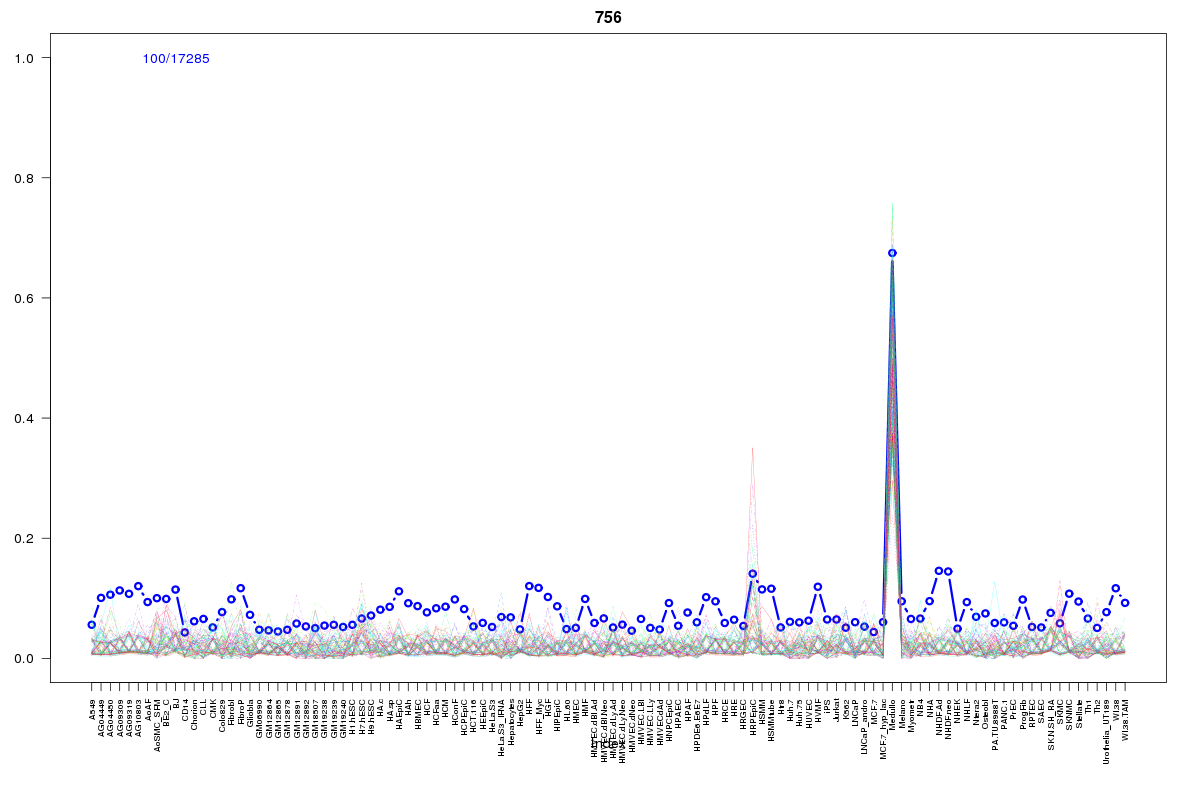 | 756 | 1 |
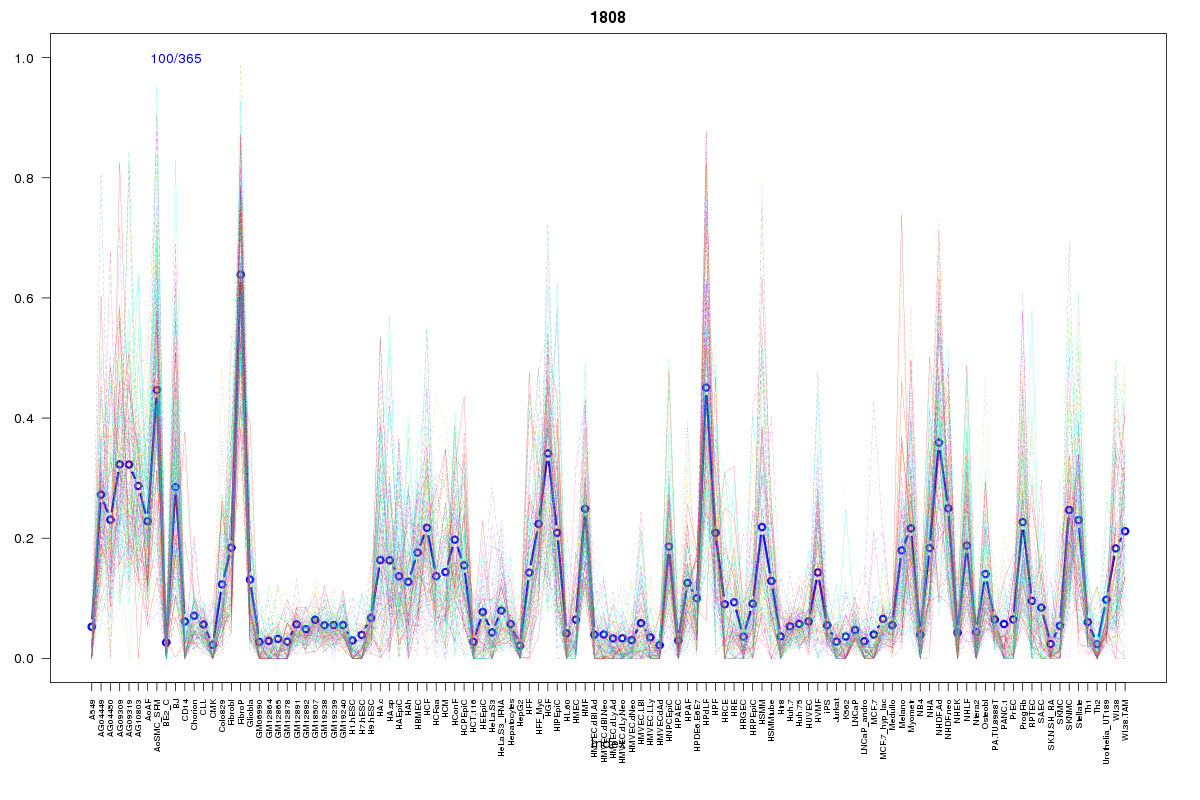 | 1808 | 1 |
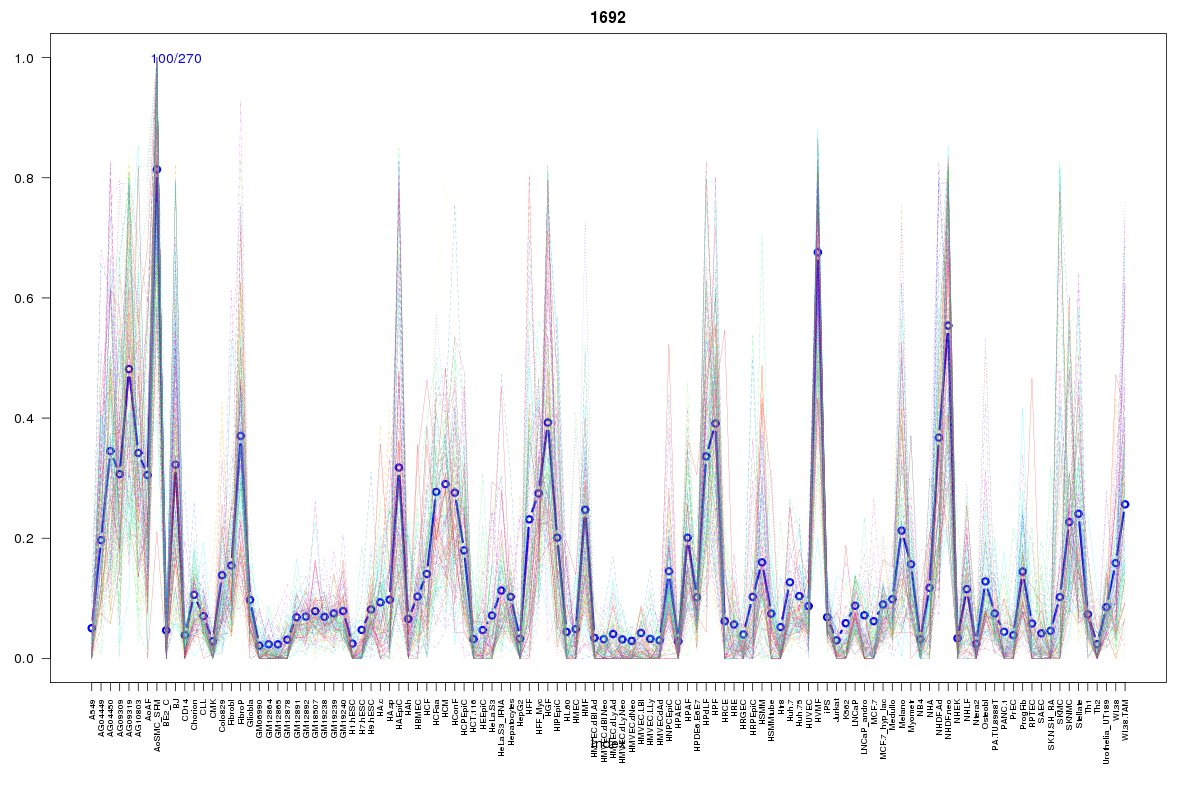 | 1692 | 1 |
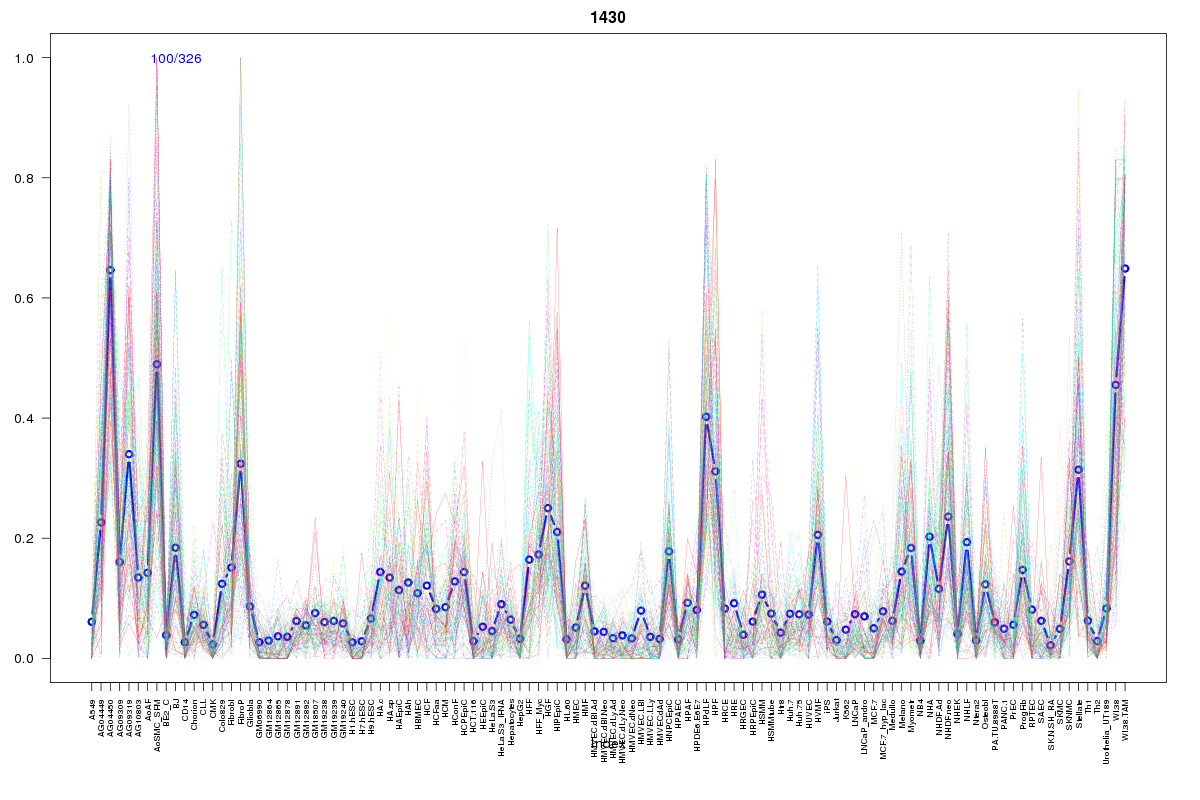 | 1430 | 1 |
Resources
BED file downloads
Connects to 20 DHS sitesTop 10 Correlated DHS Sites
p-values indiciate significant higher or lower correlation| Location | Cluster | P-value |
|---|---|---|
| chr4:1855245-1855395 | 615 | 0 |
| chr4:1809060-1809210 | 2012 | 0 |
| chr4:1861225-1861375 | 759 | 0.001 |
| chr4:1842540-1842690 | 2114 | 0.009 |
| chr4:1832120-1832270 | 2110 | 0.01 |
| chr4:1843280-1843430 | 2114 | 0.01 |
| chr4:1729445-1729595 | 1857 | 0.01 |
| chr4:1856825-1856975 | 2017 | 0.015 |
| chr4:1876040-1876190 | 615 | 0.016 |
| chr4:1811145-1811295 | 759 | 0.018 |
| chr4:1855760-1855910 | 615 | 0.019 |
External Databases
UCSCEnsembl (ENSG00000168924)