Gene: TP53INP1
chr8: 95938199-95961639Expression Profile
(log scale)
Graphical Connections
Distribution of linked clusters:
You may find it interesting if many of the connected DHS sites belong to the same cluster.| Cluster Profile | Cluster ID | Number of DHS sites in this cluster |
|---|---|---|
 | 1605 | 2 |
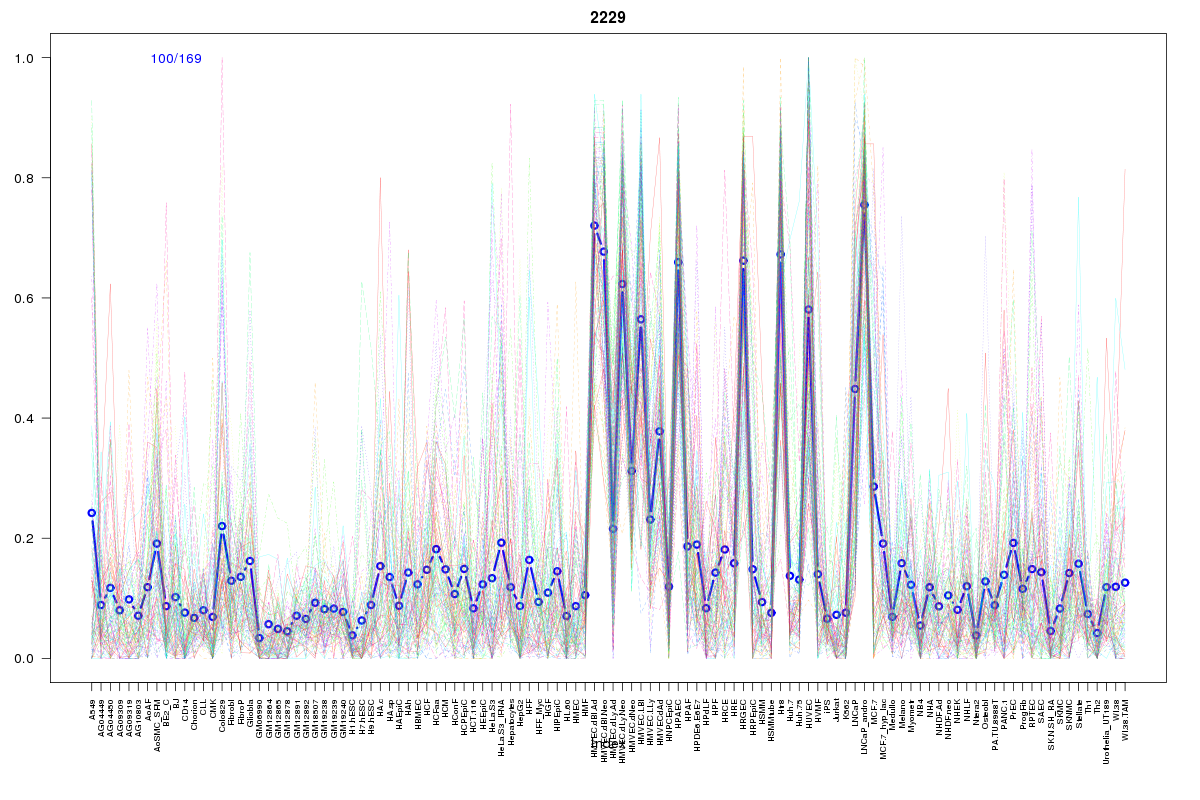 | 2229 | 1 |
 | 934 | 1 |
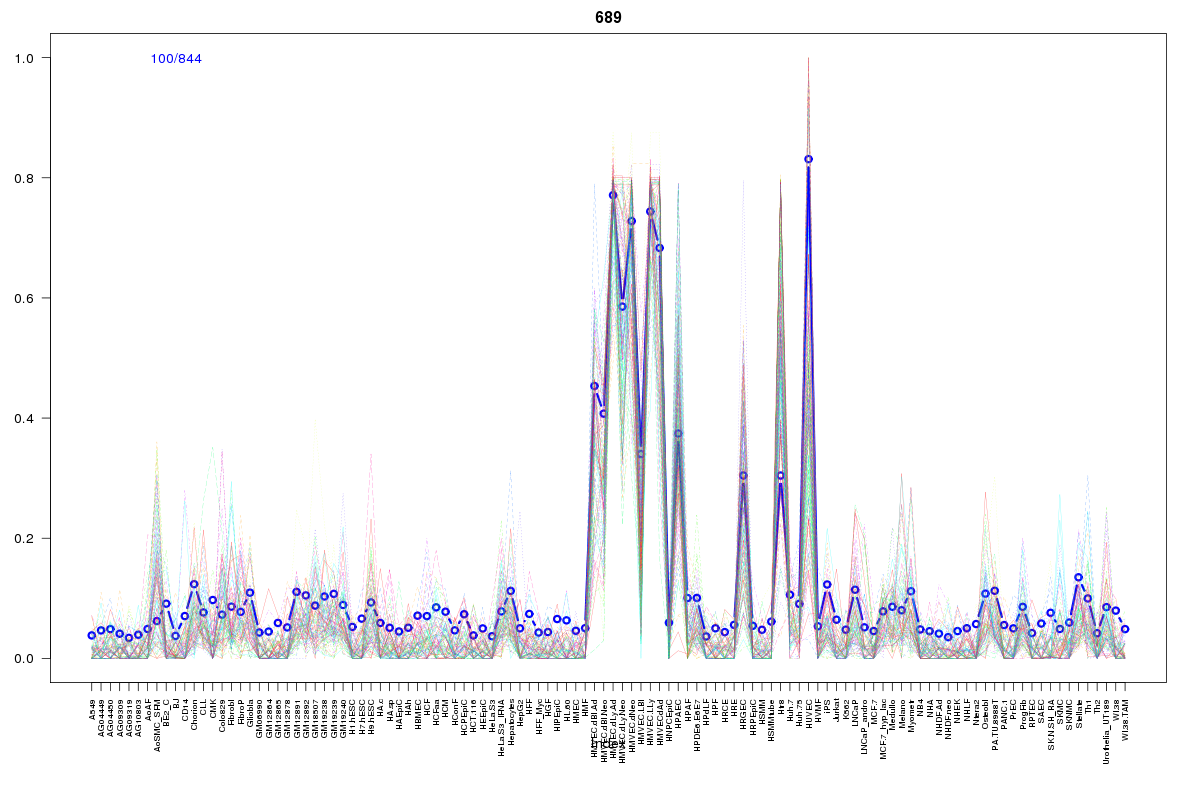 | 689 | 1 |
 | 2055 | 1 |
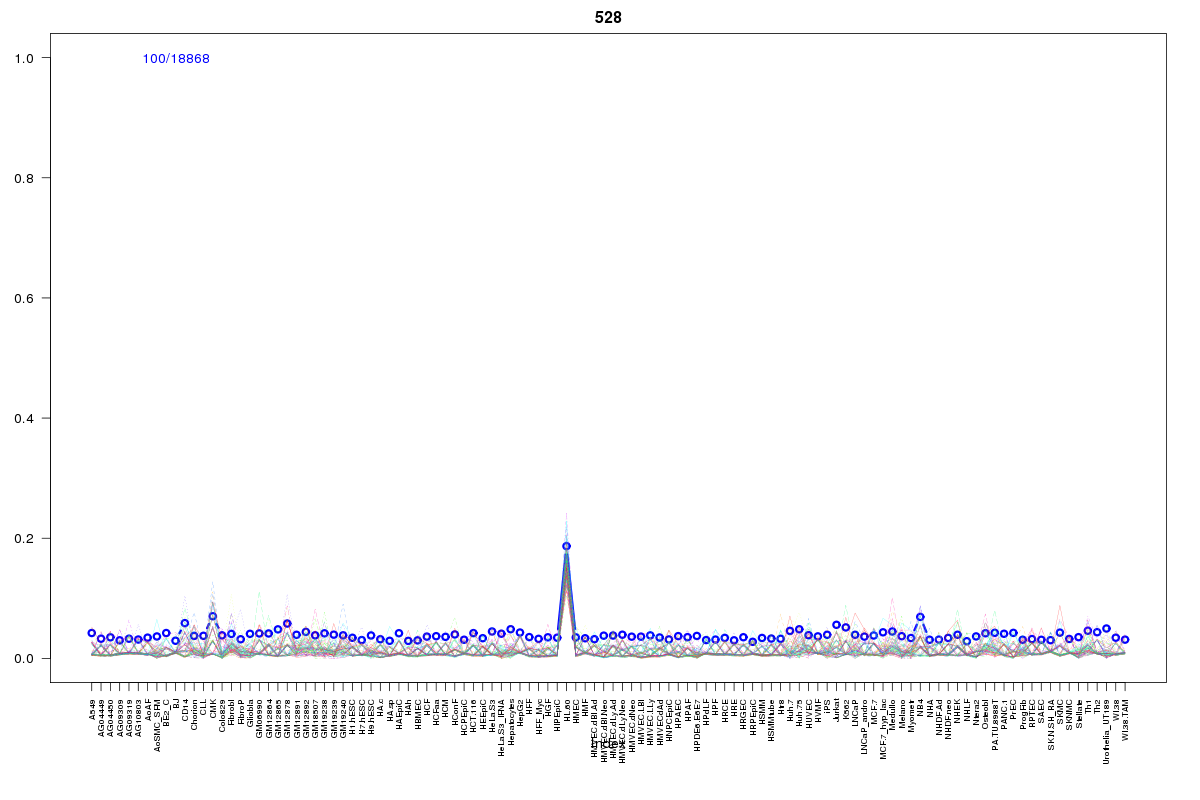 | 528 | 1 |
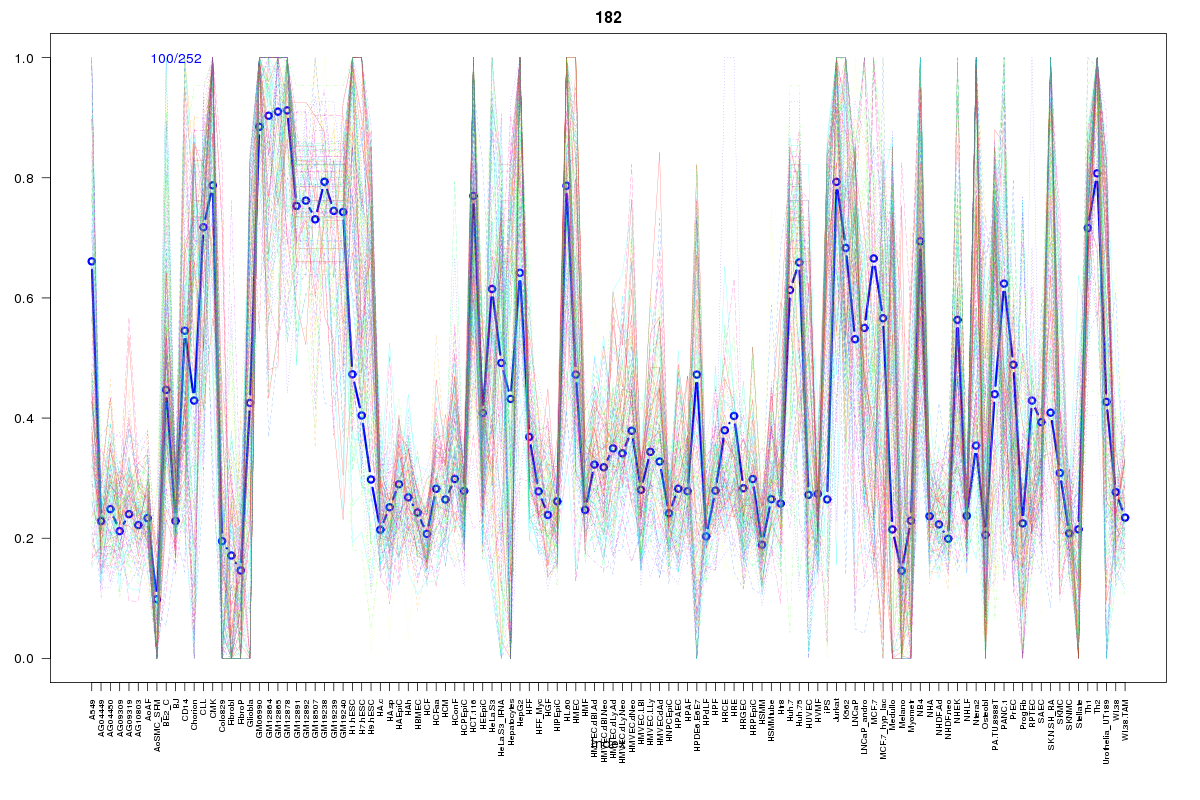 | 182 | 1 |
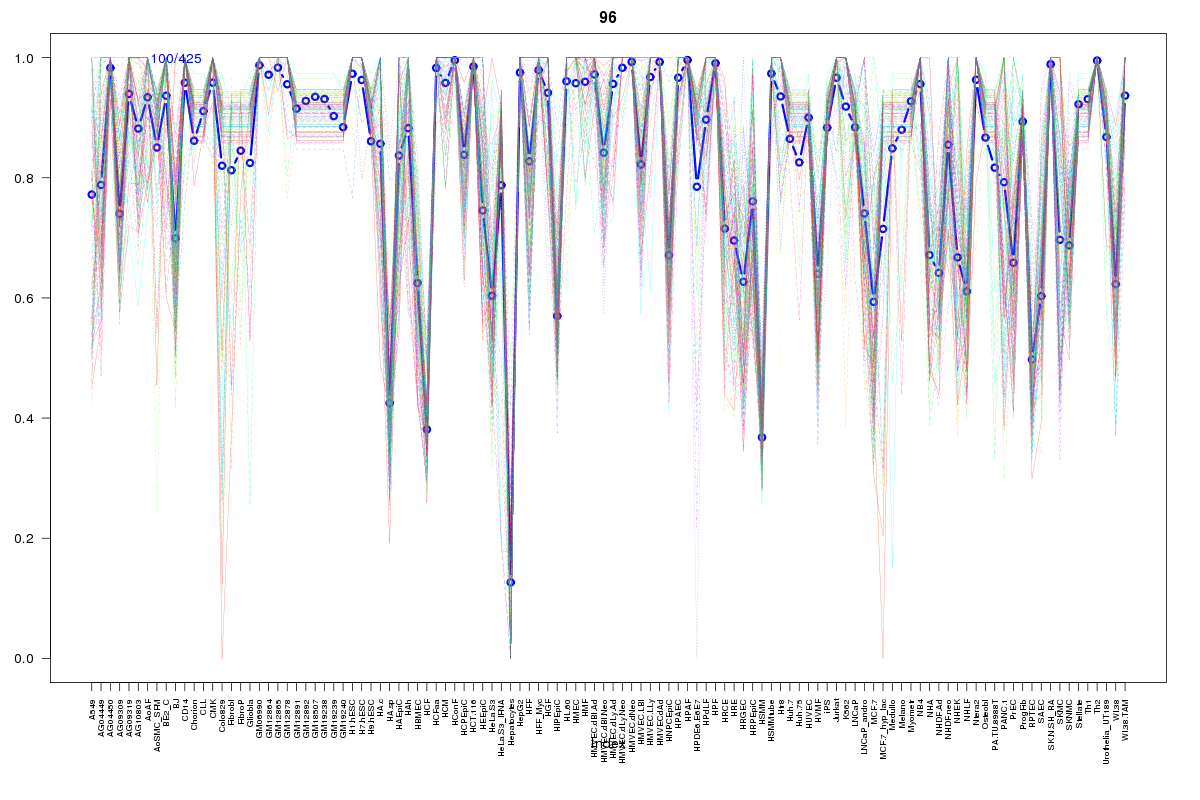 | 96 | 1 |
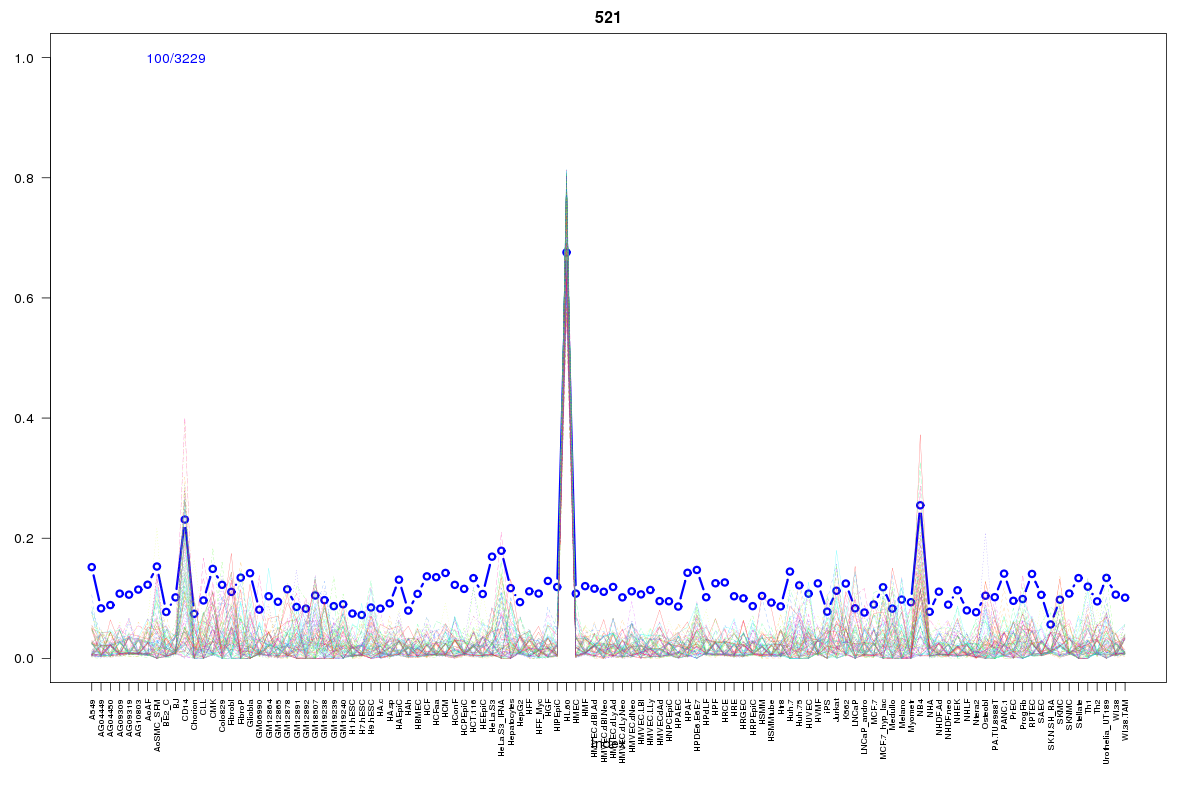 | 521 | 1 |
 | 1056 | 1 |
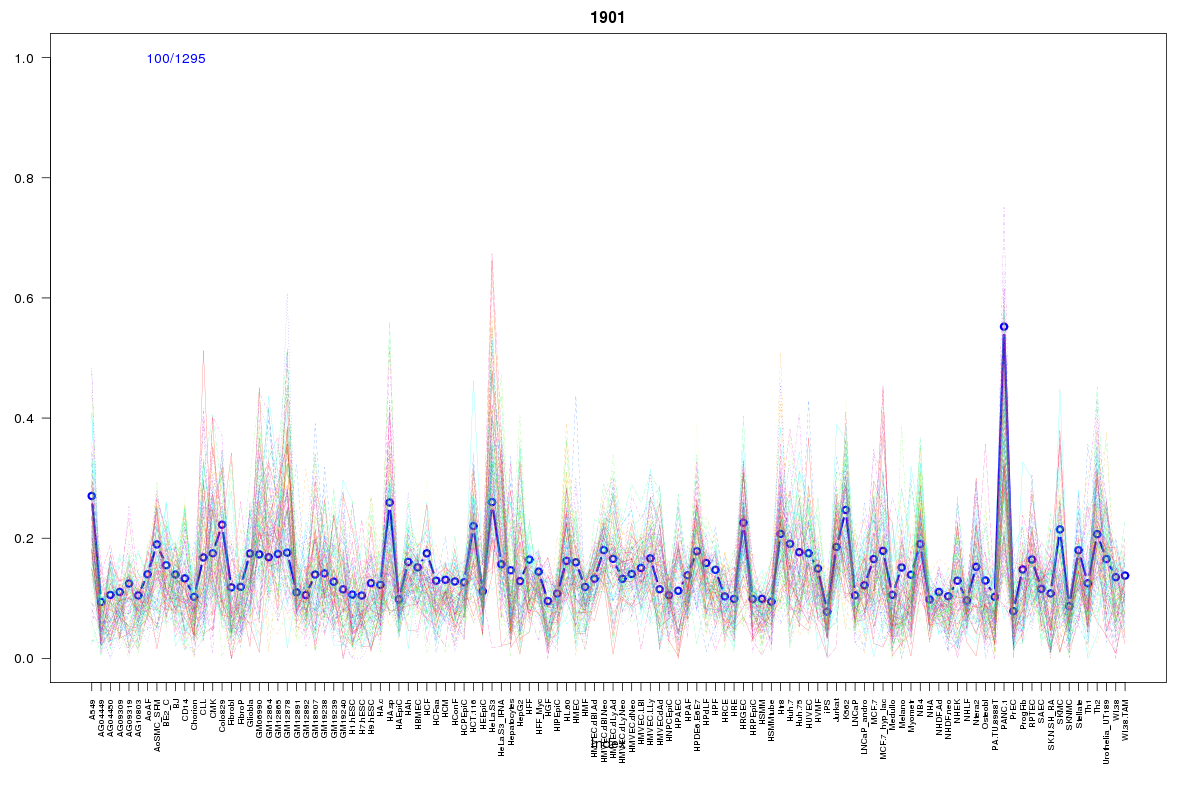 | 1901 | 1 |
 | 860 | 1 |
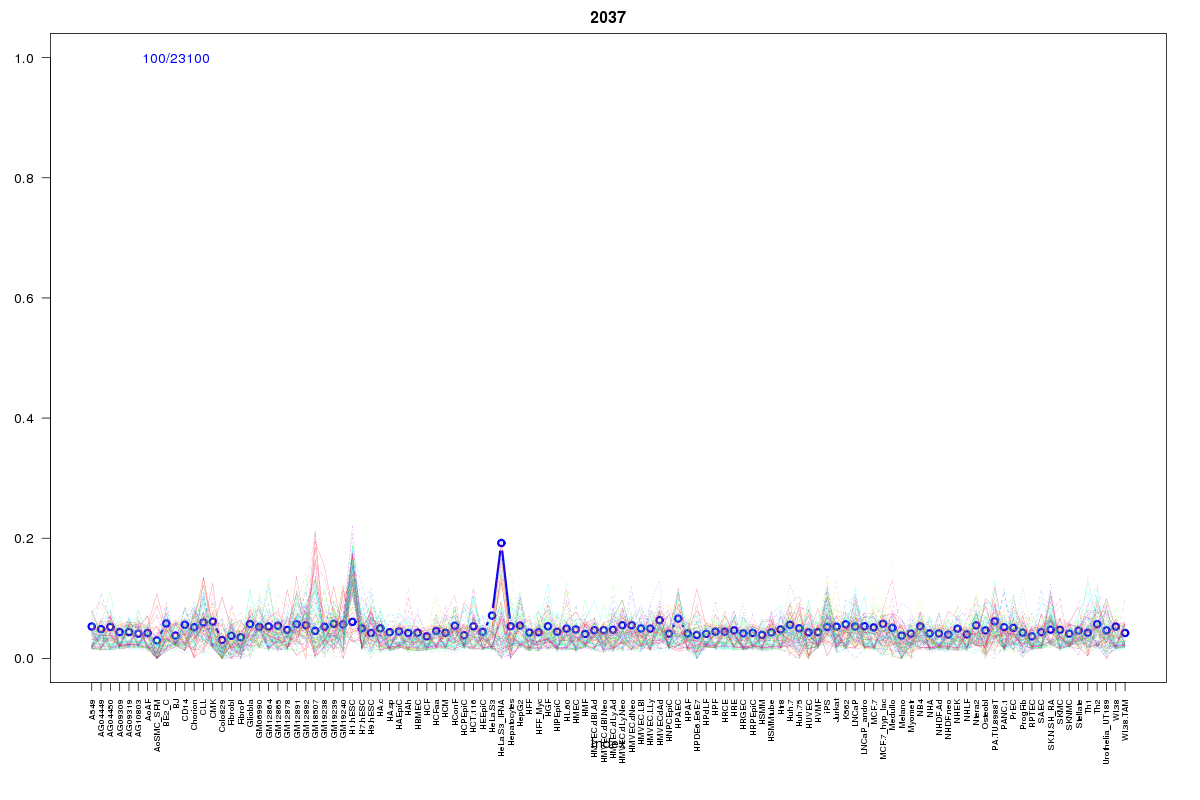 | 2037 | 1 |
 | 430 | 1 |
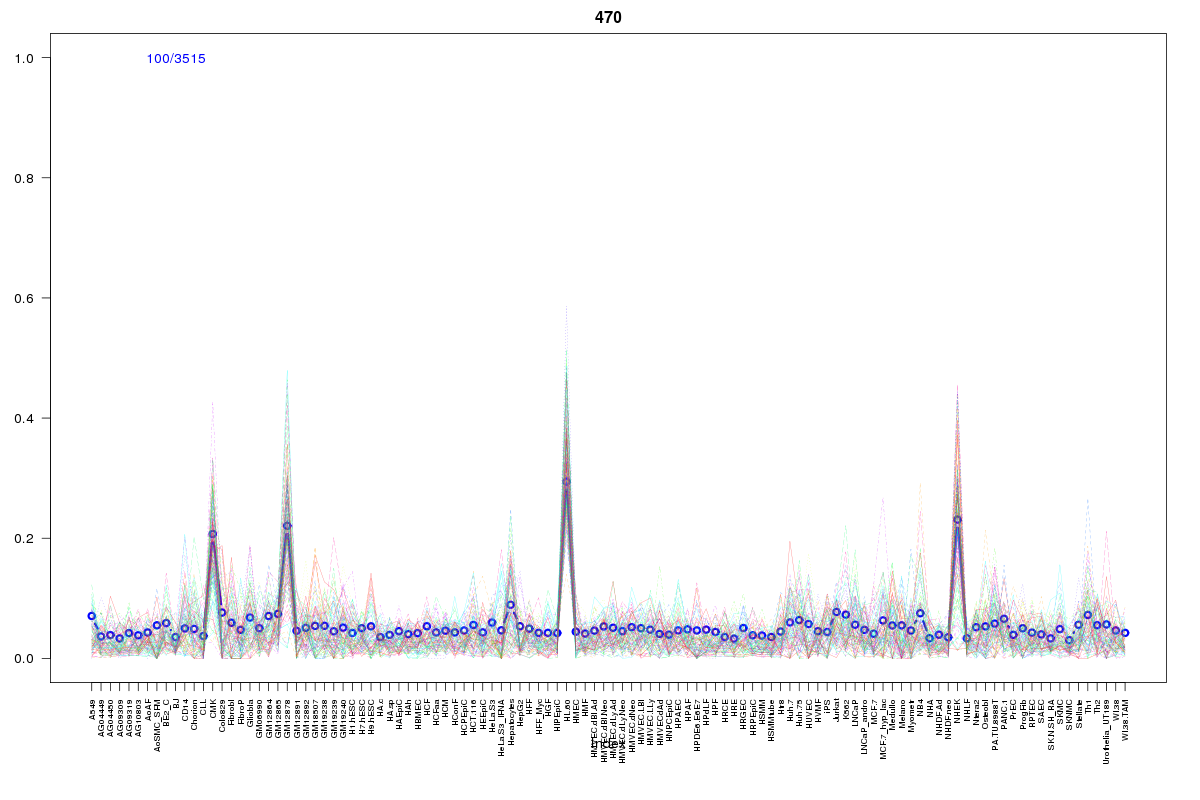 | 470 | 1 |
 | 2181 | 1 |
 | 2017 | 1 |
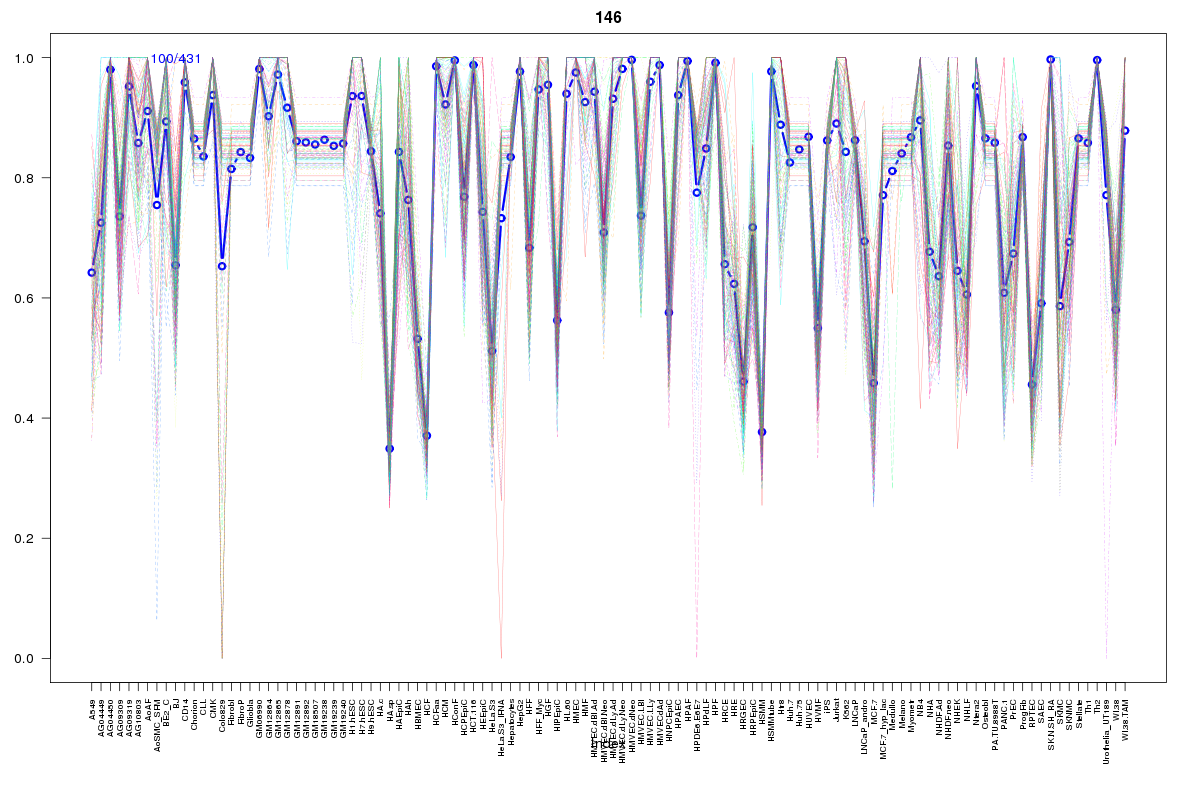 | 146 | 1 |
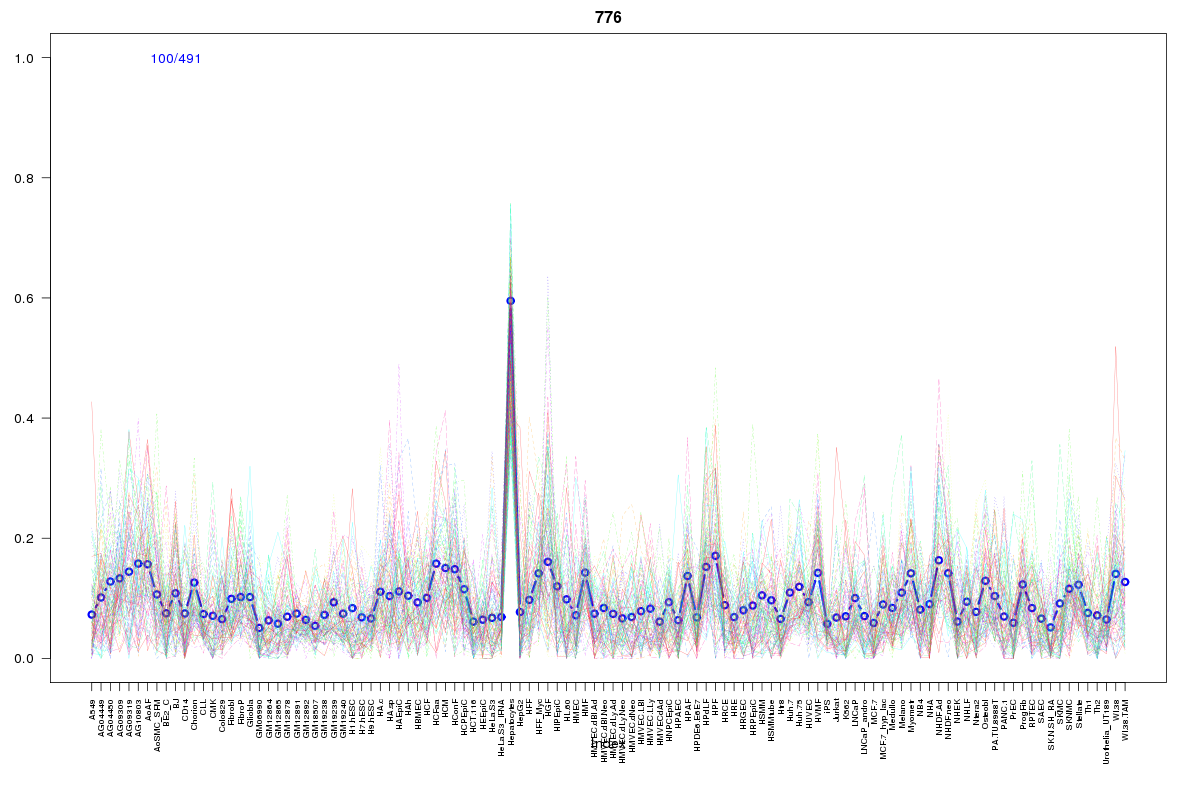 | 776 | 1 |
 | 1589 | 1 |
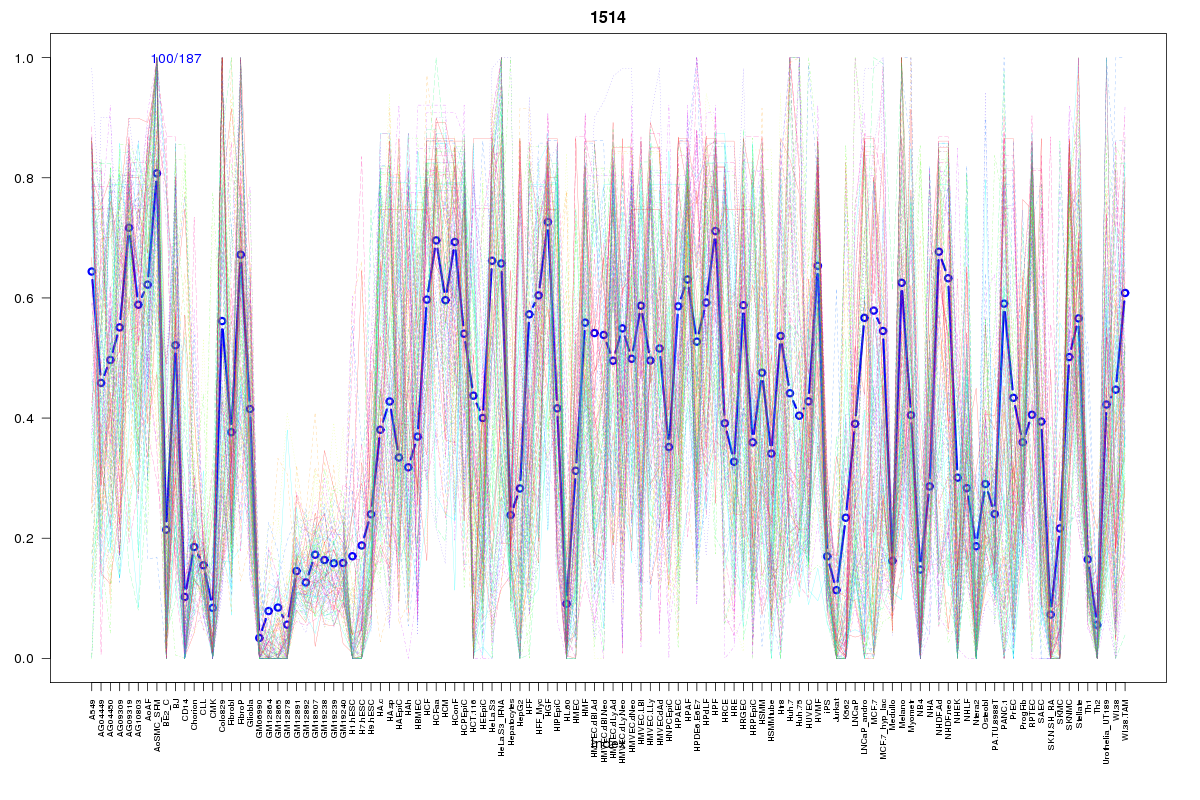 | 1514 | 1 |
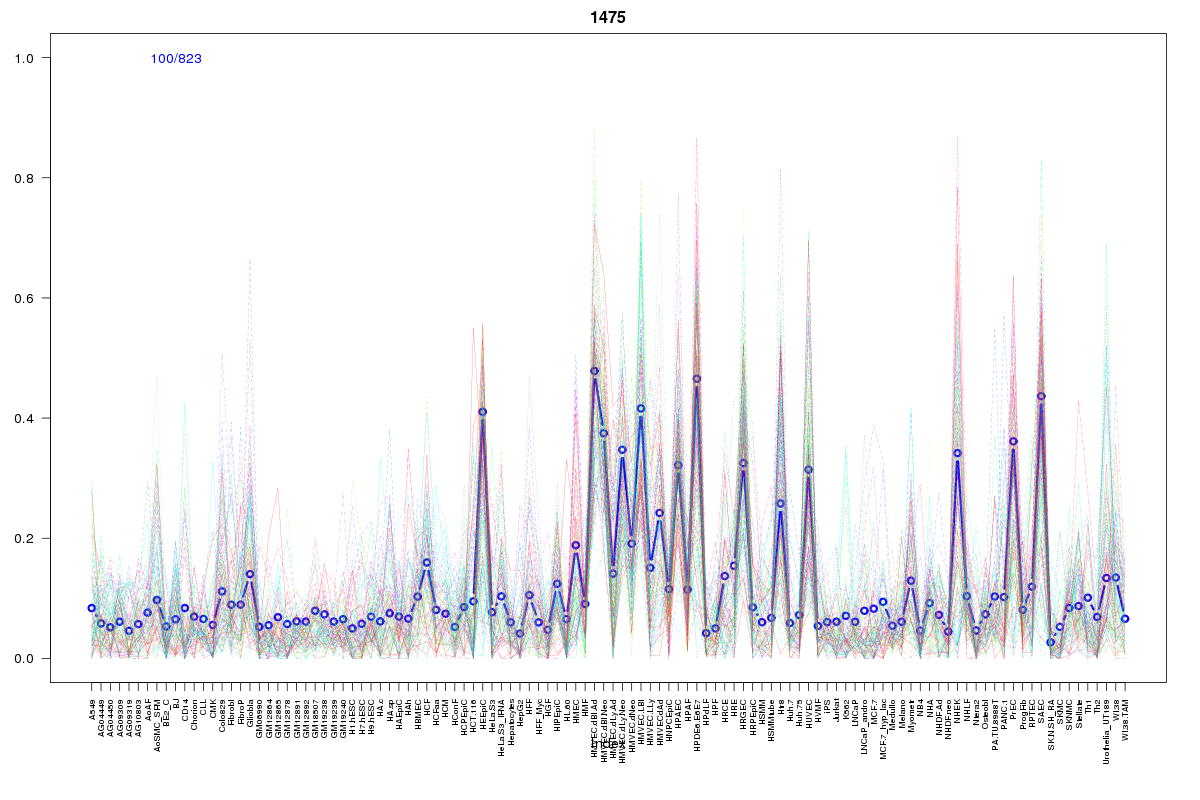 | 1475 | 1 |
Resources
BED file downloads
Connects to 23 DHS sitesTop 10 Correlated DHS Sites
p-values indiciate significant higher or lower correlation| Location | Cluster | P-value |
|---|---|---|
| chr8:95961620-95961770 | 146 | 0.002 |
| chr8:95957700-95957850 | 2181 | 0.002 |
| chr8:95980240-95980390 | 1589 | 0.003 |
| chr8:95980440-95980590 | 1514 | 0.003 |
| chr8:96003980-96004130 | 2229 | 0.003 |
| chr8:95963165-95963315 | 776 | 0.004 |
| chr8:96028140-96028290 | 934 | 0.008 |
| chr8:96002280-96002430 | 1475 | 0.009 |
| chr8:96033105-96033255 | 2055 | 0.014 |
| chr8:95875580-95875730 | 689 | 0.015 |
| chr8:95960305-95960455 | 2017 | 0.023 |
External Databases
UCSCEnsembl (ENSG00000164938)