Gene: BPNT1
chr1: 220230823-220263191Expression Profile
(log scale)
Graphical Connections
Distribution of linked clusters:
You may find it interesting if many of the connected DHS sites belong to the same cluster.| Cluster Profile | Cluster ID | Number of DHS sites in this cluster |
|---|---|---|
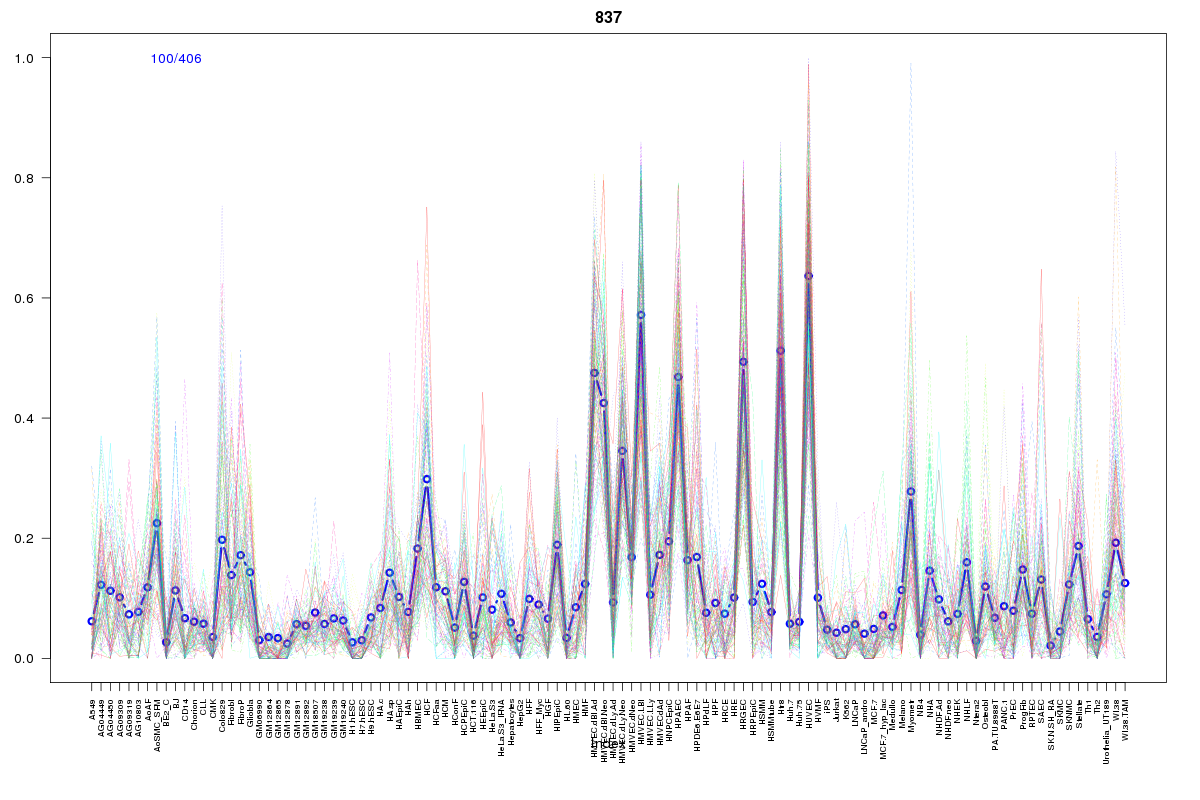 | 837 | 1 |
 | 2211 | 1 |
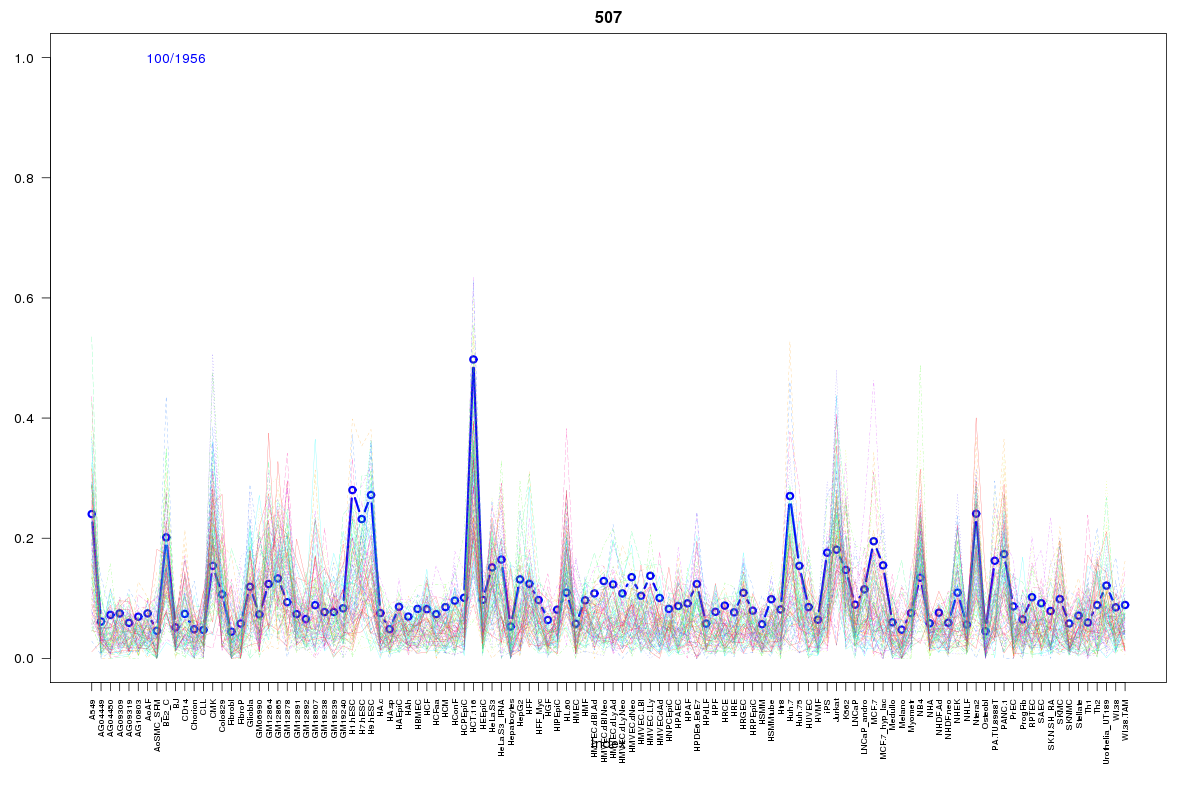 | 507 | 1 |
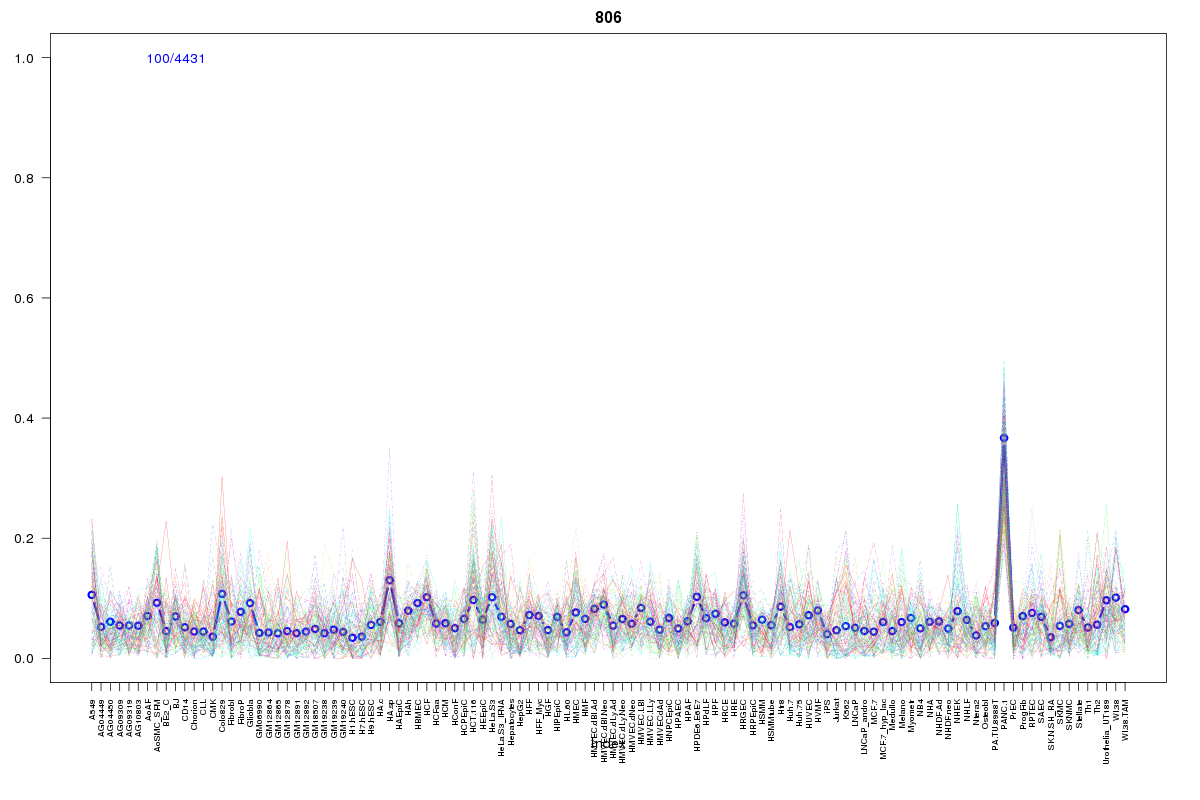 | 806 | 1 |
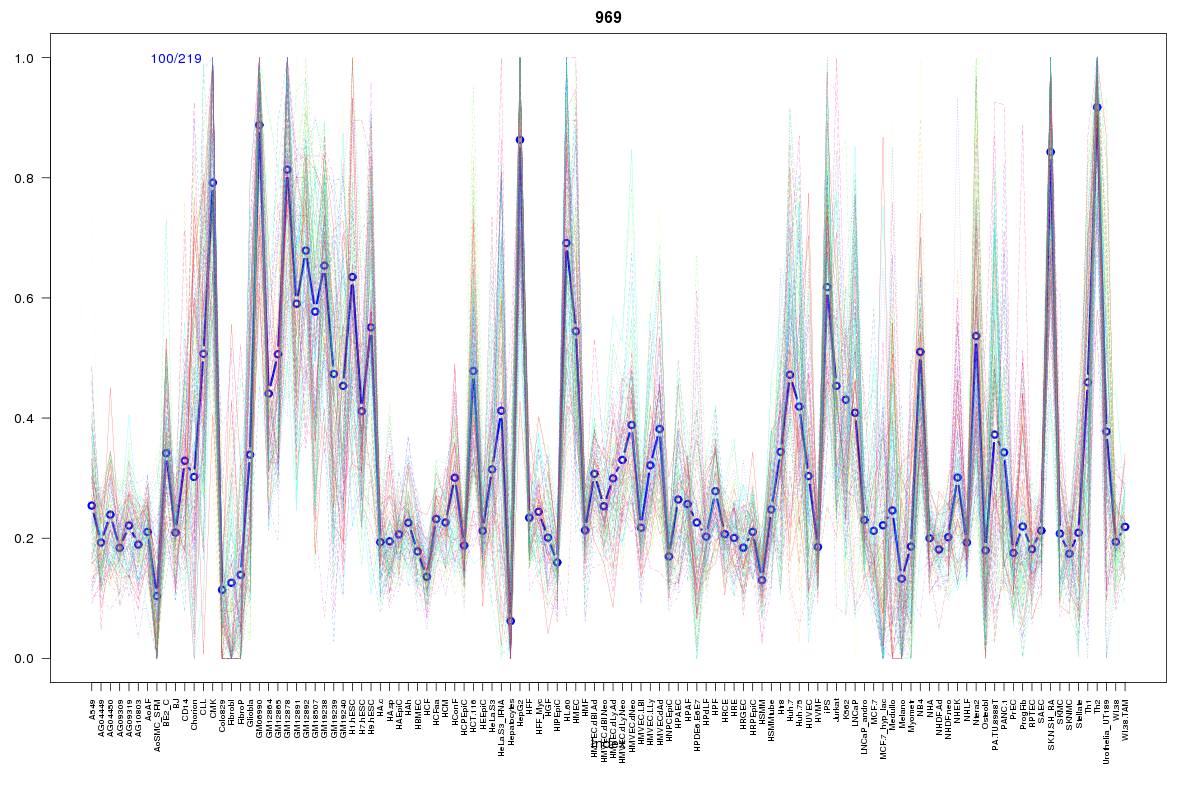 | 969 | 1 |
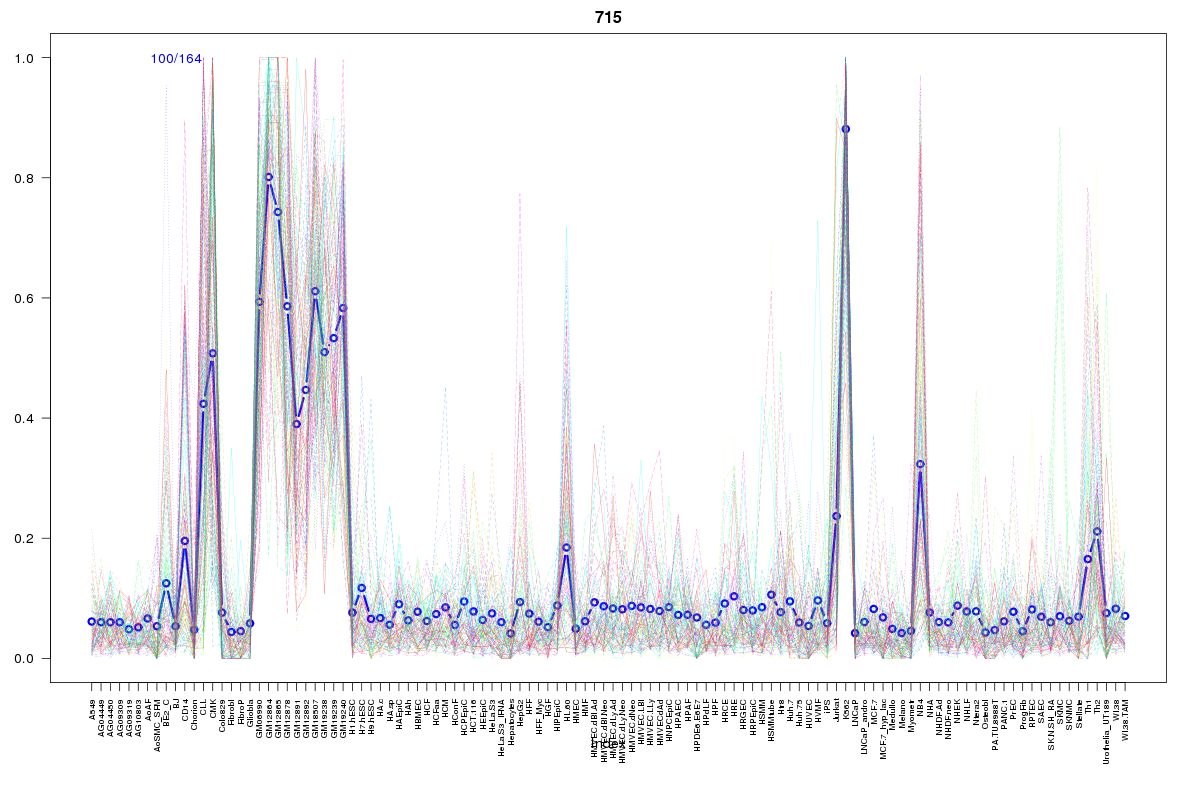 | 715 | 1 |
 | 2017 | 1 |
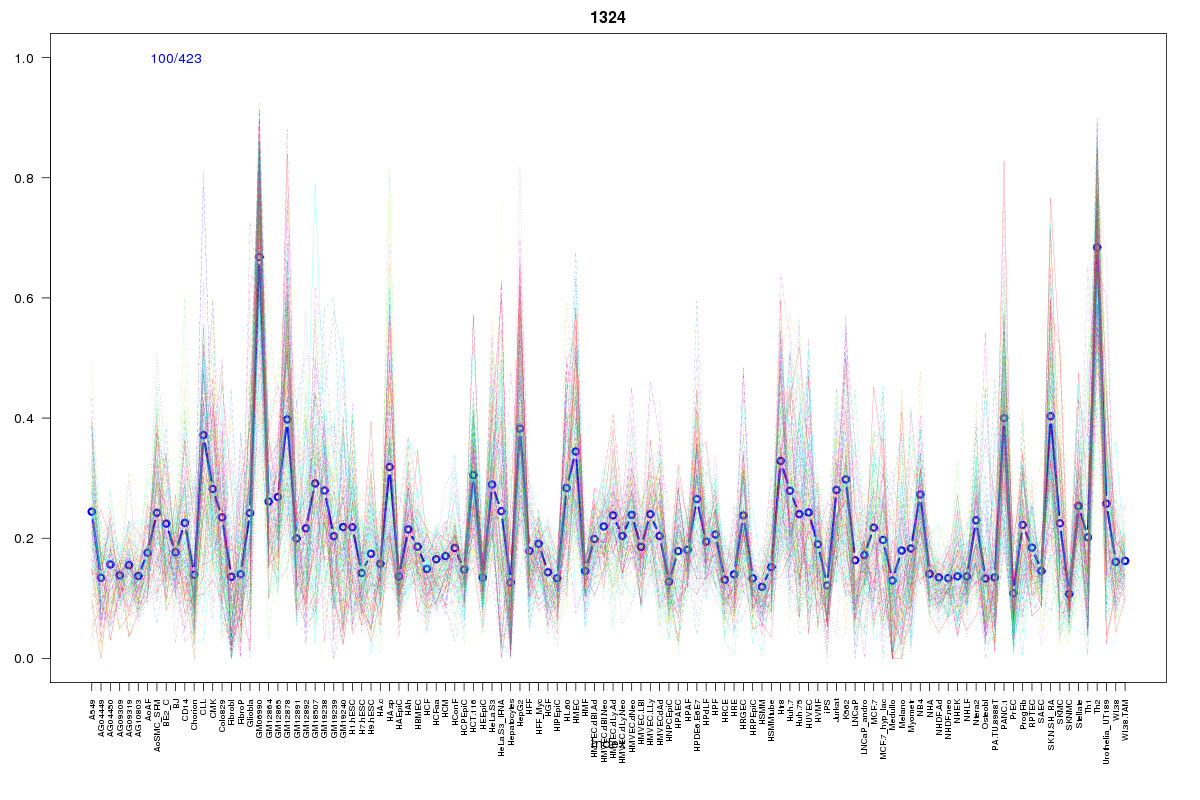 | 1324 | 1 |
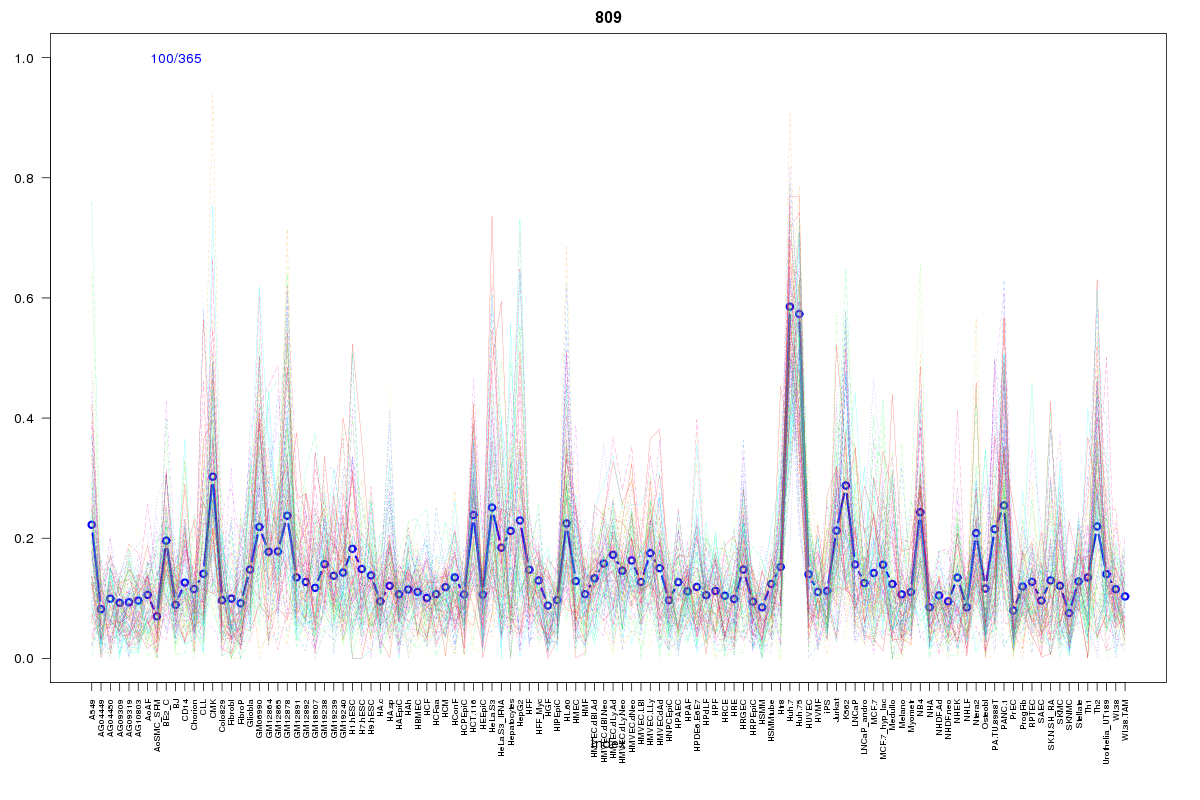 | 809 | 1 |
 | 739 | 1 |
Resources
BED file downloads
Connects to 10 DHS sitesTop 10 Correlated DHS Sites
p-values indiciate significant higher or lower correlation| Location | Cluster | P-value |
|---|---|---|
| chr1:220267005-220267155 | 809 | 0 |
| chr1:220218680-220218830 | 507 | 0.003 |
| chr1:220263460-220263610 | 1324 | 0.003 |
| chr1:220219625-220219775 | 969 | 0.004 |
| chr1:220204745-220204895 | 2211 | 0.006 |
| chr1:220262545-220262695 | 2017 | 0.006 |
| chr1:220259620-220259770 | 715 | 0.008 |
| chr1:220218840-220218990 | 806 | 0.022 |
| chr1:220310860-220311010 | 739 | 0.011 |
| chr1:220185700-220185850 | 837 | 0.007 |
External Databases
UCSCEnsembl (ENSG00000162813)