Gene: SLAMF9
chr1: 159921281-159924044Expression Profile
(log scale)
Graphical Connections
Distribution of linked clusters:
You may find it interesting if many of the connected DHS sites belong to the same cluster.| Cluster Profile | Cluster ID | Number of DHS sites in this cluster |
|---|---|---|
 | 1605 | 6 |
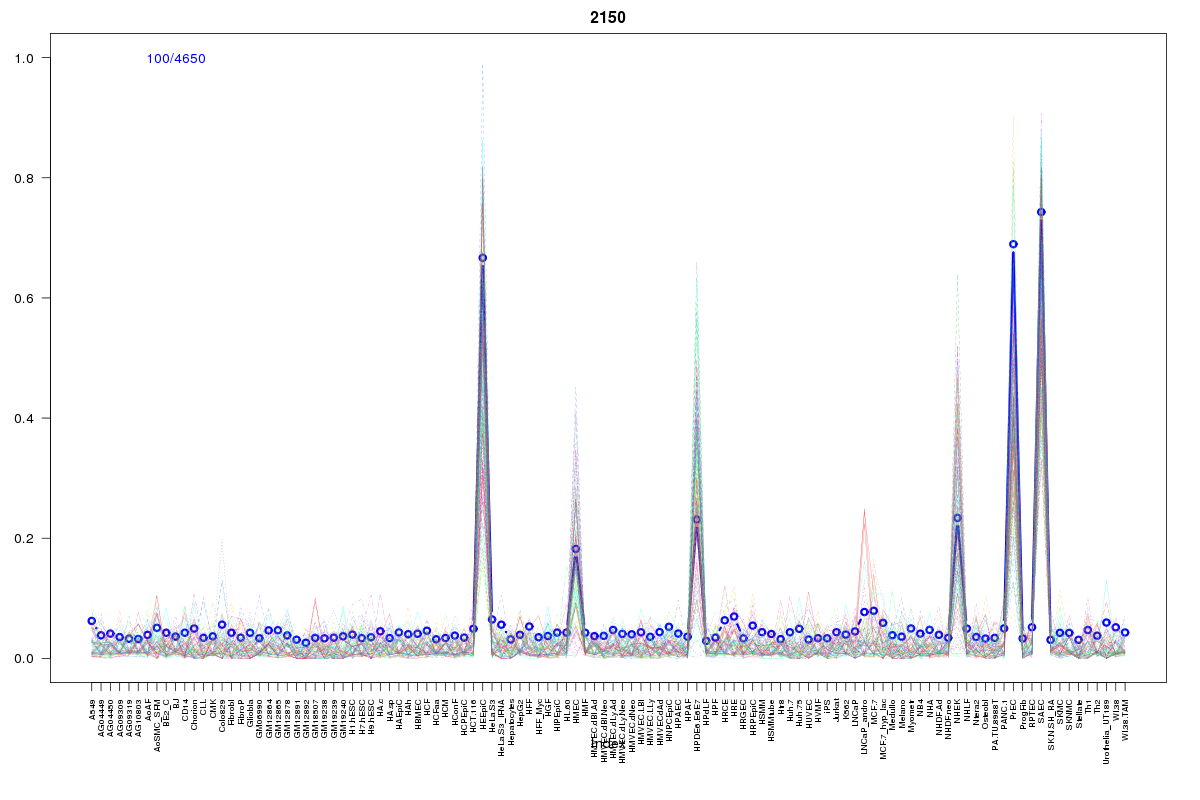 | 2150 | 4 |
 | 10 | 3 |
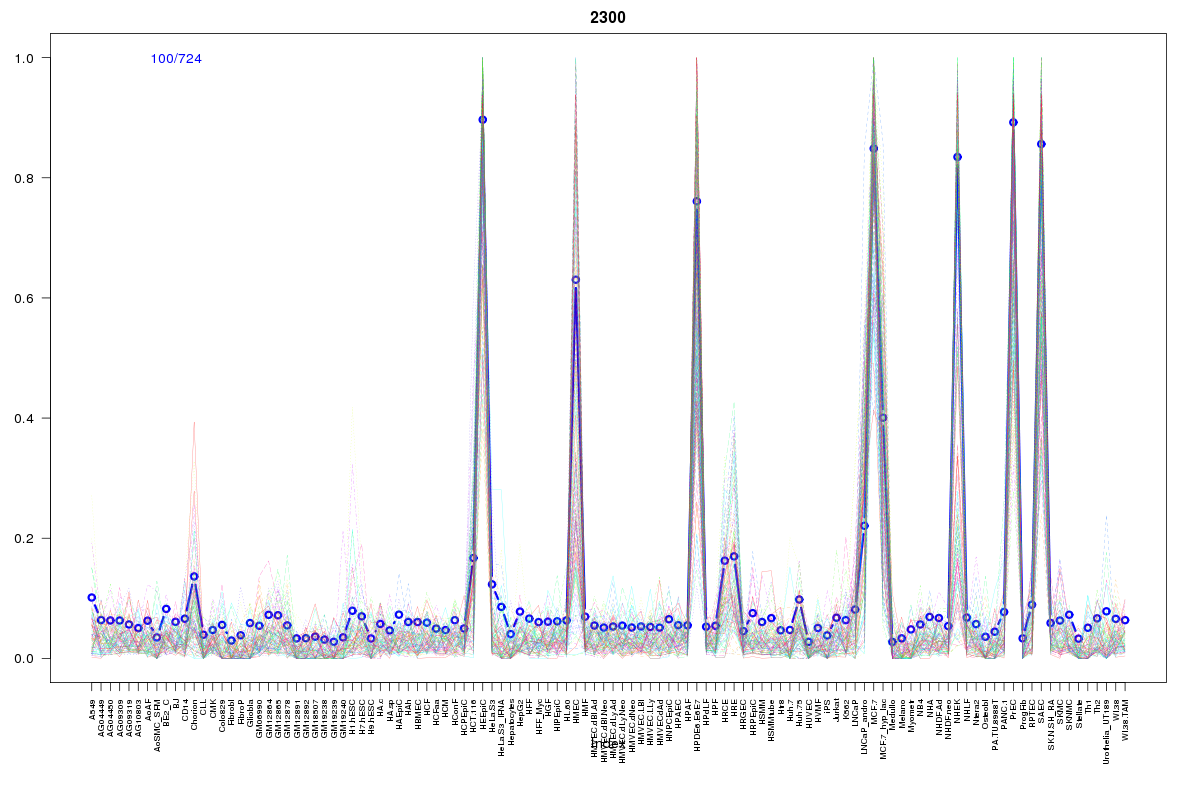 | 2300 | 2 |
 | 1143 | 1 |
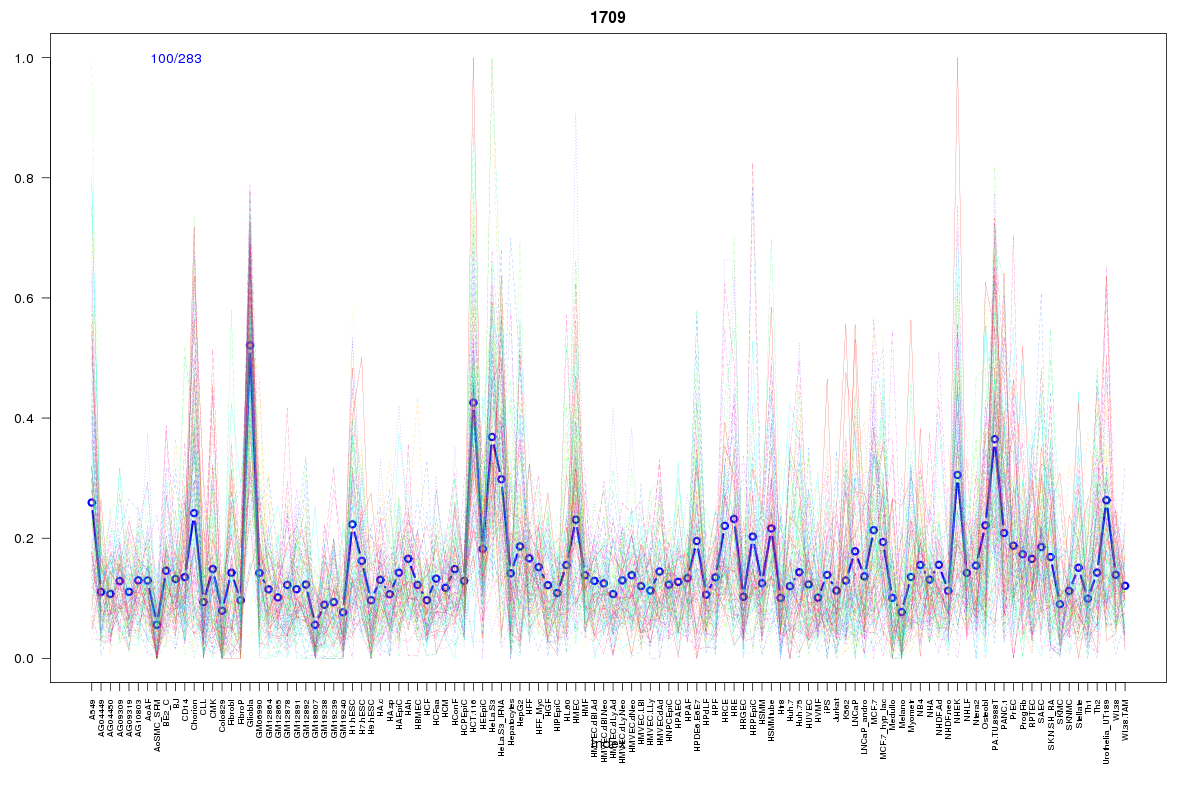 | 1709 | 1 |
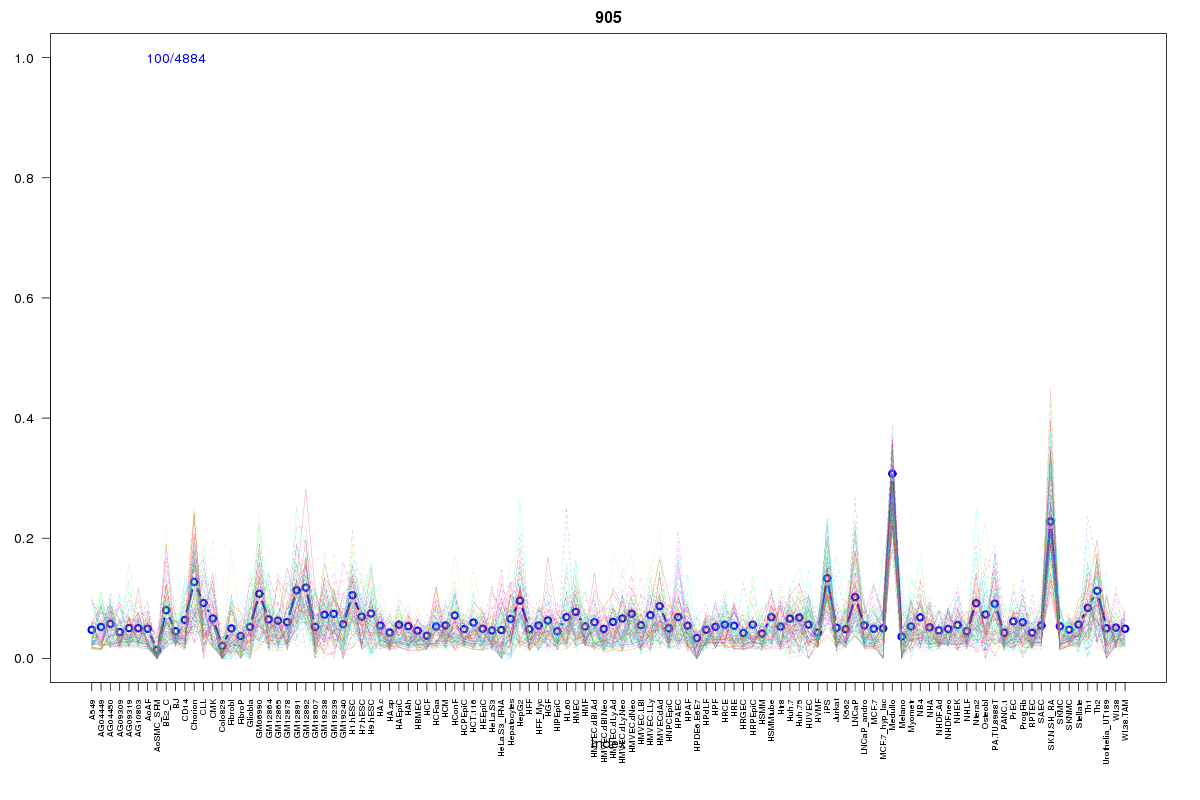 | 905 | 1 |
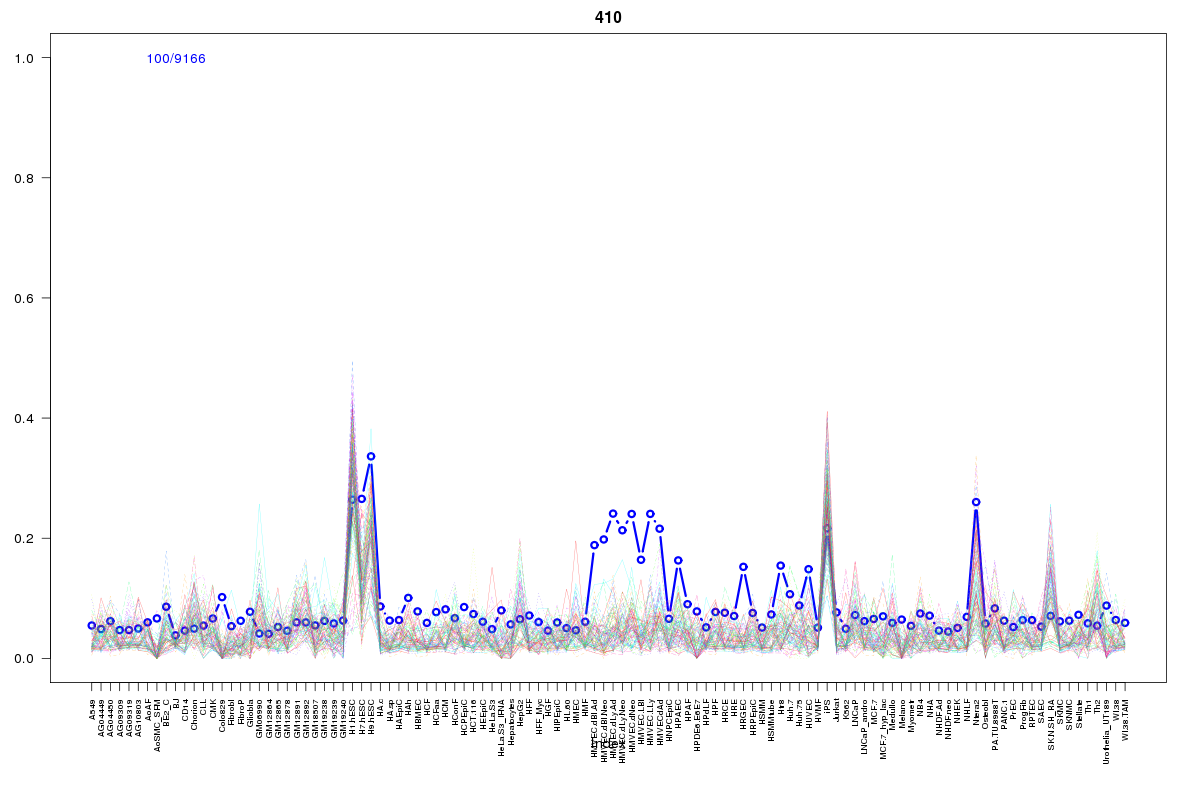 | 410 | 1 |
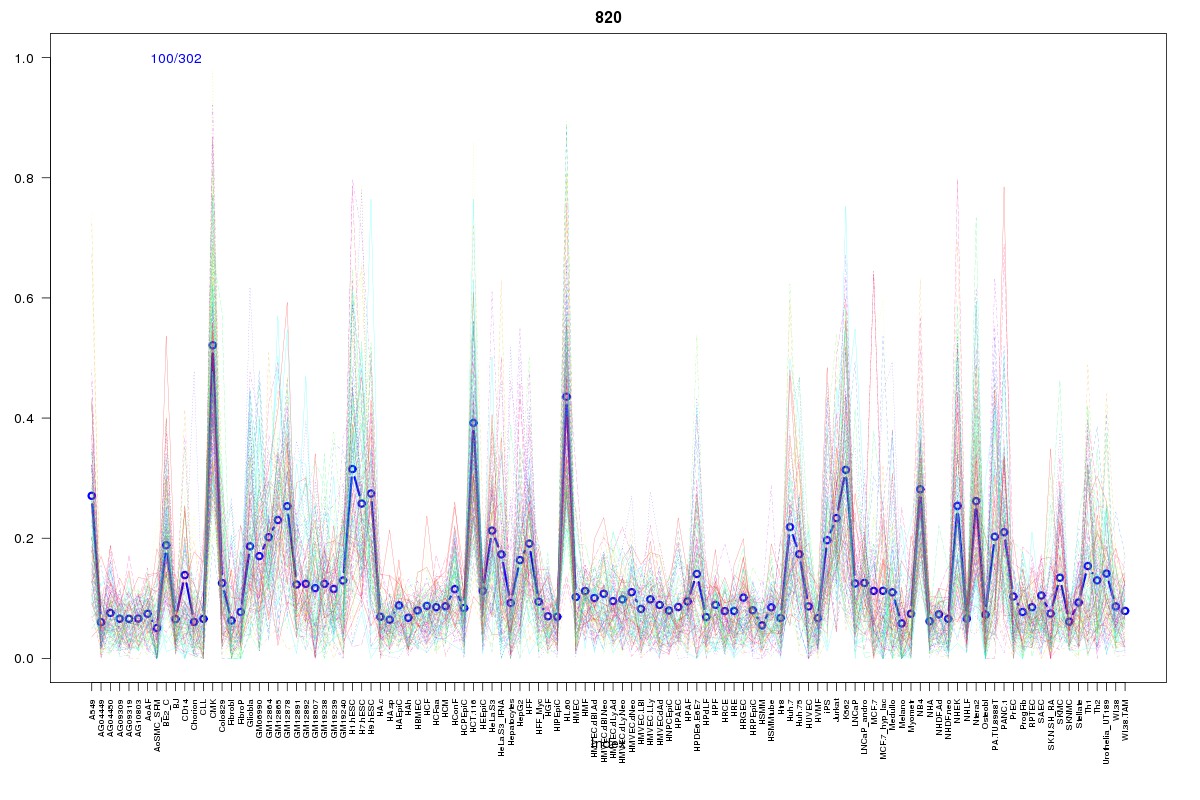 | 820 | 1 |
 | 626 | 1 |
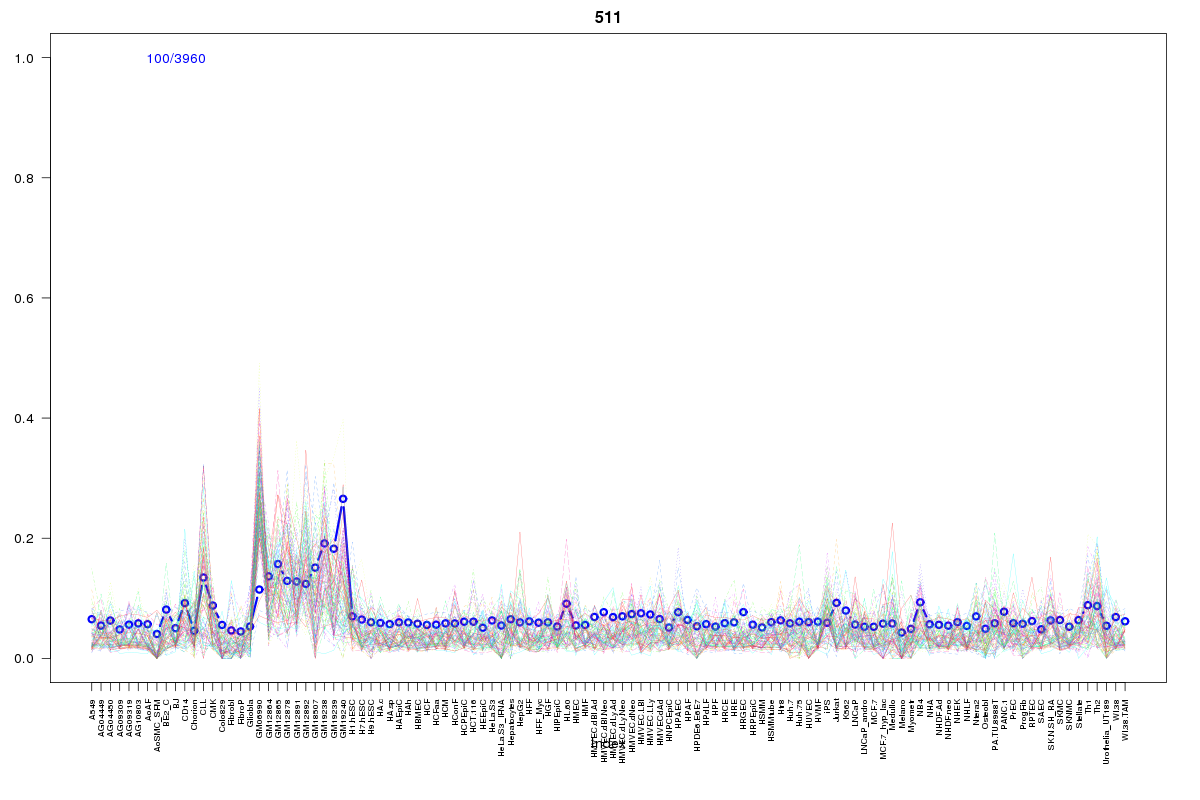 | 511 | 1 |
 | 770 | 1 |
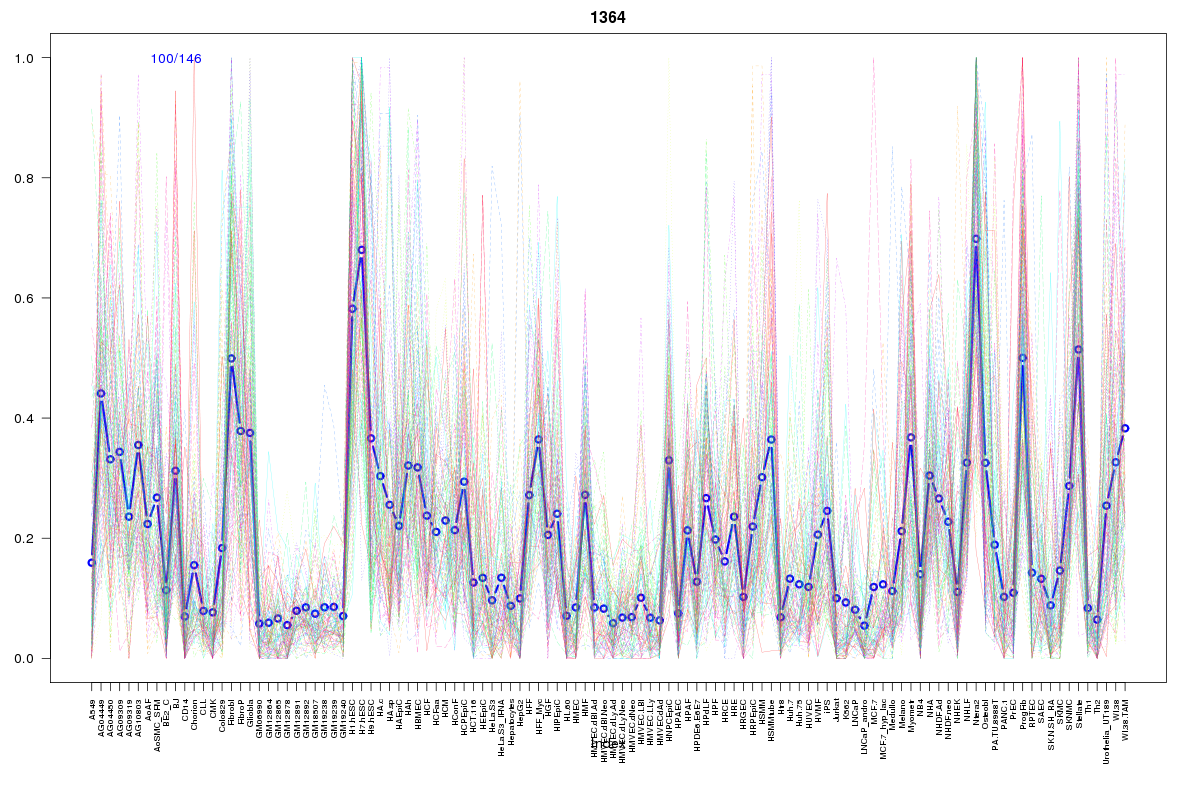 | 1364 | 1 |
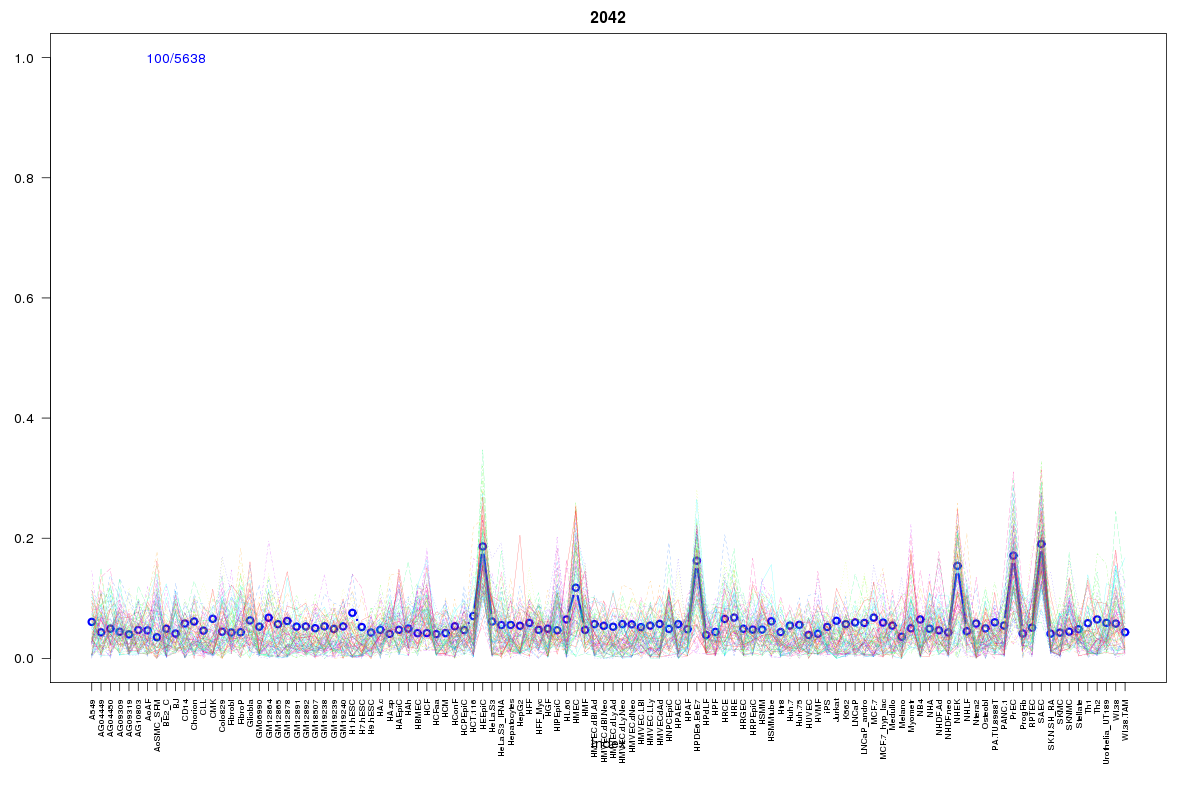 | 2042 | 1 |
 | 2186 | 1 |
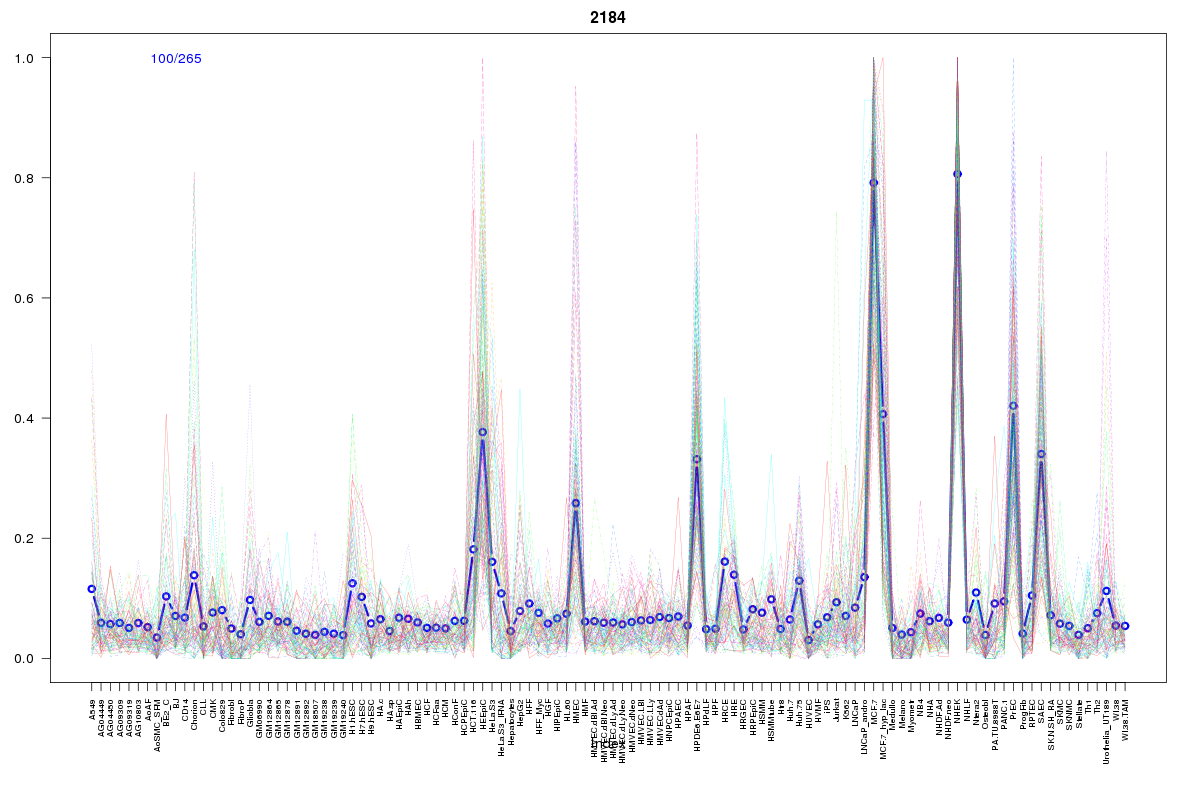 | 2184 | 1 |
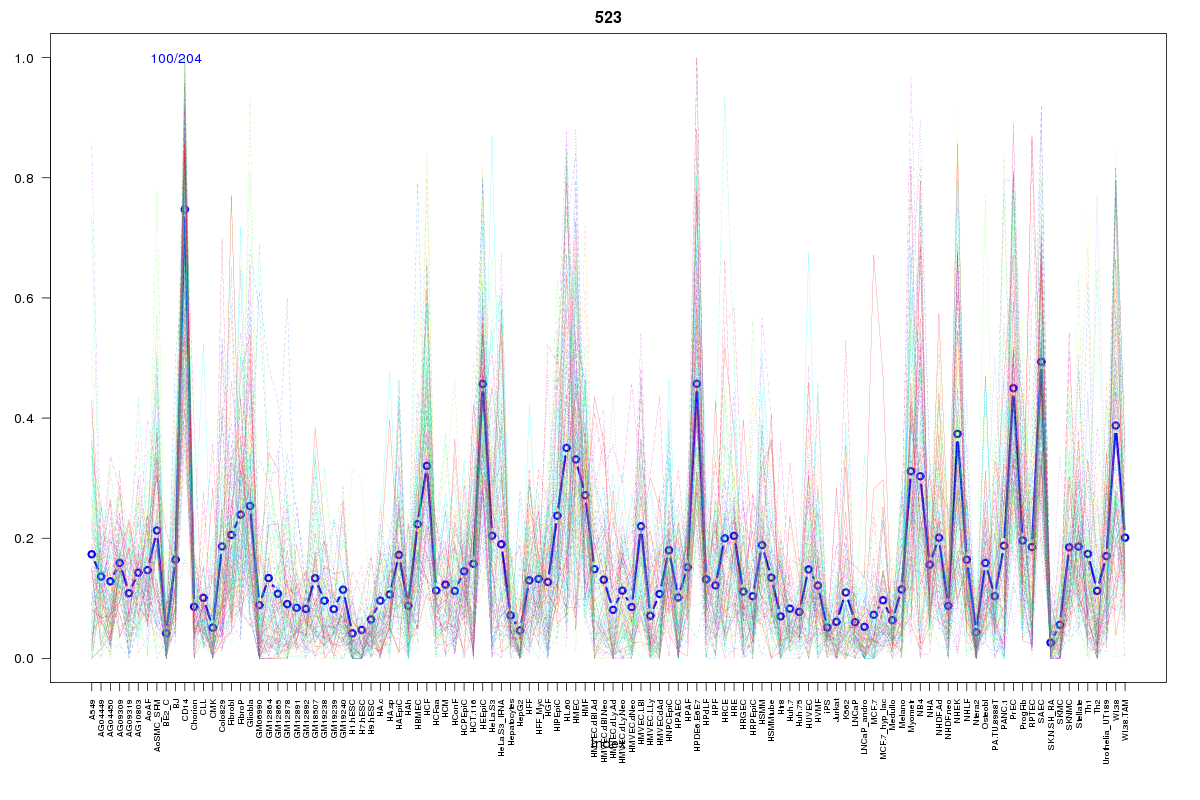 | 523 | 1 |
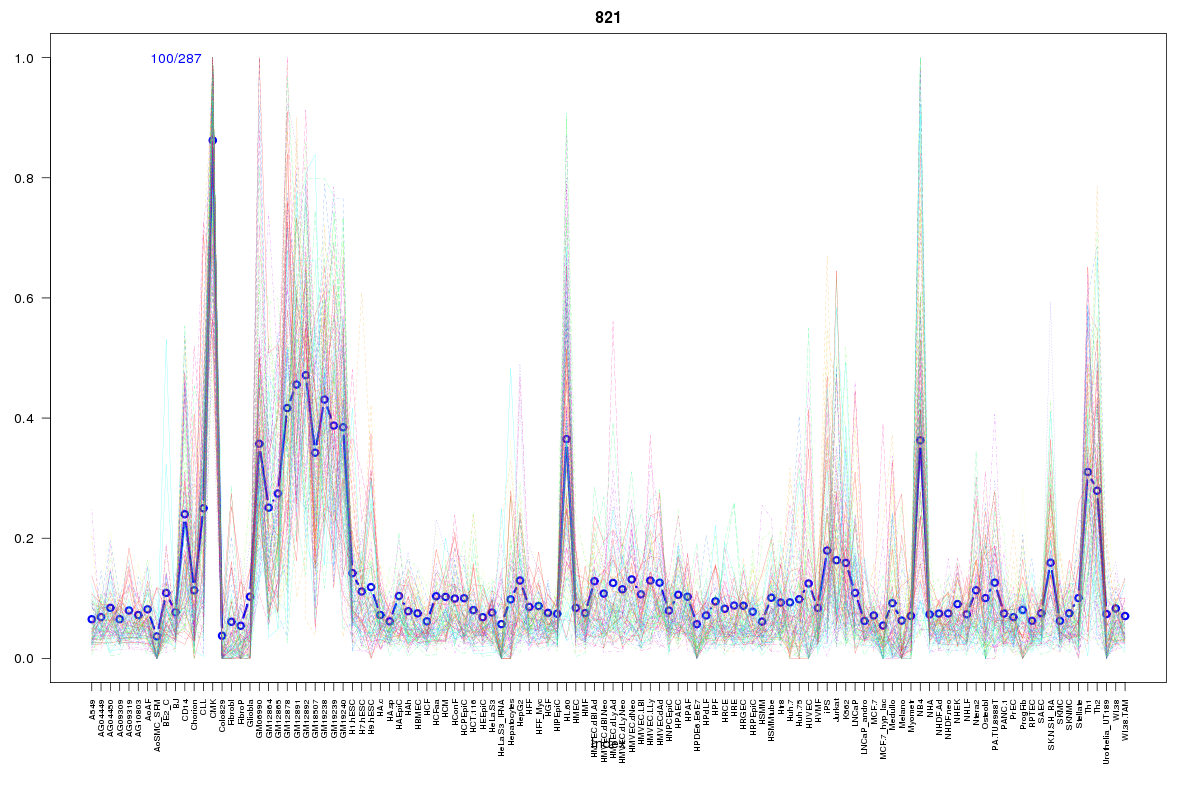 | 821 | 1 |
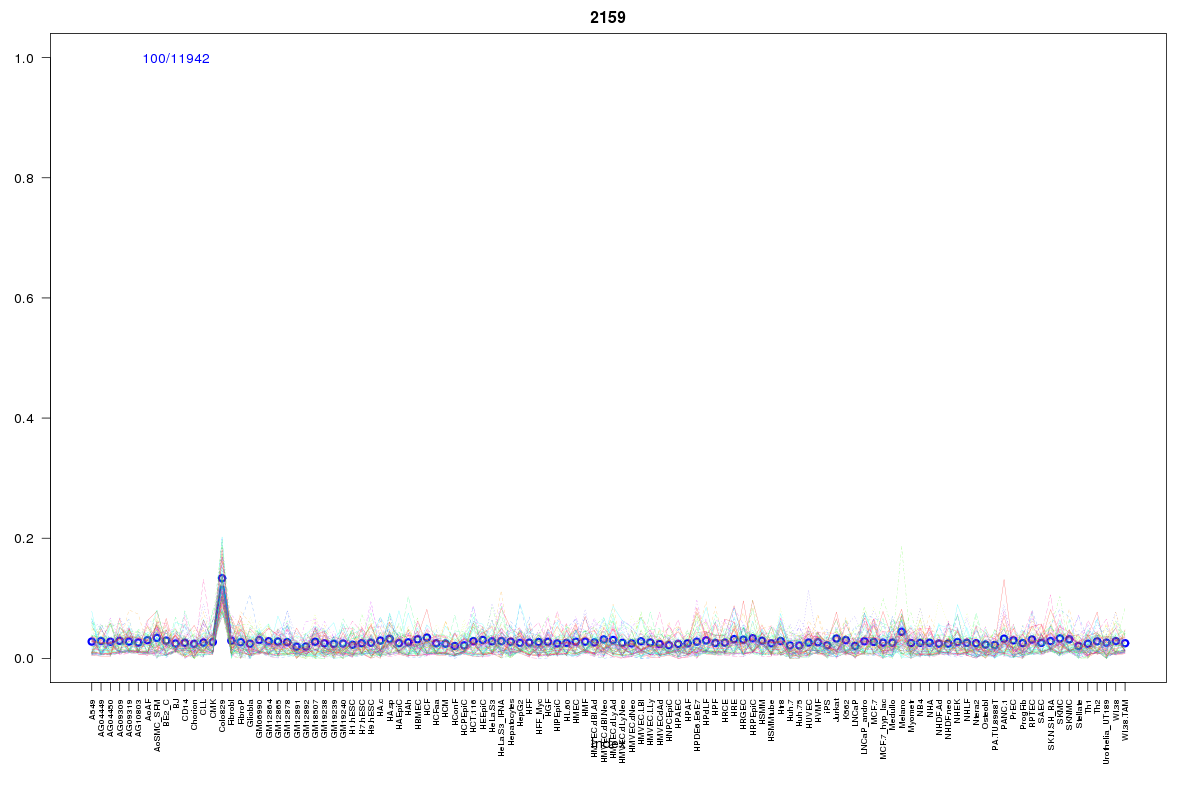 | 2159 | 1 |
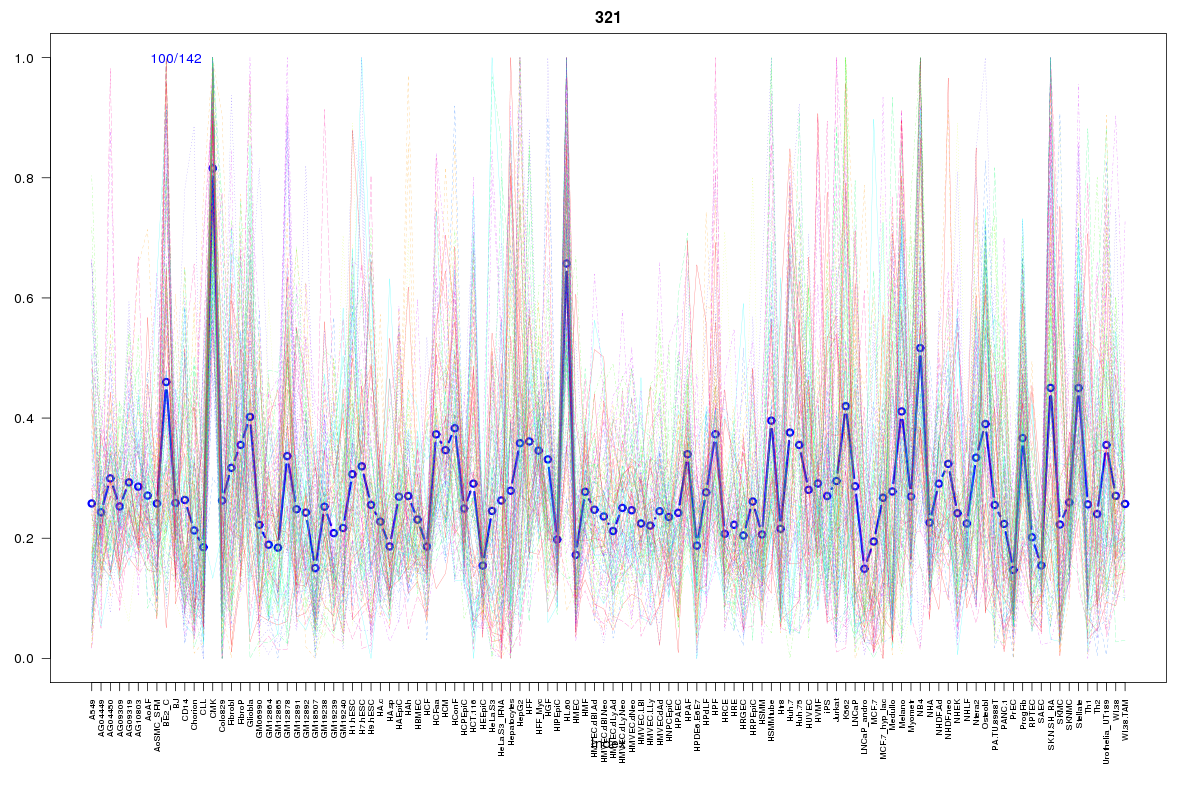 | 321 | 1 |
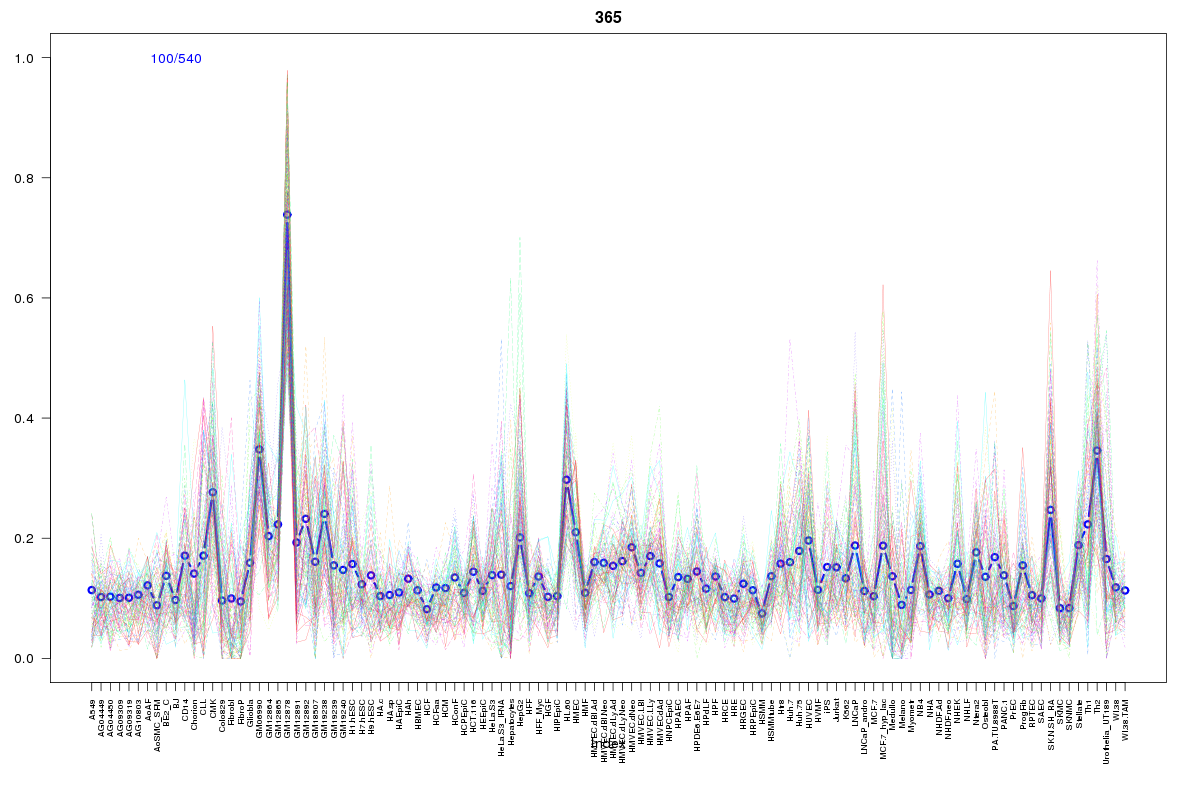 | 365 | 1 |
 | 860 | 1 |
 | 296 | 1 |
 | 1862 | 1 |
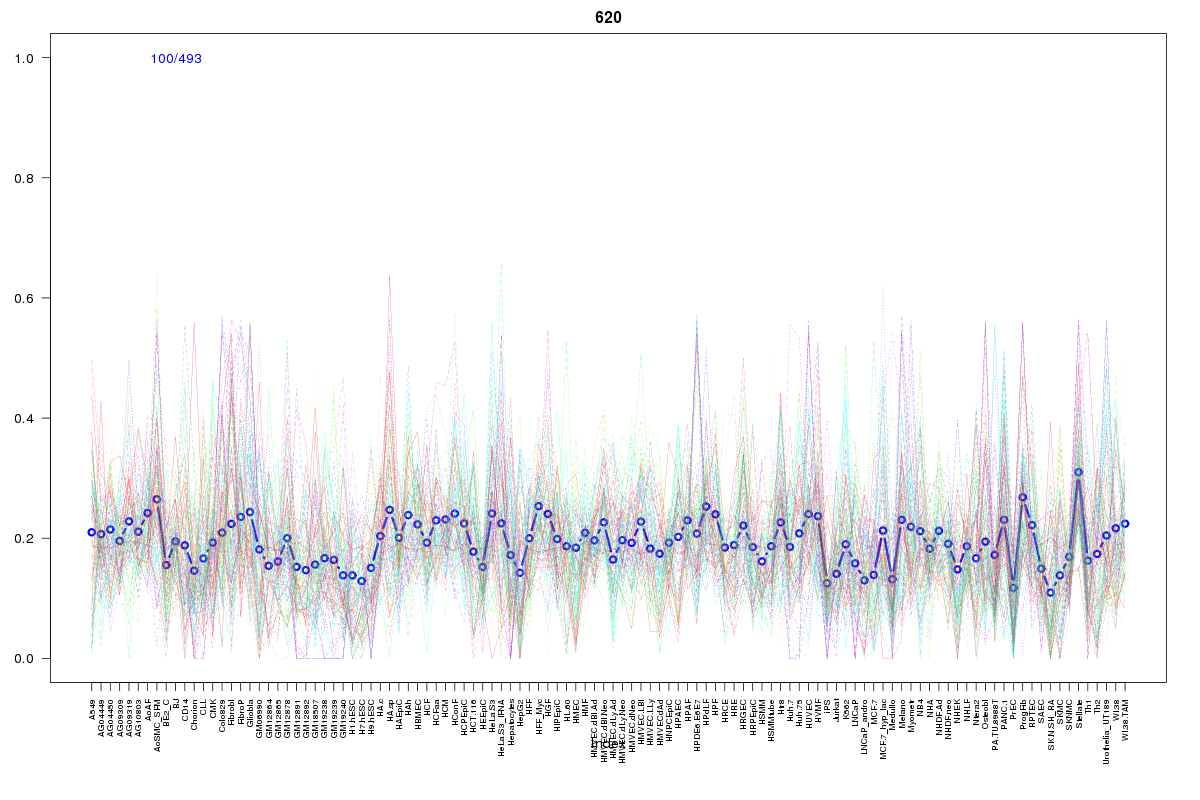 | 620 | 1 |
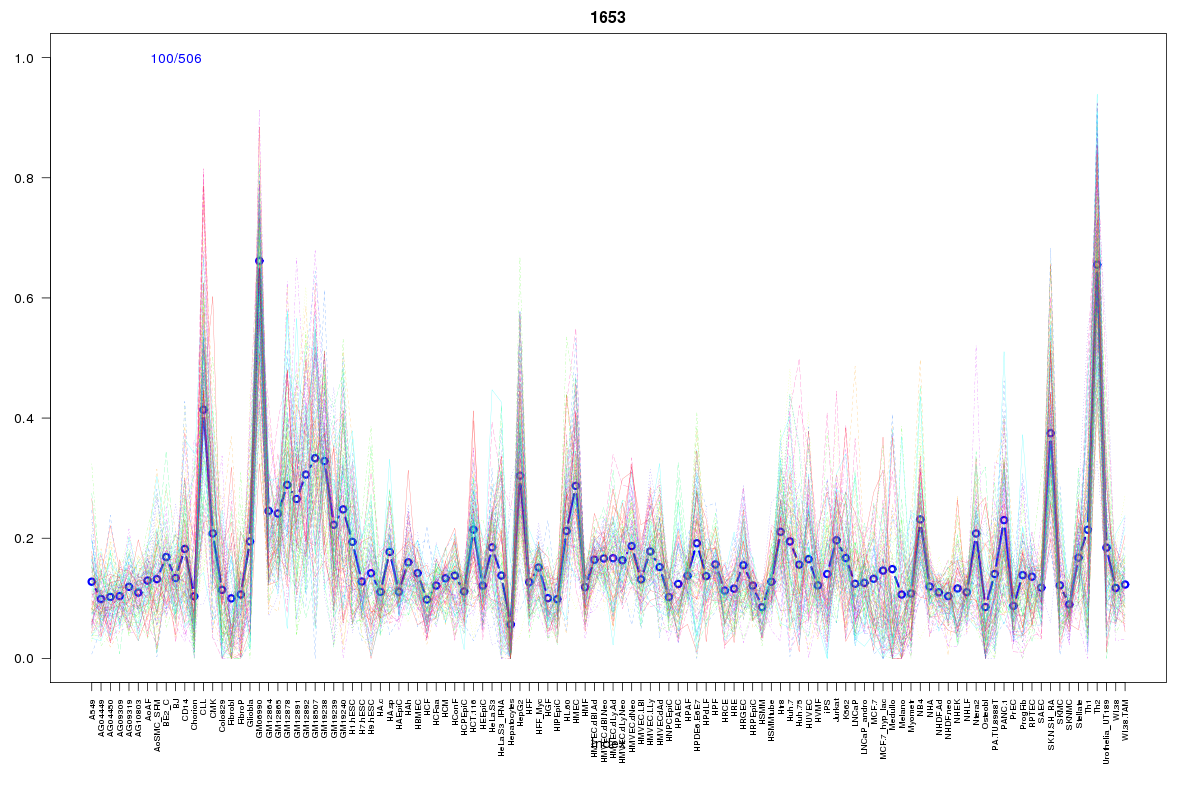 | 1653 | 1 |
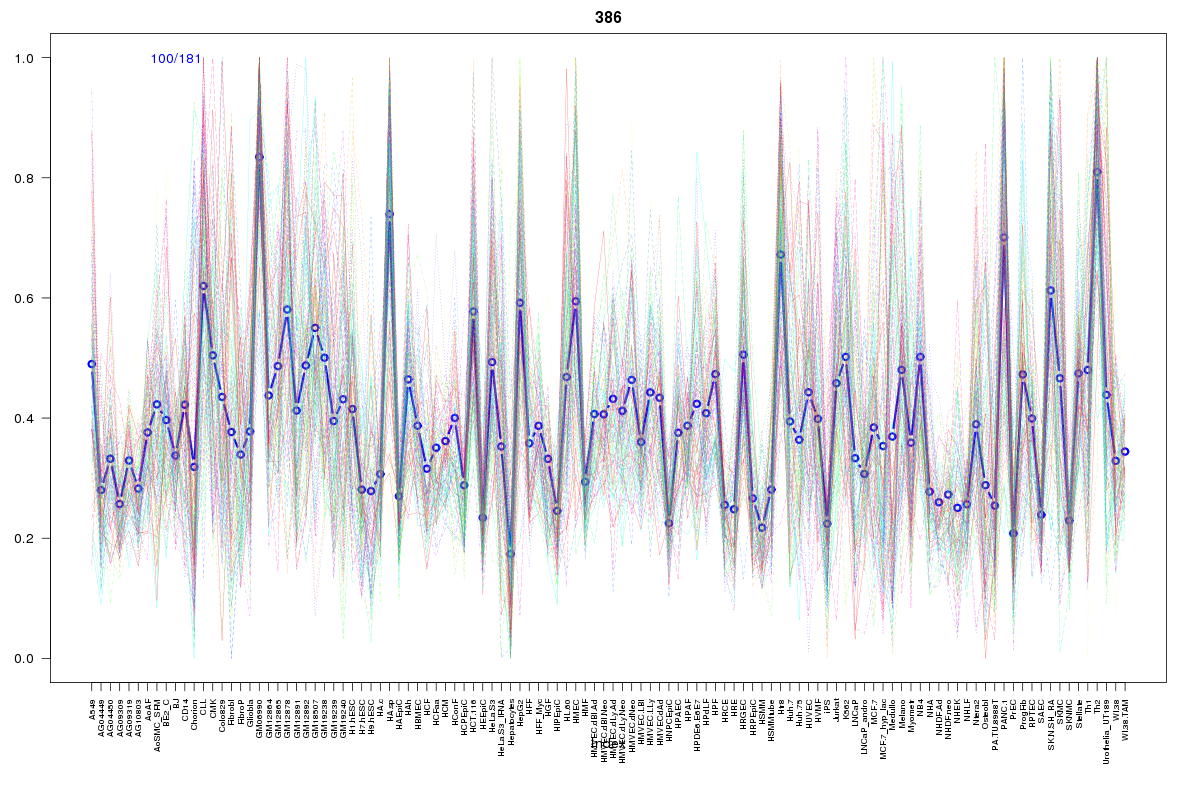 | 386 | 1 |
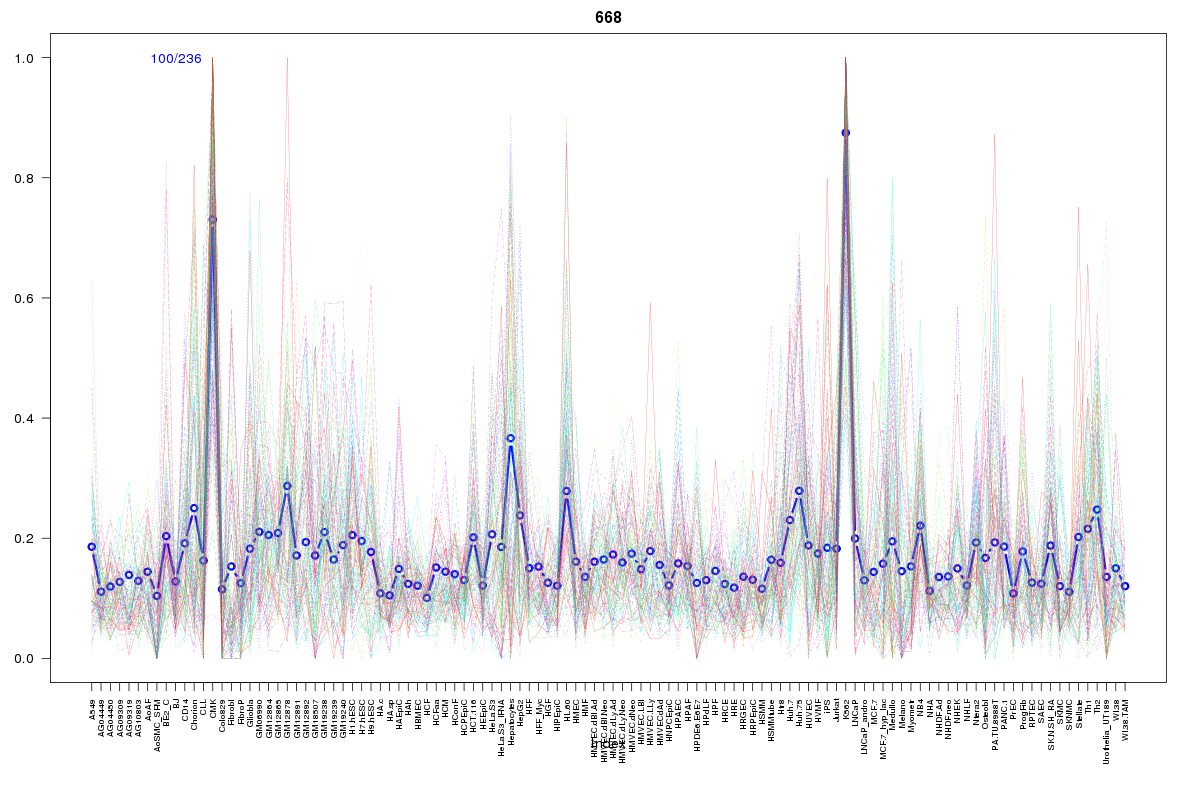 | 668 | 1 |
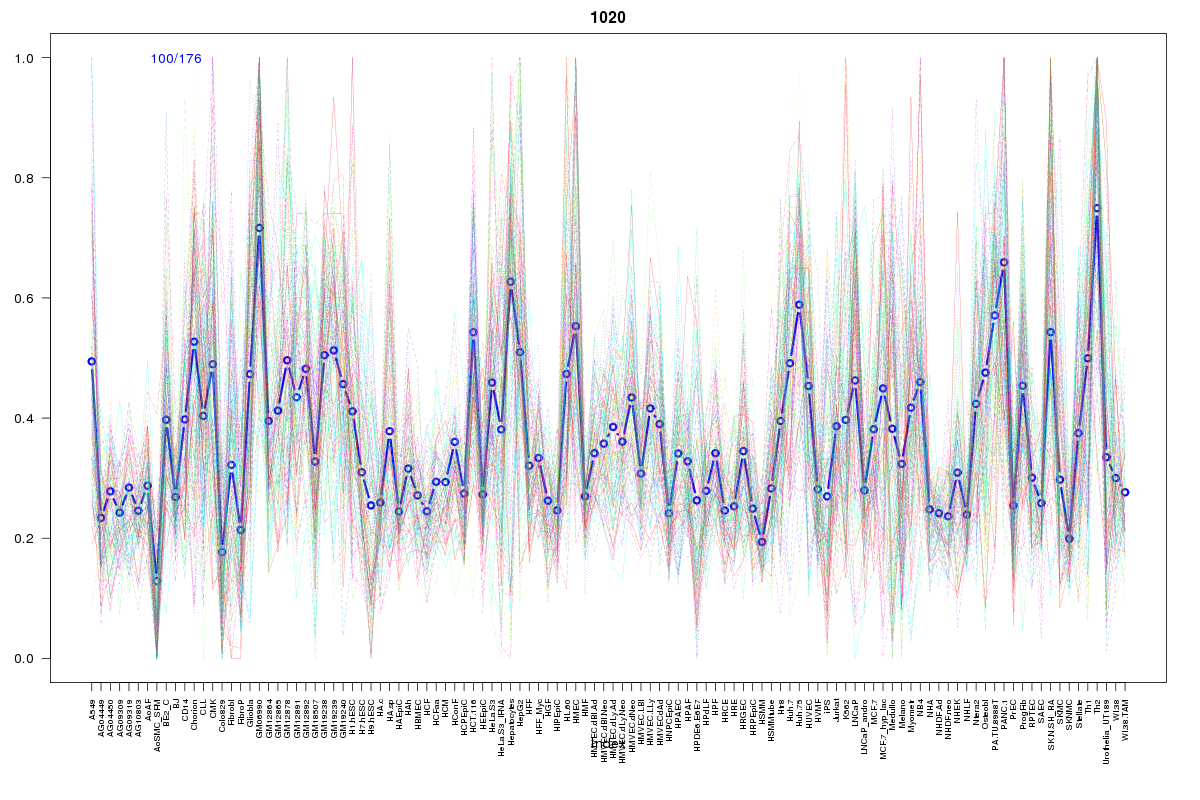 | 1020 | 1 |
Resources
BED file downloads
Connects to 40 DHS sitesTop 10 Correlated DHS Sites
p-values indiciate significant higher or lower correlation| Location | Cluster | P-value |
|---|---|---|
| chr1:159925400-159925550 | 2150 | 0 |
| chr1:159909280-159909430 | 1605 | 0.001 |
| chr1:159973900-159974050 | 2150 | 0.002 |
| chr1:160012880-160013030 | 2150 | 0.002 |
| chr1:160012725-160012875 | 1605 | 0.002 |
| chr1:159992860-159993010 | 1862 | 0.002 |
| chr1:159924020-159924170 | 523 | 0.003 |
| chr1:159982040-159982190 | 1605 | 0.003 |
| chr1:159914100-159914250 | 2150 | 0.004 |
| chr1:159916685-159916835 | 1605 | 0.005 |
| chr1:159919320-159919470 | 2186 | 0.005 |
External Databases
UCSCEnsembl (ENSG00000162723)