Gene: GPSM1
chr9: 139221931-139254057Expression Profile
(log scale)
Graphical Connections
Distribution of linked clusters:
You may find it interesting if many of the connected DHS sites belong to the same cluster.| Cluster Profile | Cluster ID | Number of DHS sites in this cluster |
|---|---|---|
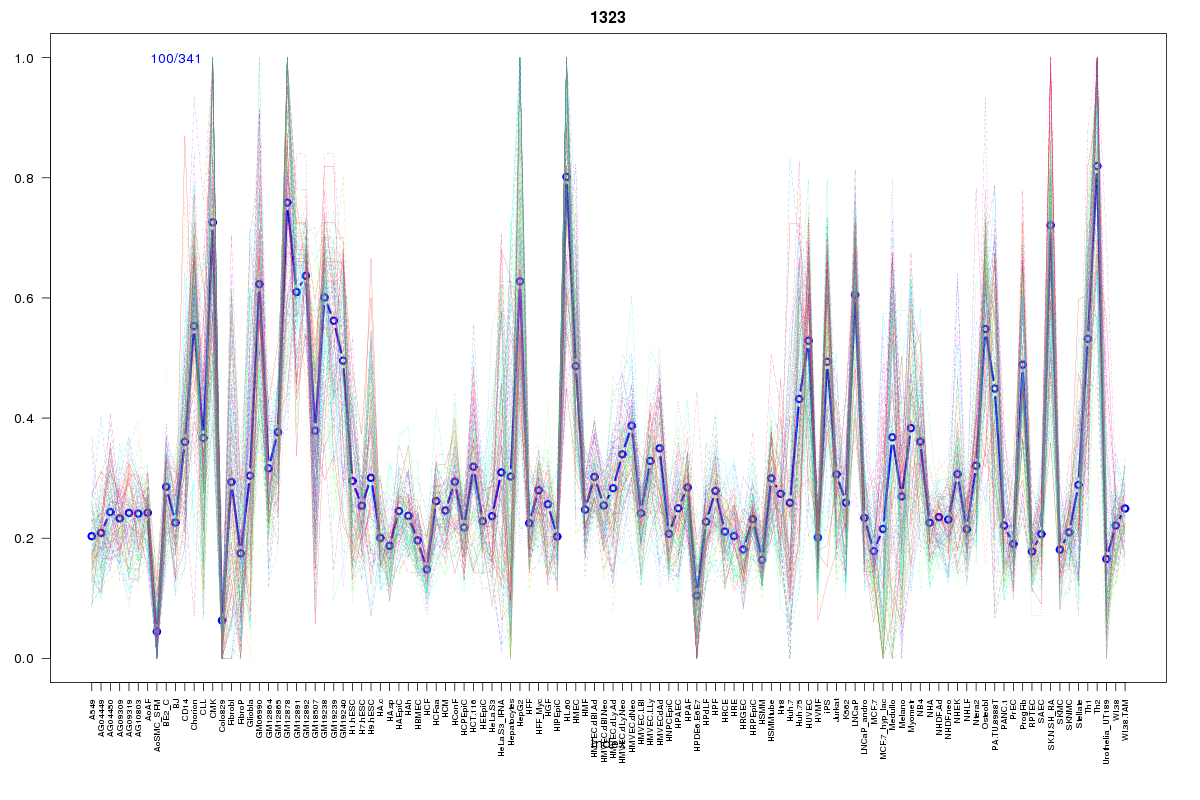 | 1323 | 3 |
 | 1078 | 2 |
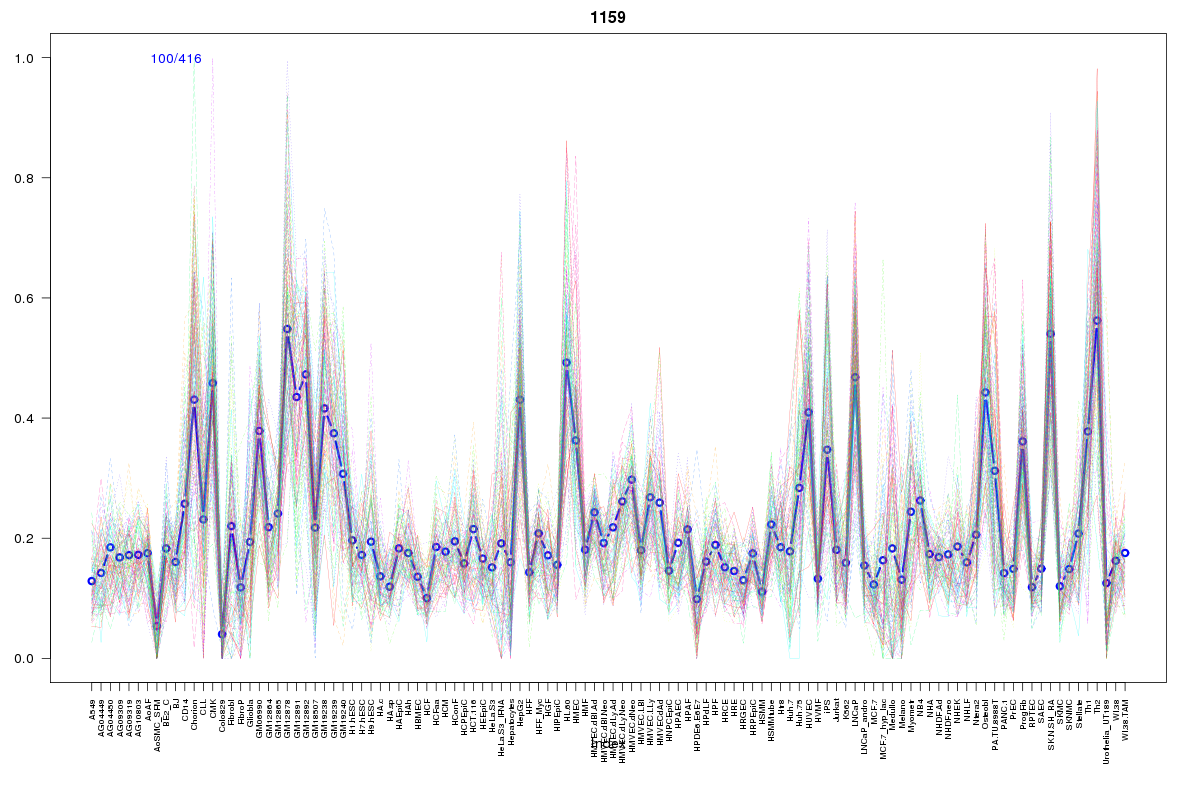 | 1159 | 2 |
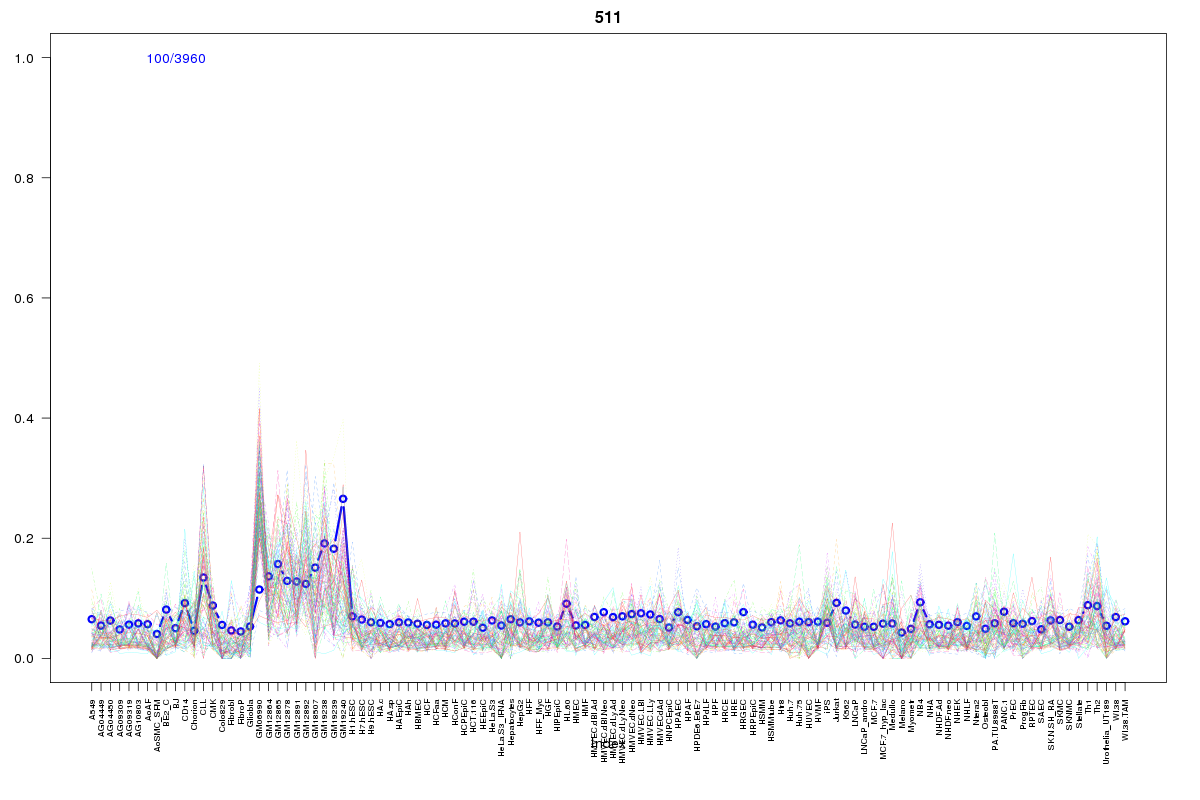 | 511 | 2 |
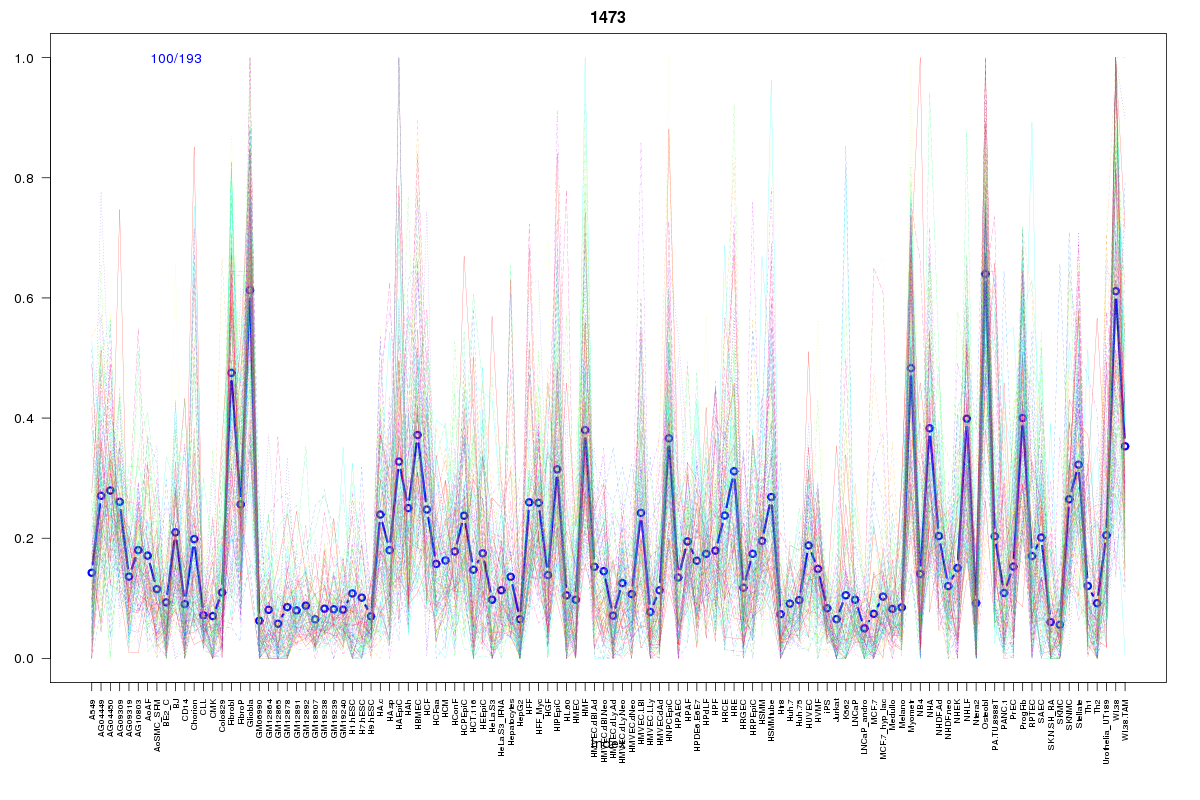 | 1473 | 1 |
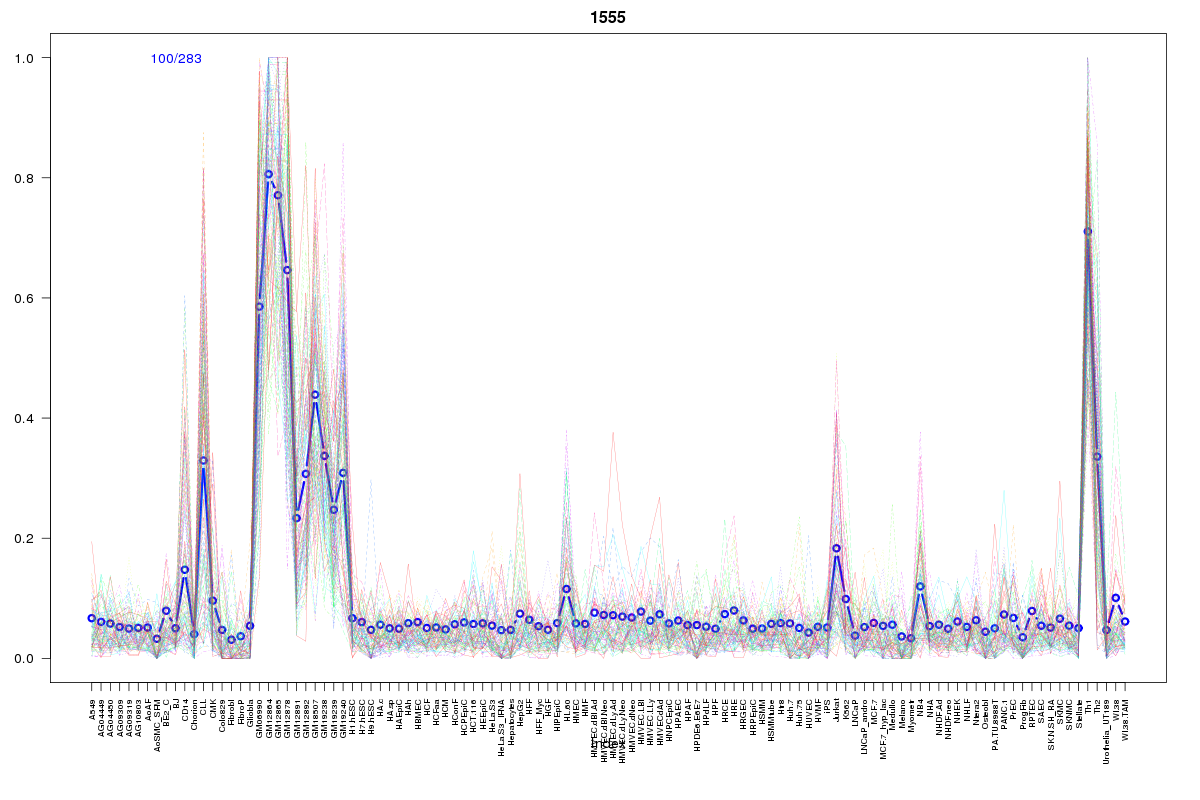 | 1555 | 1 |
 | 2279 | 1 |
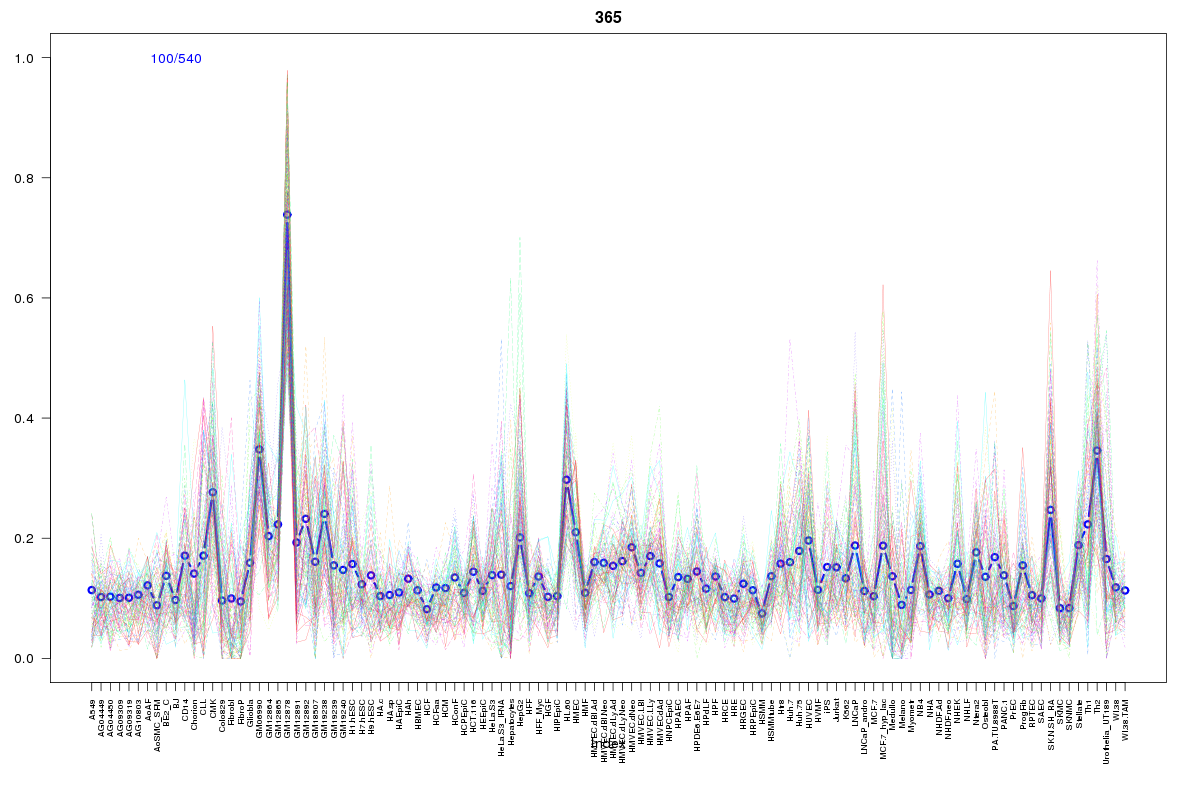 | 365 | 1 |
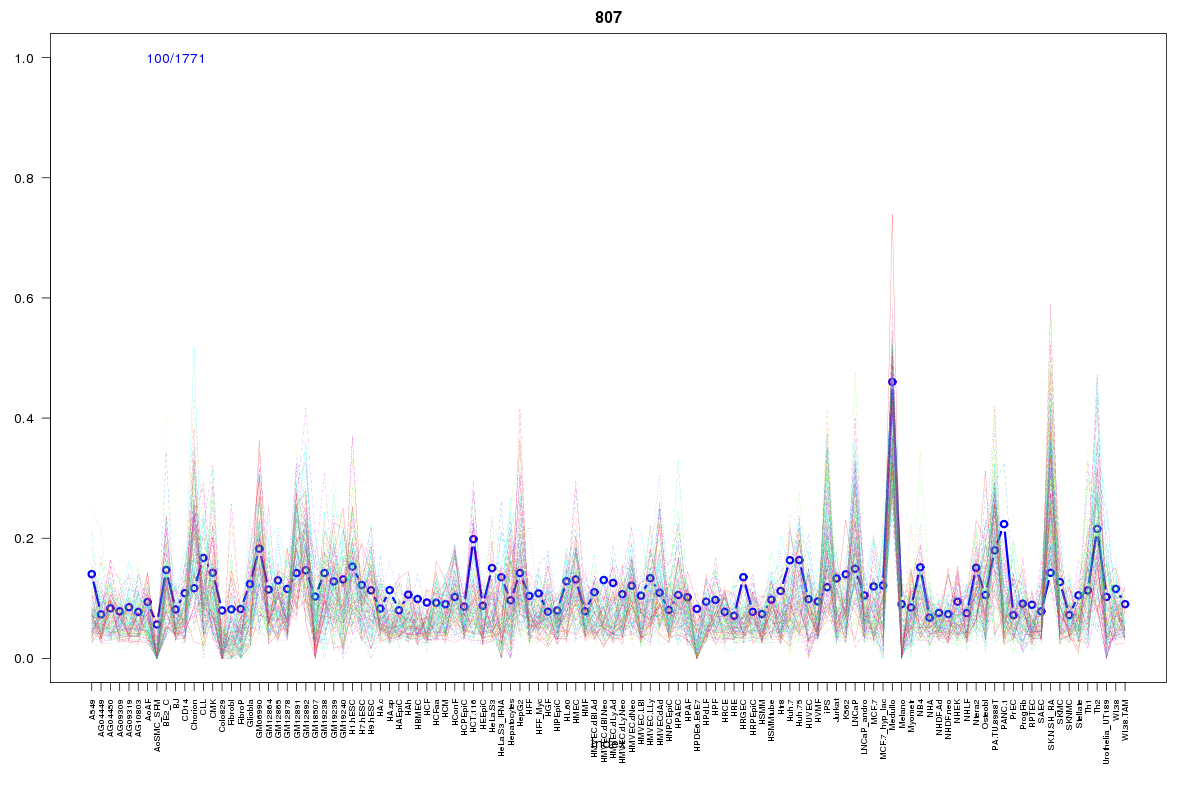 | 807 | 1 |
 | 570 | 1 |
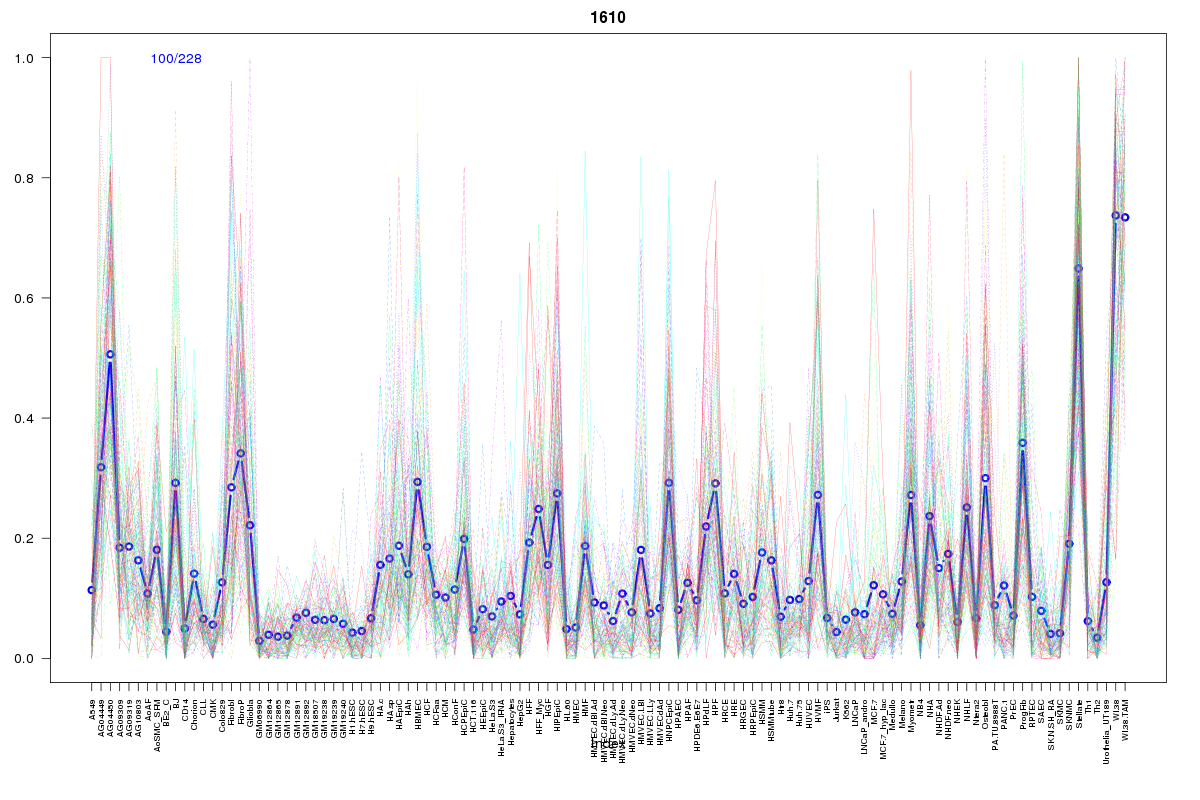 | 1610 | 1 |
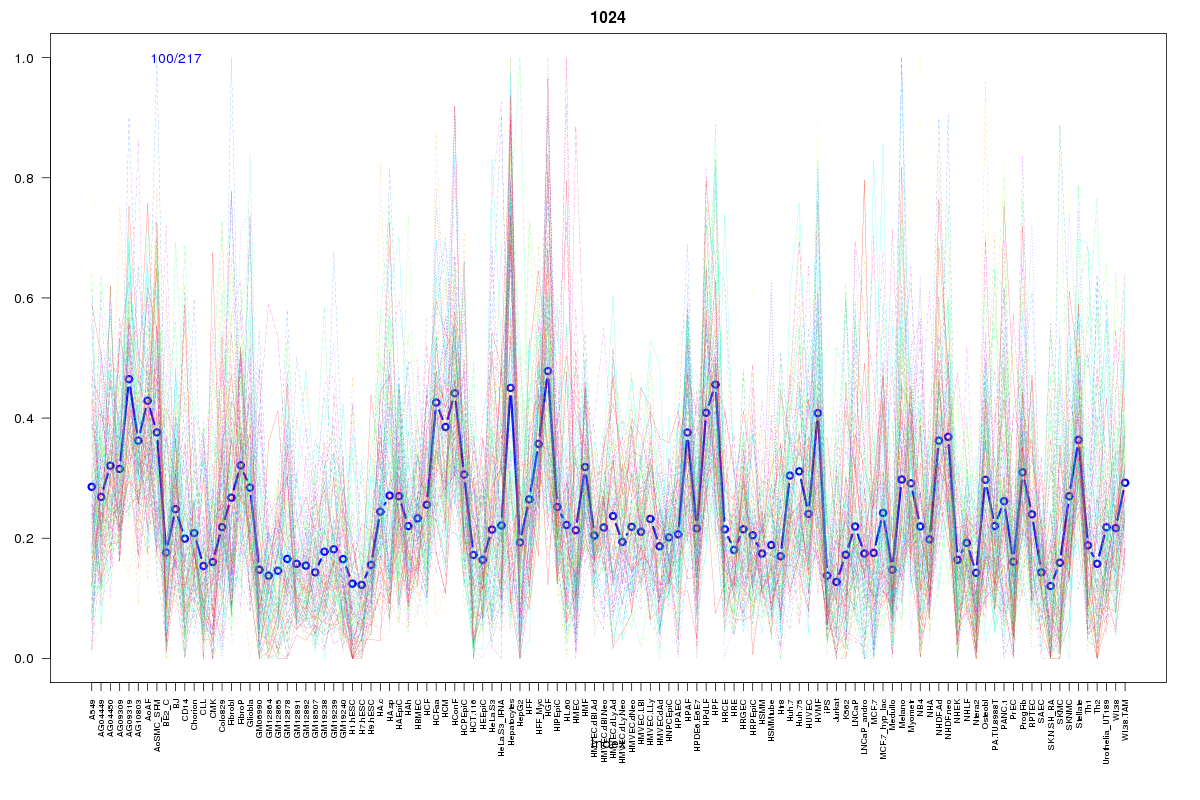 | 1024 | 1 |
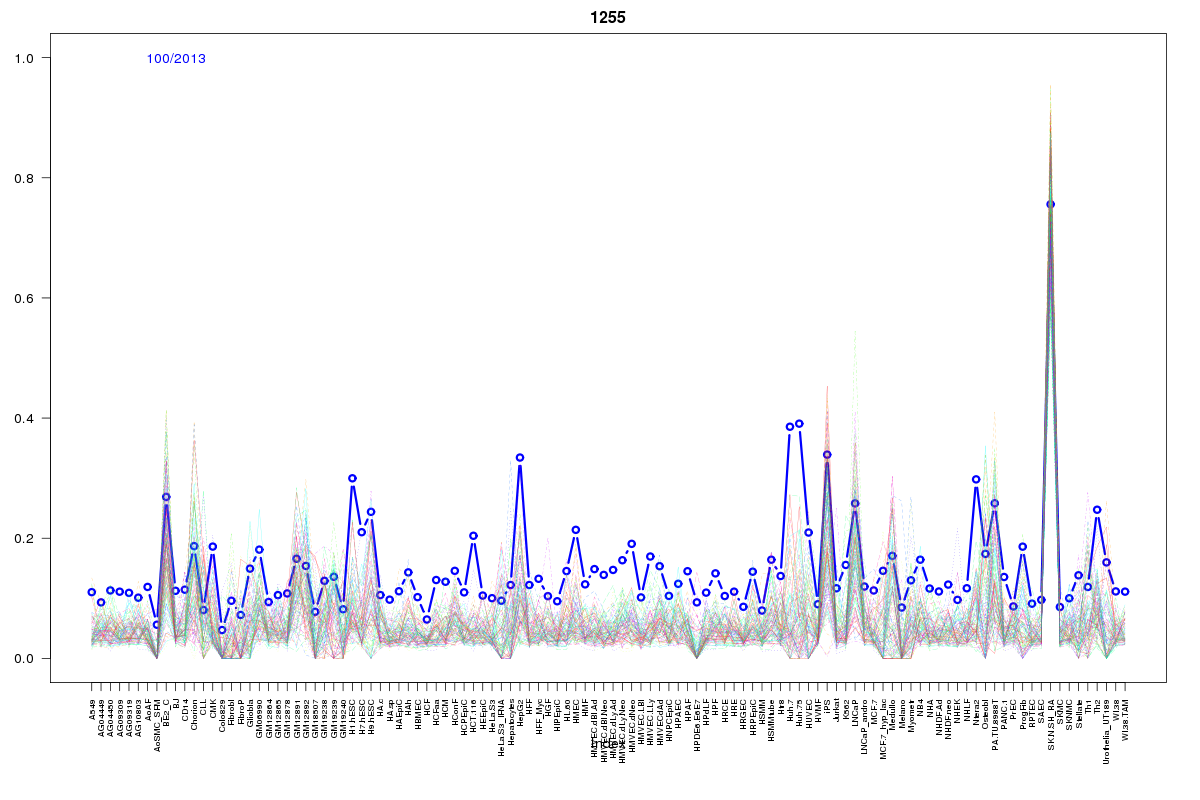 | 1255 | 1 |
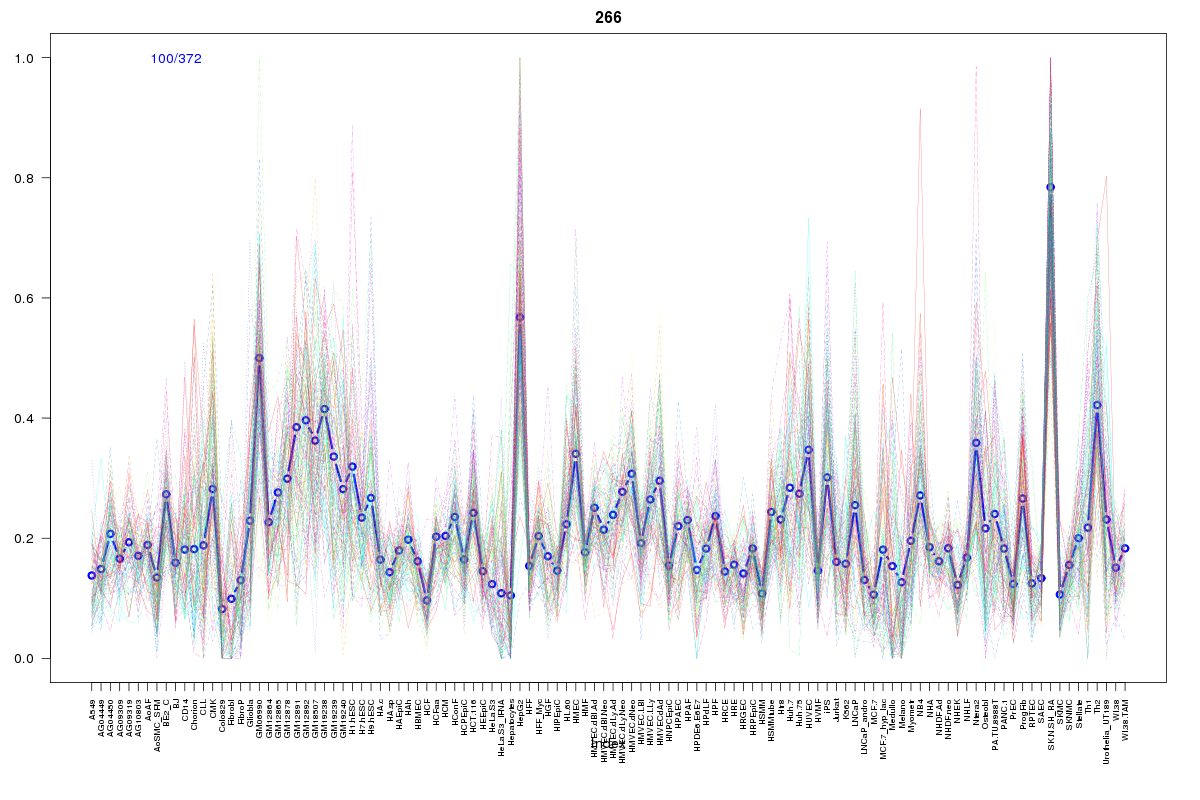 | 266 | 1 |
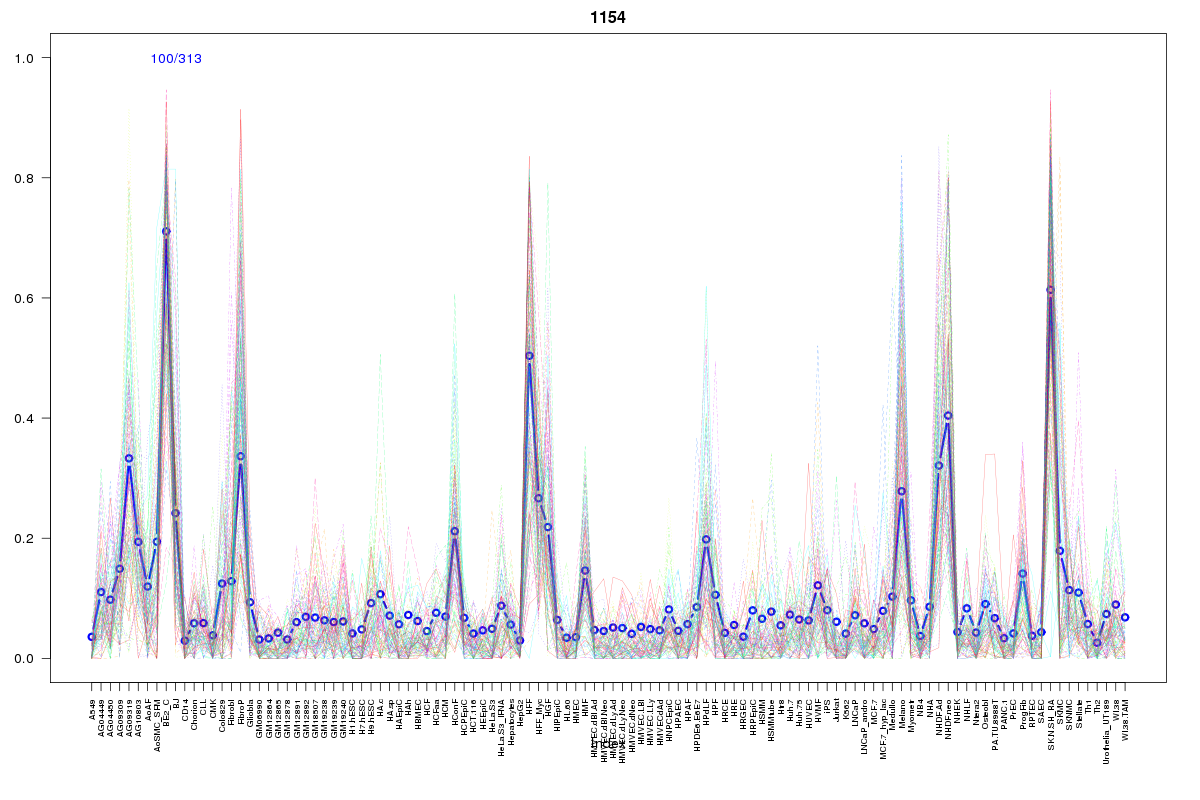 | 1154 | 1 |
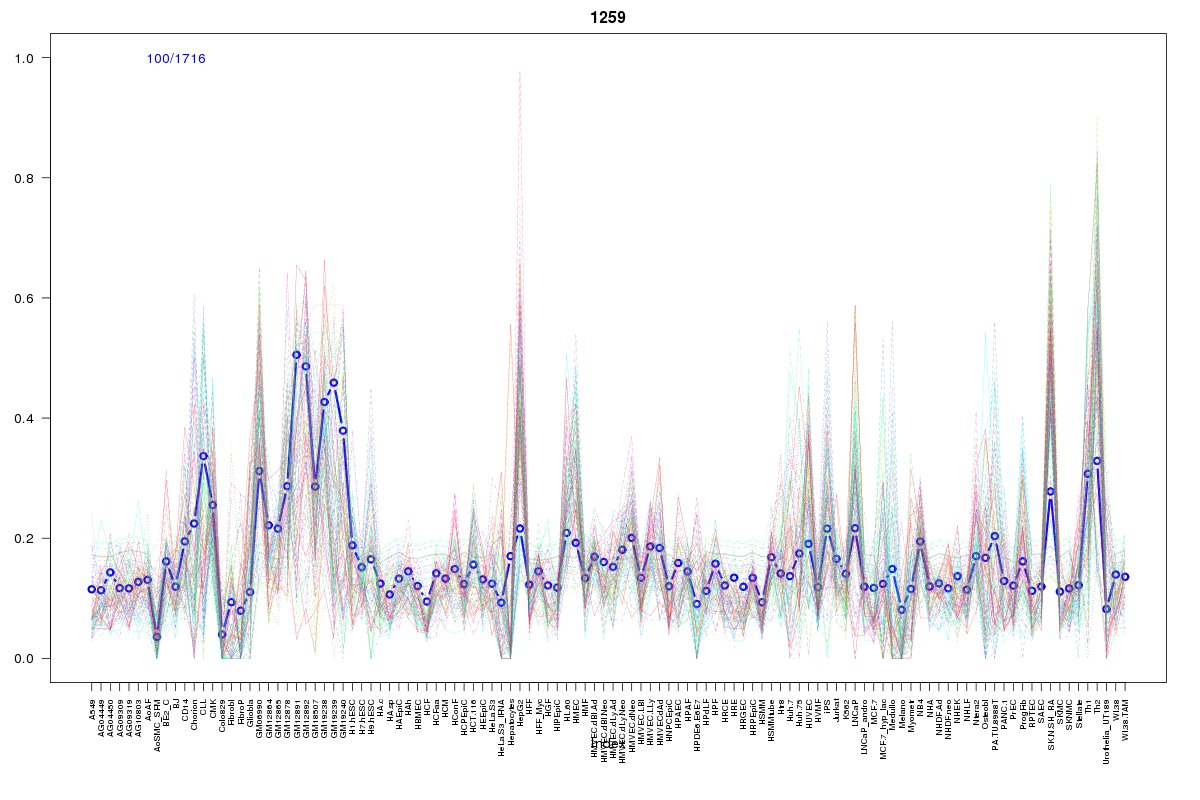 | 1259 | 1 |
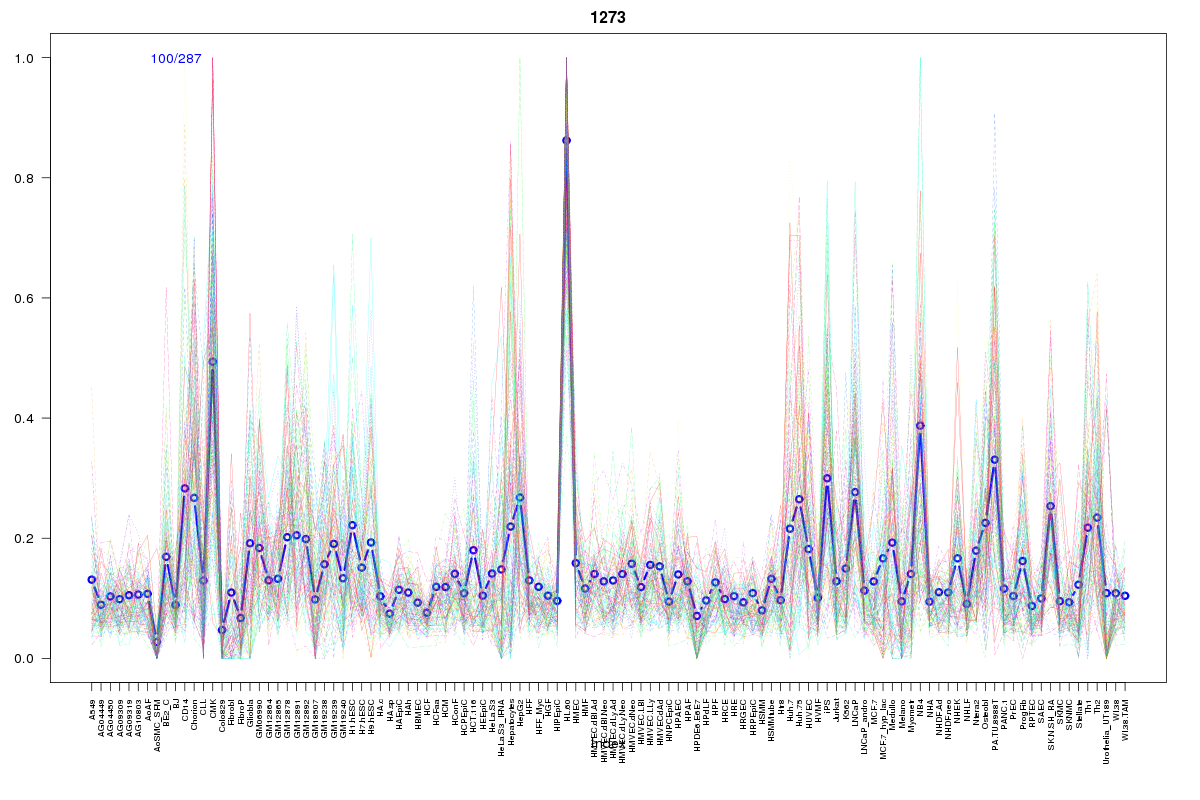 | 1273 | 1 |
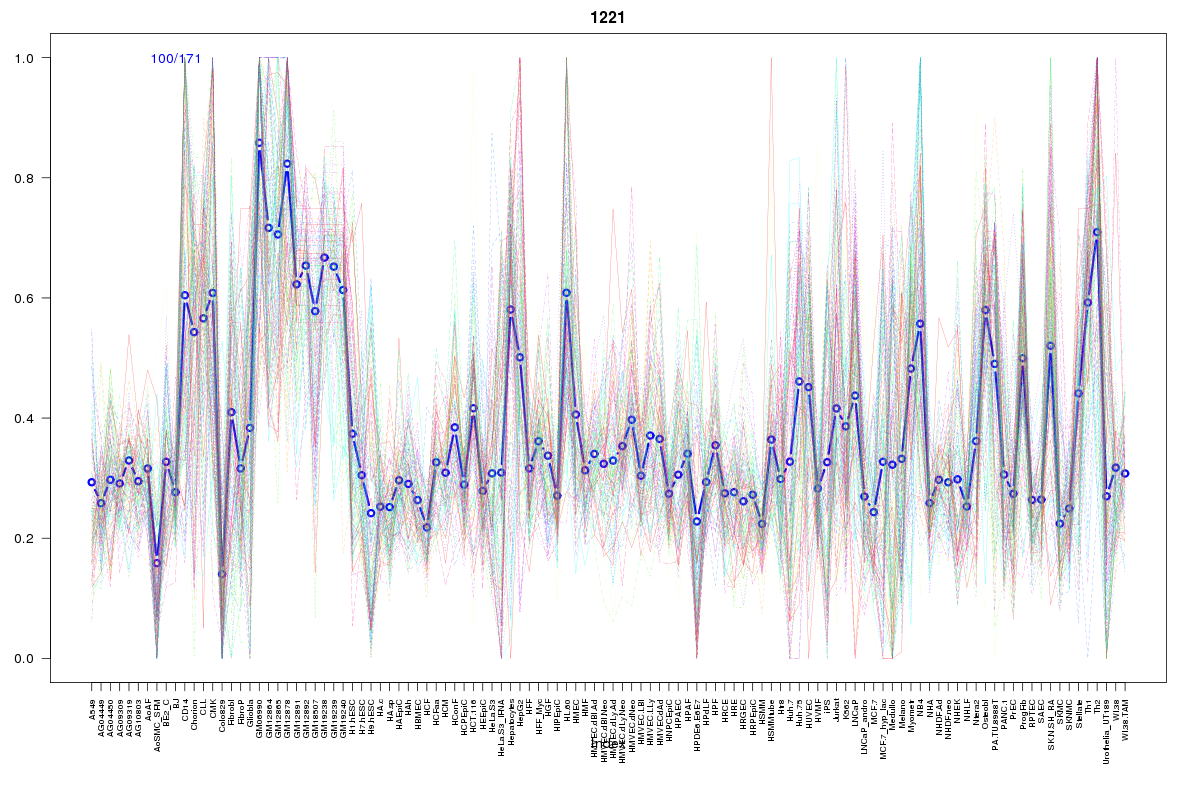 | 1221 | 1 |
 | 770 | 1 |
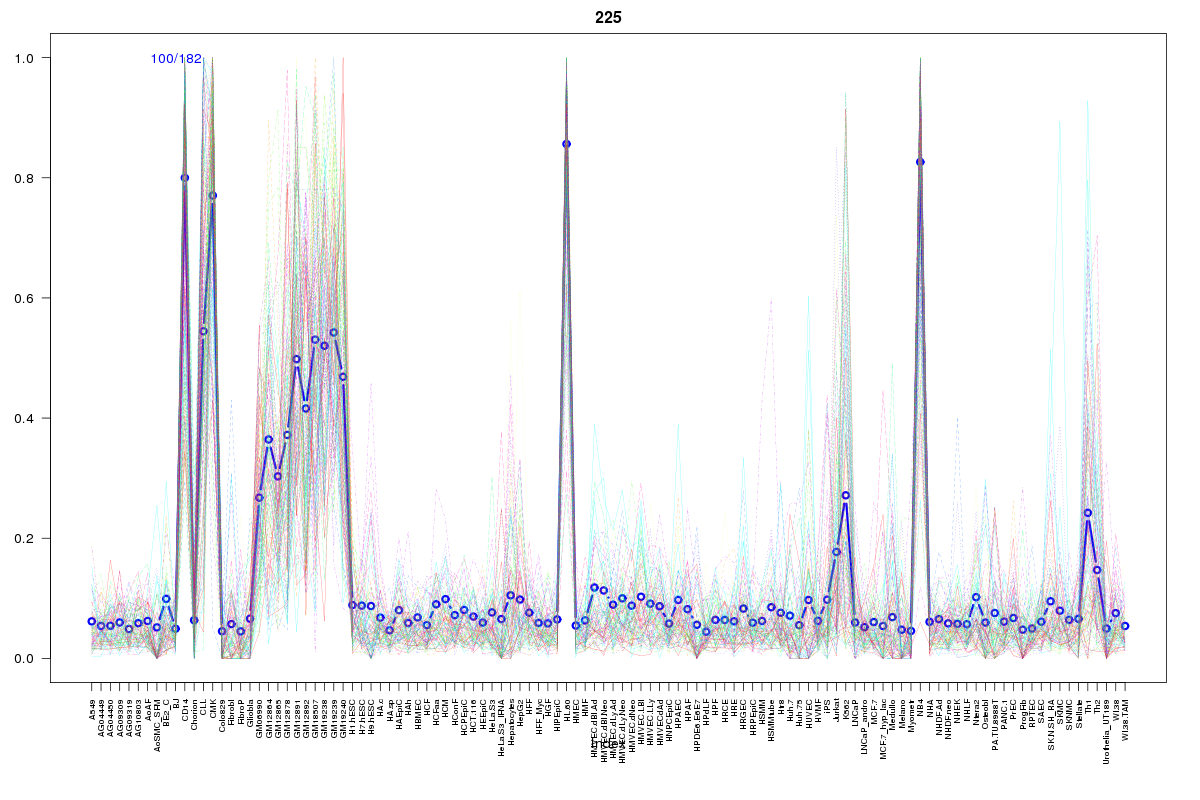 | 225 | 1 |
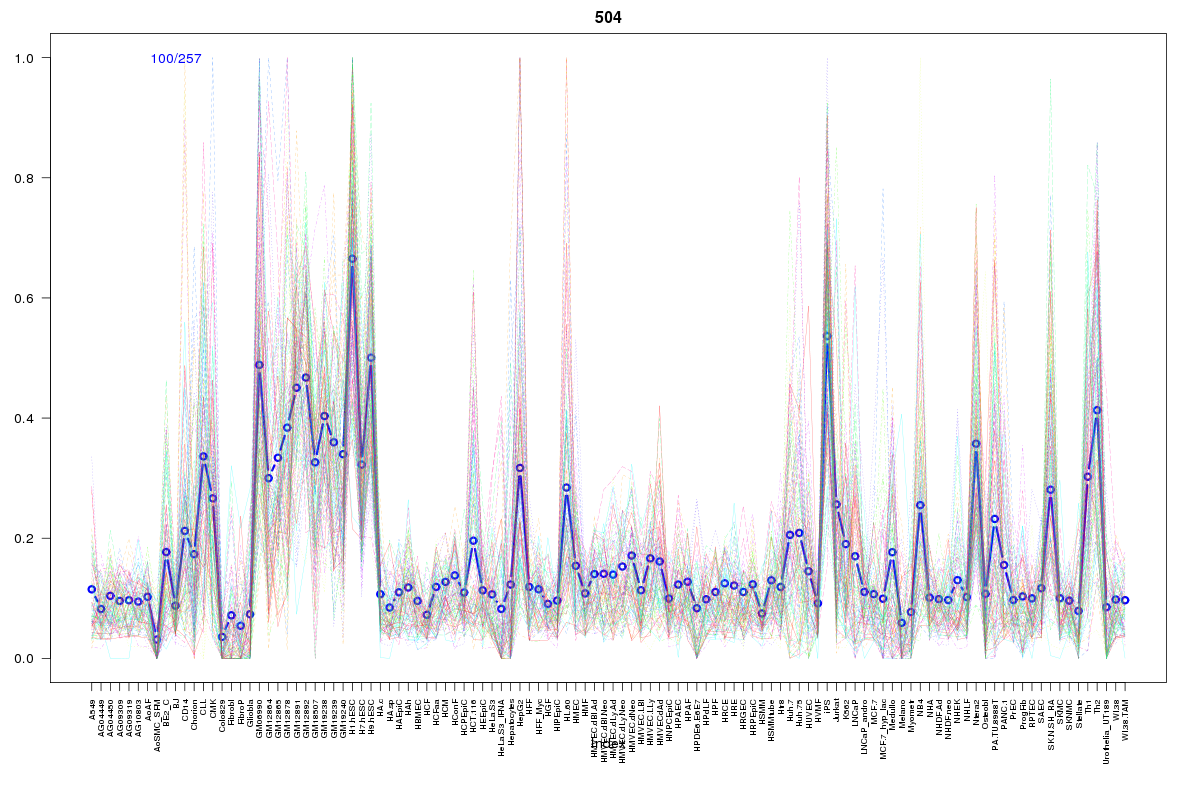 | 504 | 1 |
 | 429 | 1 |
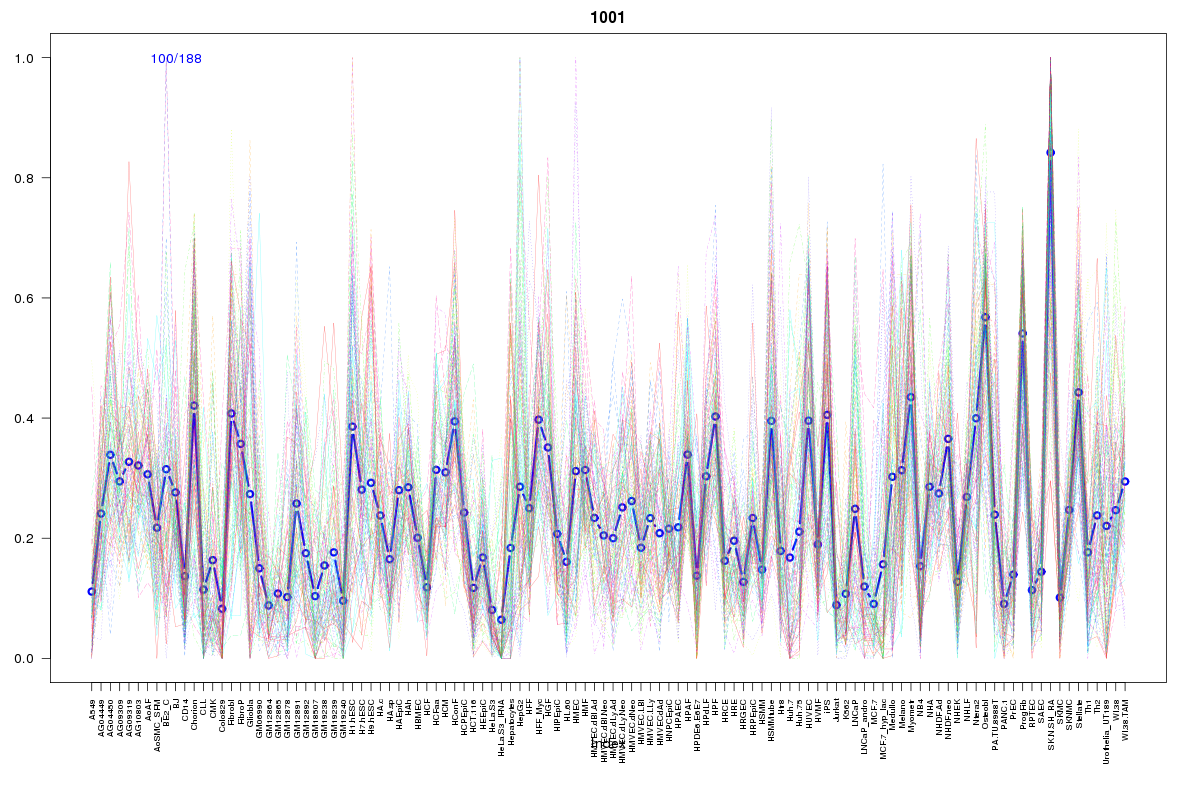 | 1001 | 1 |
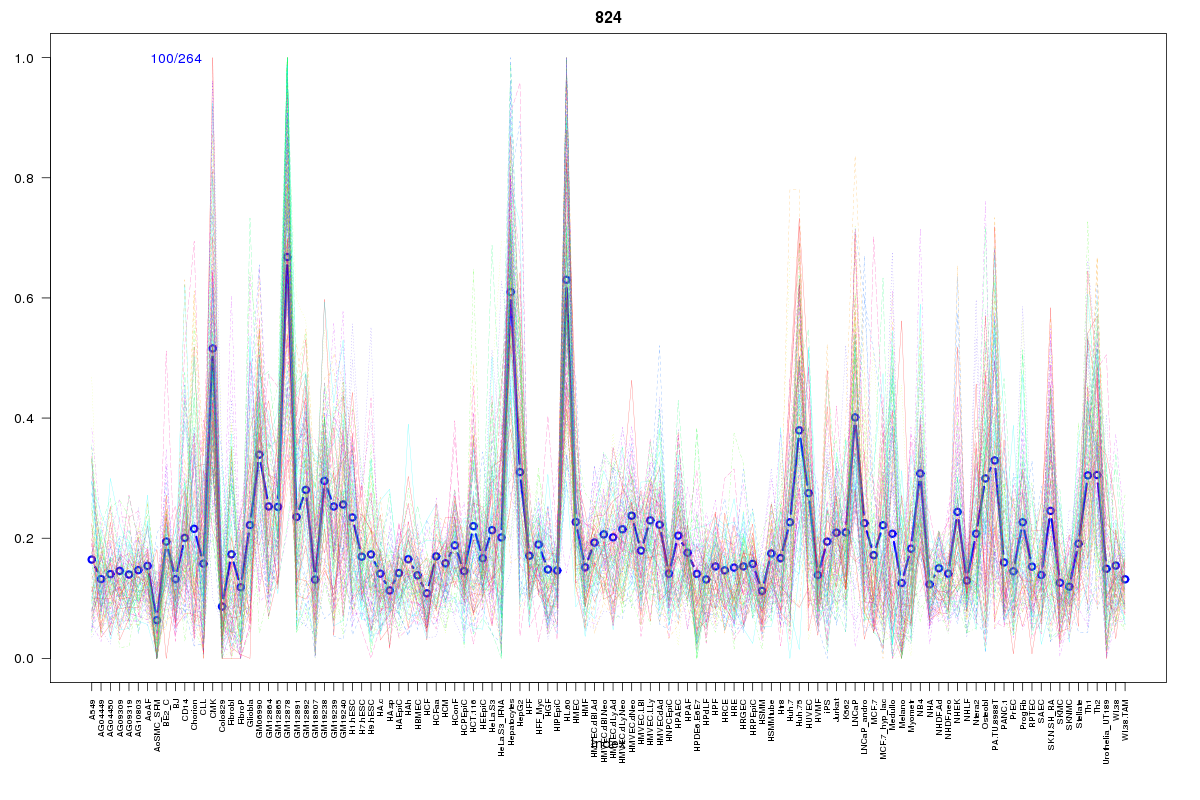 | 824 | 1 |
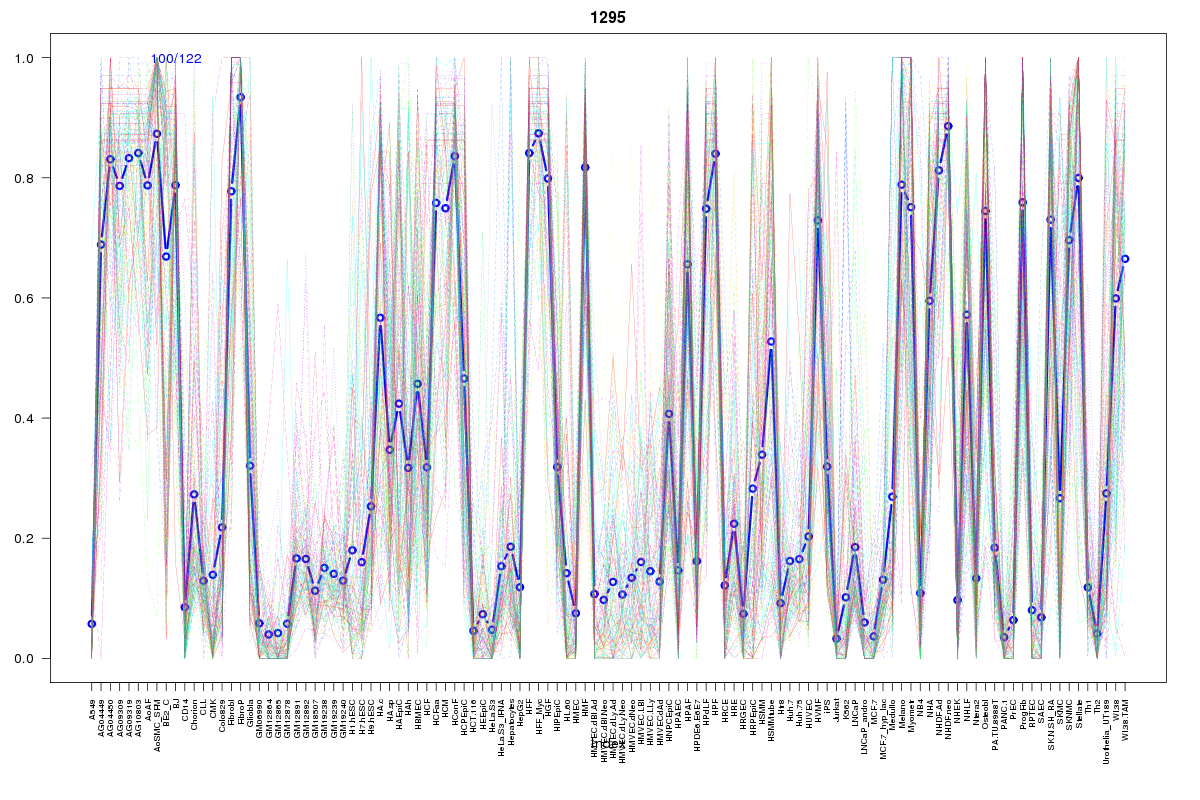 | 1295 | 1 |
 | 1422 | 1 |
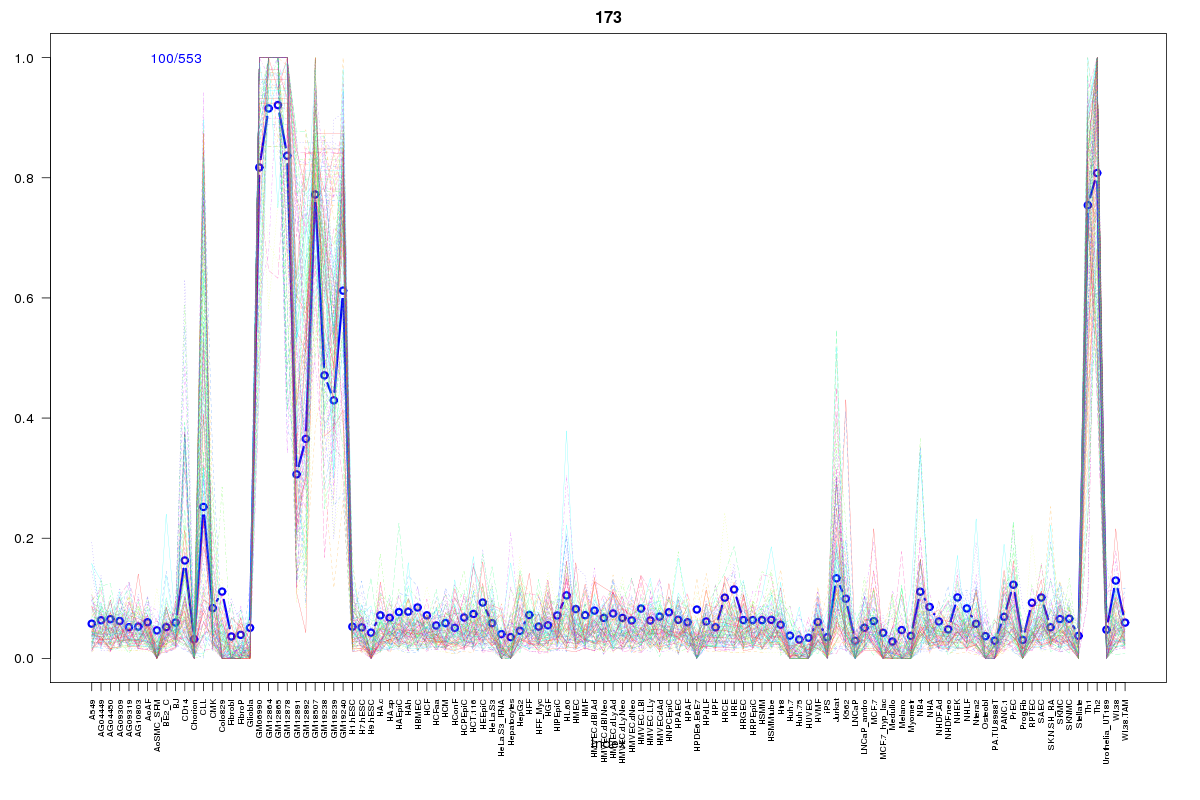 | 173 | 1 |
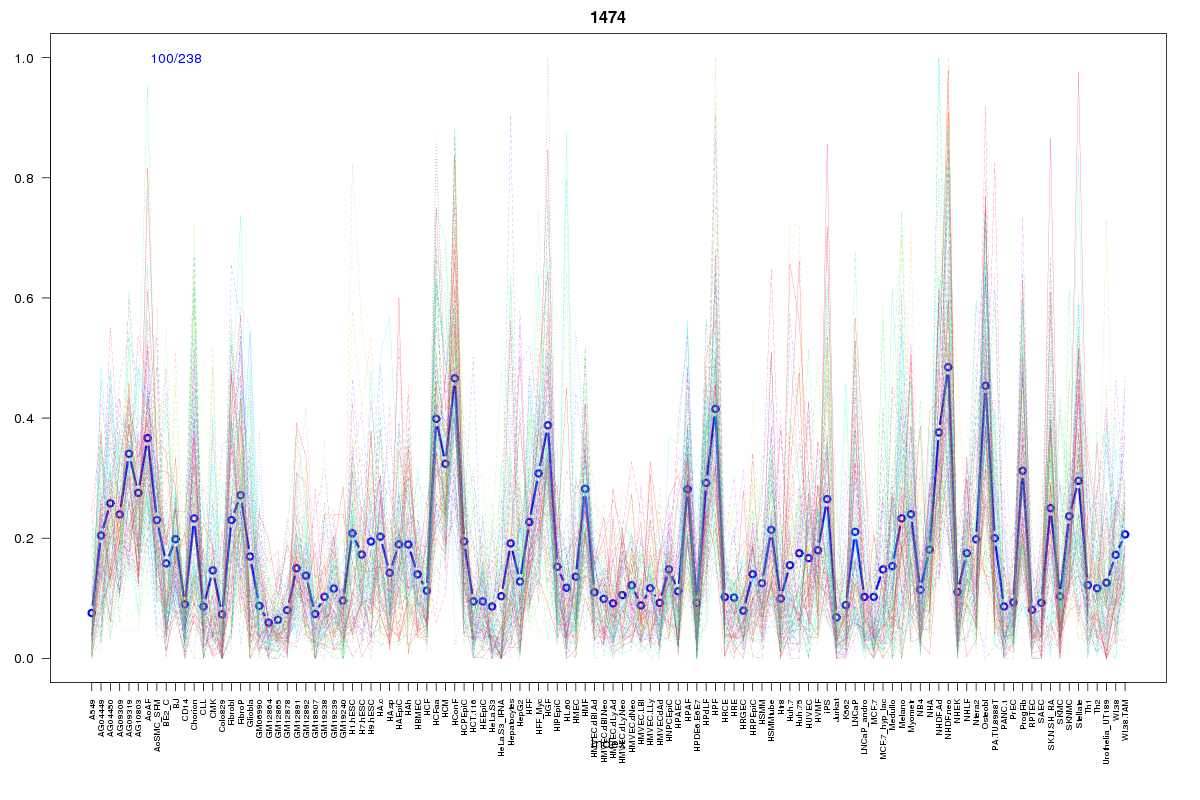 | 1474 | 1 |
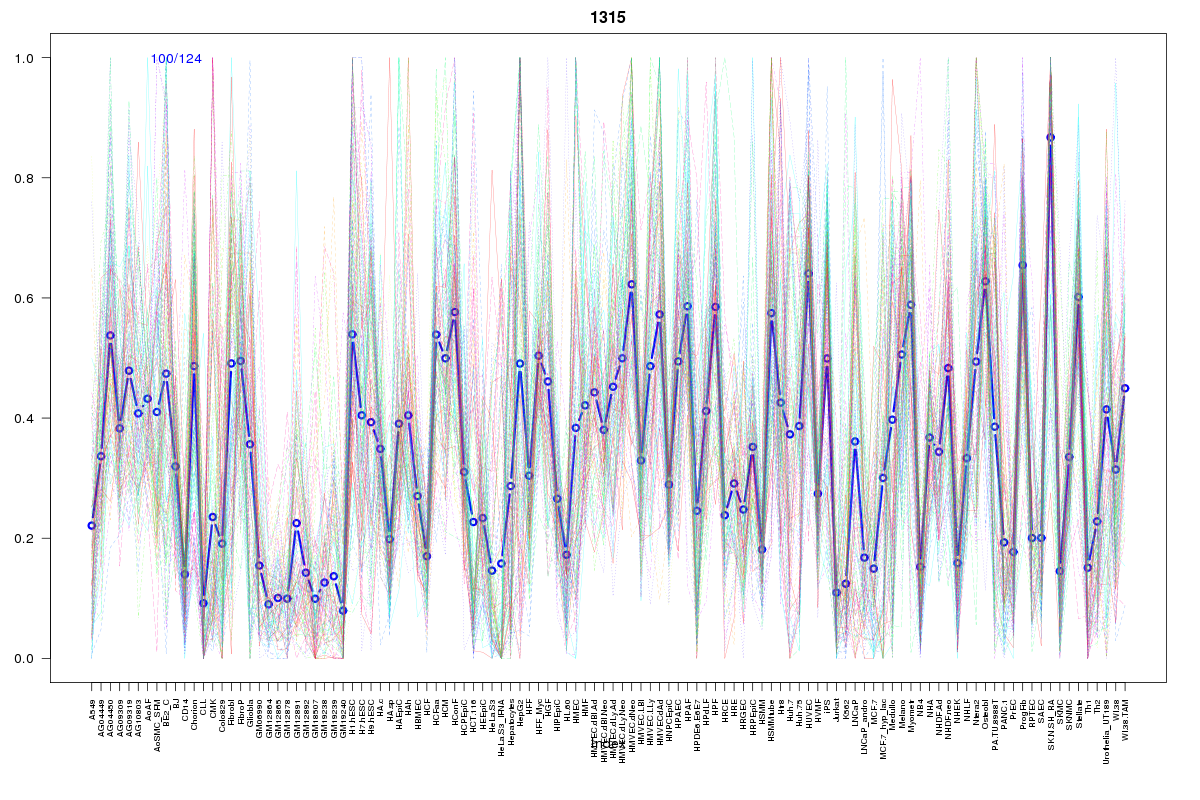 | 1315 | 1 |
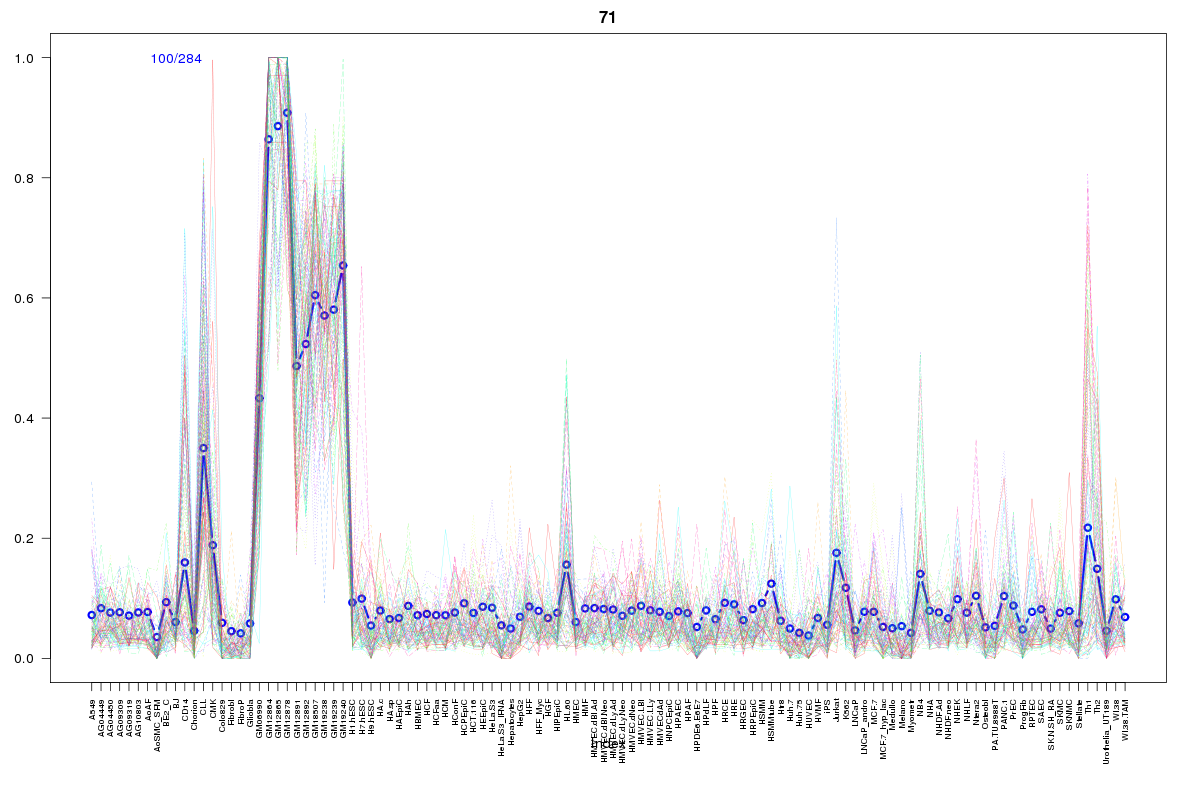 | 71 | 1 |
Resources
BED file downloads
Connects to 35 DHS sitesTop 10 Correlated DHS Sites
p-values indiciate significant higher or lower correlation| Location | Cluster | P-value |
|---|---|---|
| chr9:139220700-139220850 | 1295 | 0 |
| chr9:139220985-139221135 | 1422 | 0.003 |
| chr9:139230605-139230755 | 1473 | 0.004 |
| chr9:139220525-139220675 | 1001 | 0.005 |
| chr9:139331980-139332130 | 1024 | 0.005 |
| chr9:139221145-139221295 | 1474 | 0.015 |
| chr9:139223225-139223375 | 1315 | 0.015 |
| chr9:139255640-139255790 | 1610 | 0.017 |
| chr9:139255385-139255535 | 807 | 0.022 |
| chr9:139256260-139256410 | 1154 | 0.022 |
| chr9:139256080-139256230 | 1255 | 0.023 |
External Databases
UCSCEnsembl (ENSG00000160360)