Gene: BTG2
chr1: 203274618-203278697Expression Profile
(log scale)
Graphical Connections
Distribution of linked clusters:
You may find it interesting if many of the connected DHS sites belong to the same cluster.| Cluster Profile | Cluster ID | Number of DHS sites in this cluster |
|---|---|---|
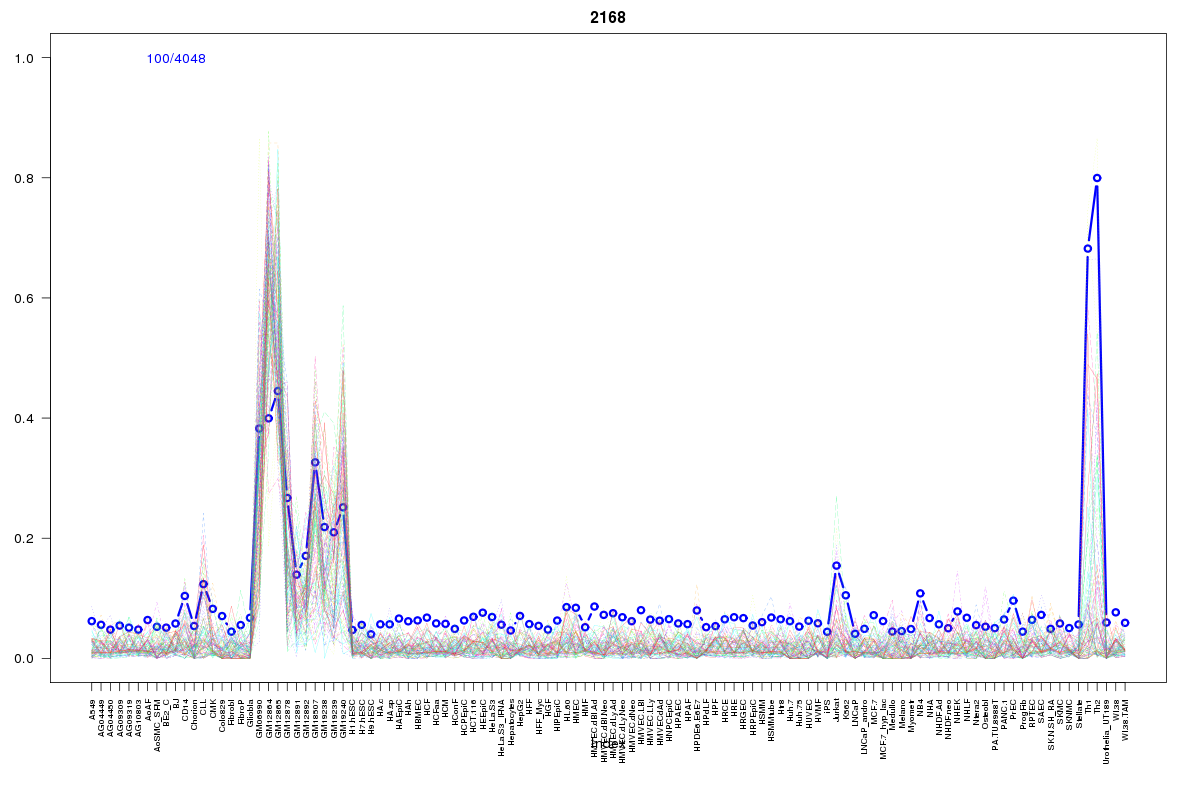 | 2168 | 4 |
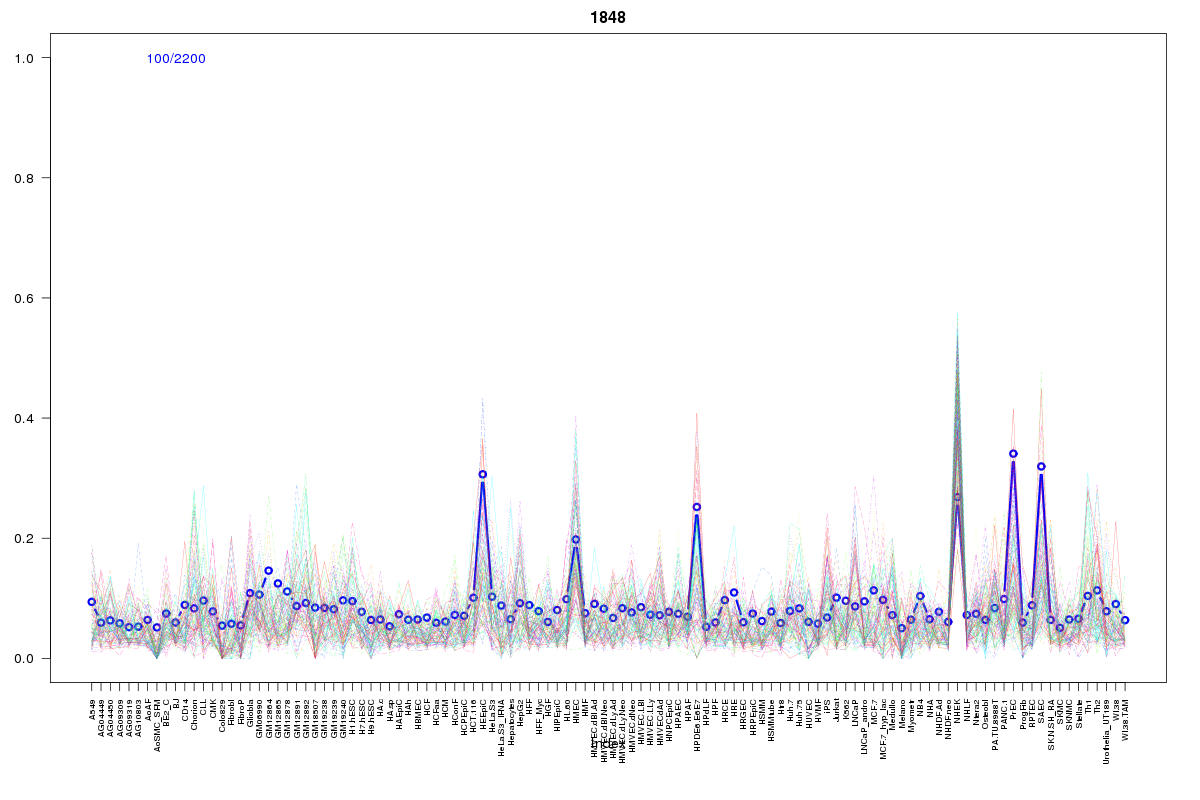 | 1848 | 3 |
 | 2211 | 3 |
 | 15 | 3 |
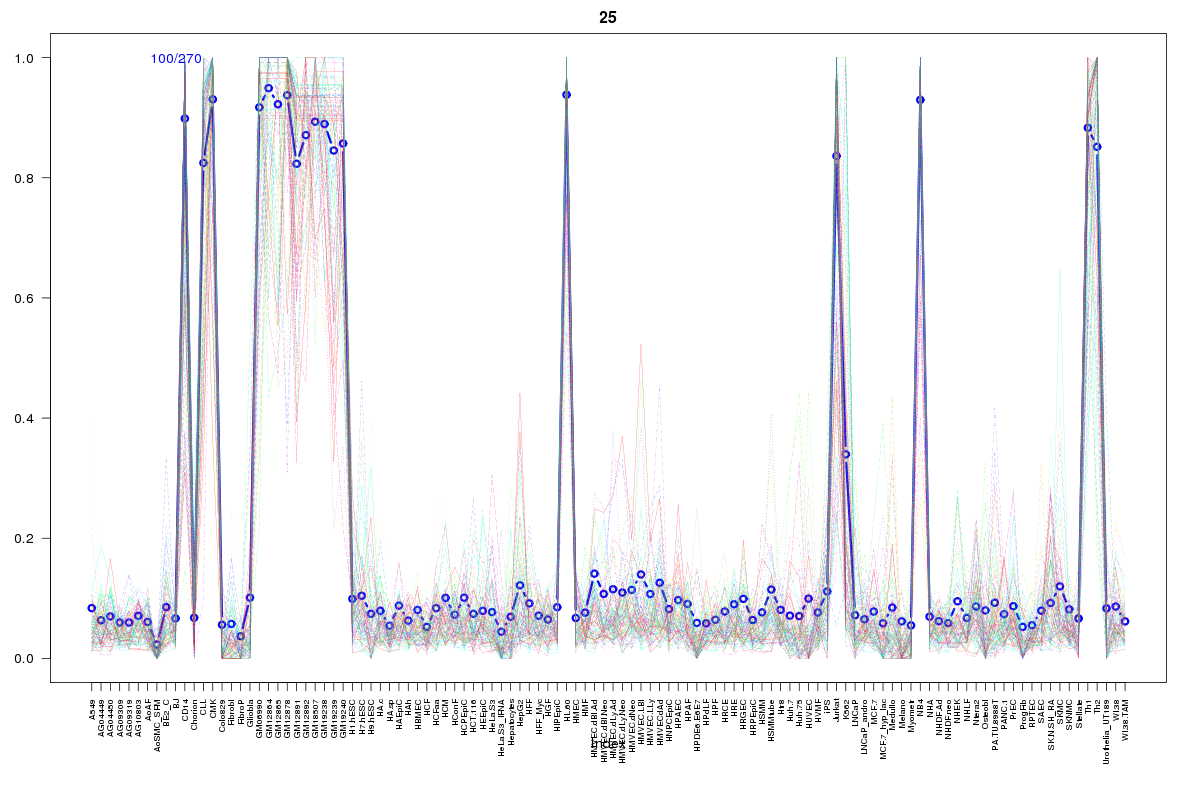 | 25 | 2 |
 | 77 | 2 |
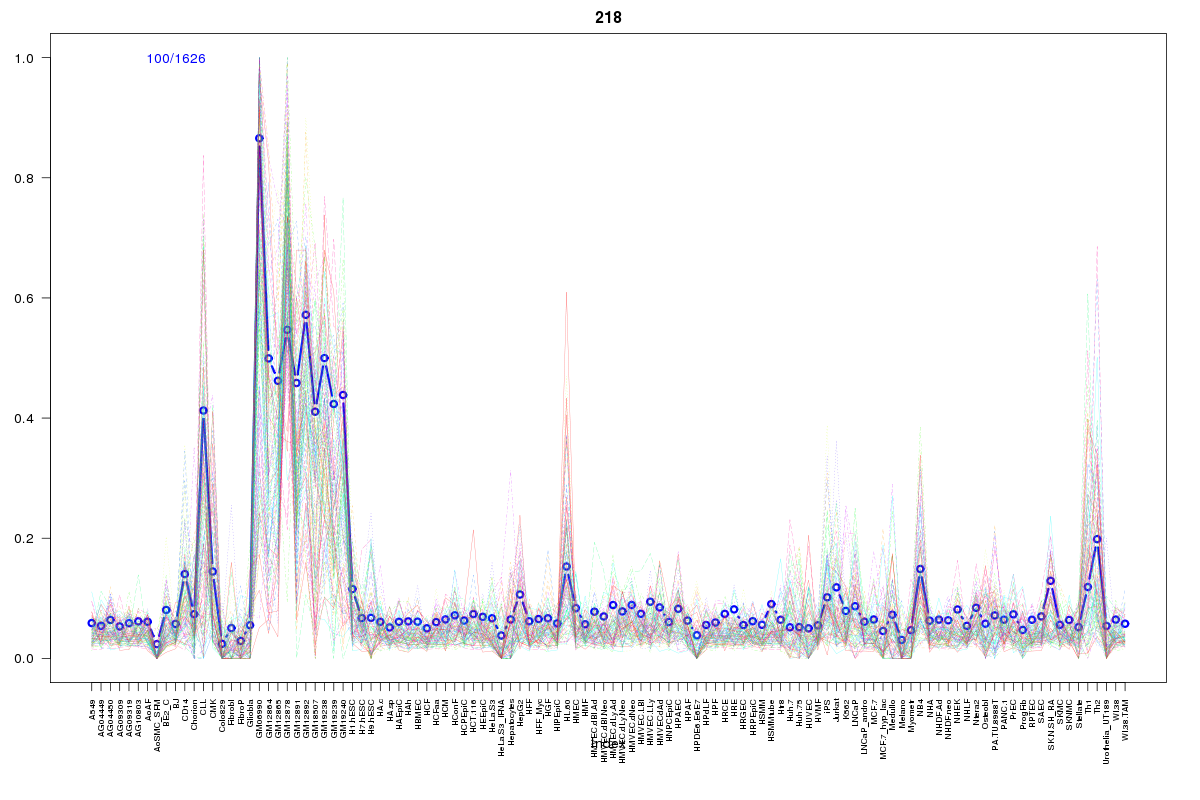 | 218 | 2 |
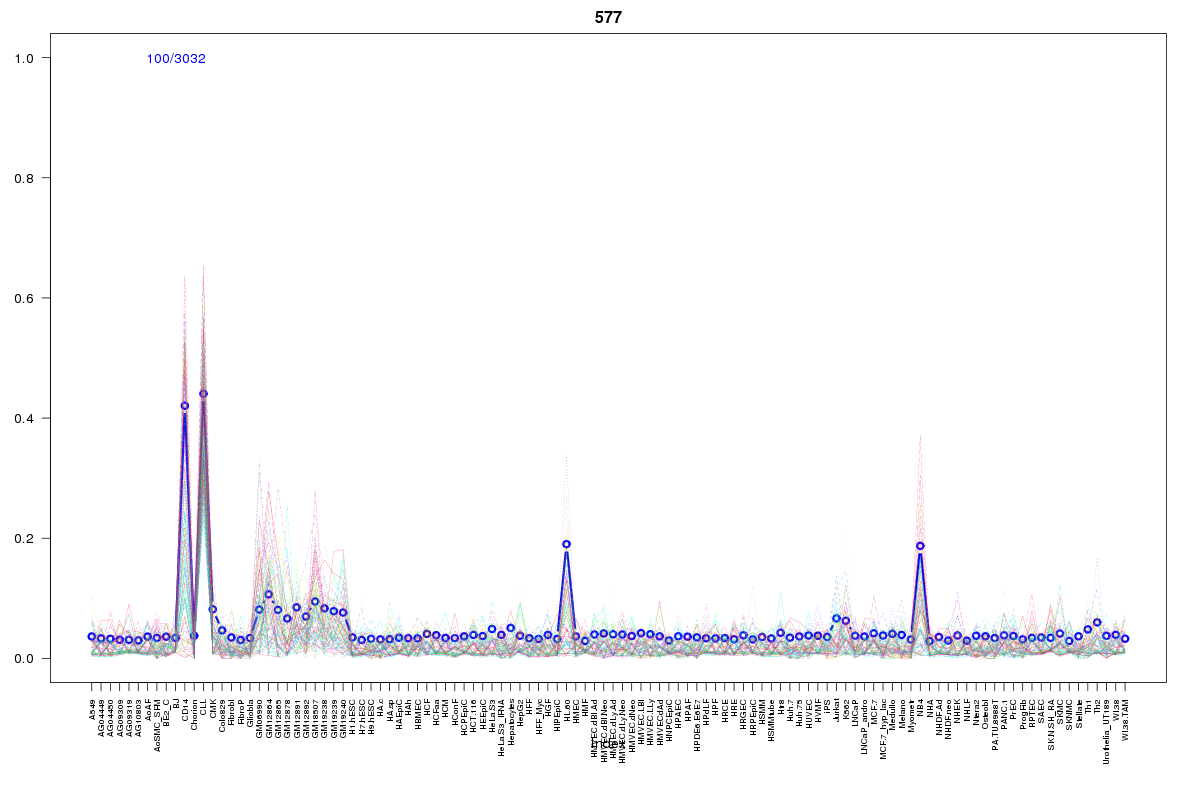 | 577 | 2 |
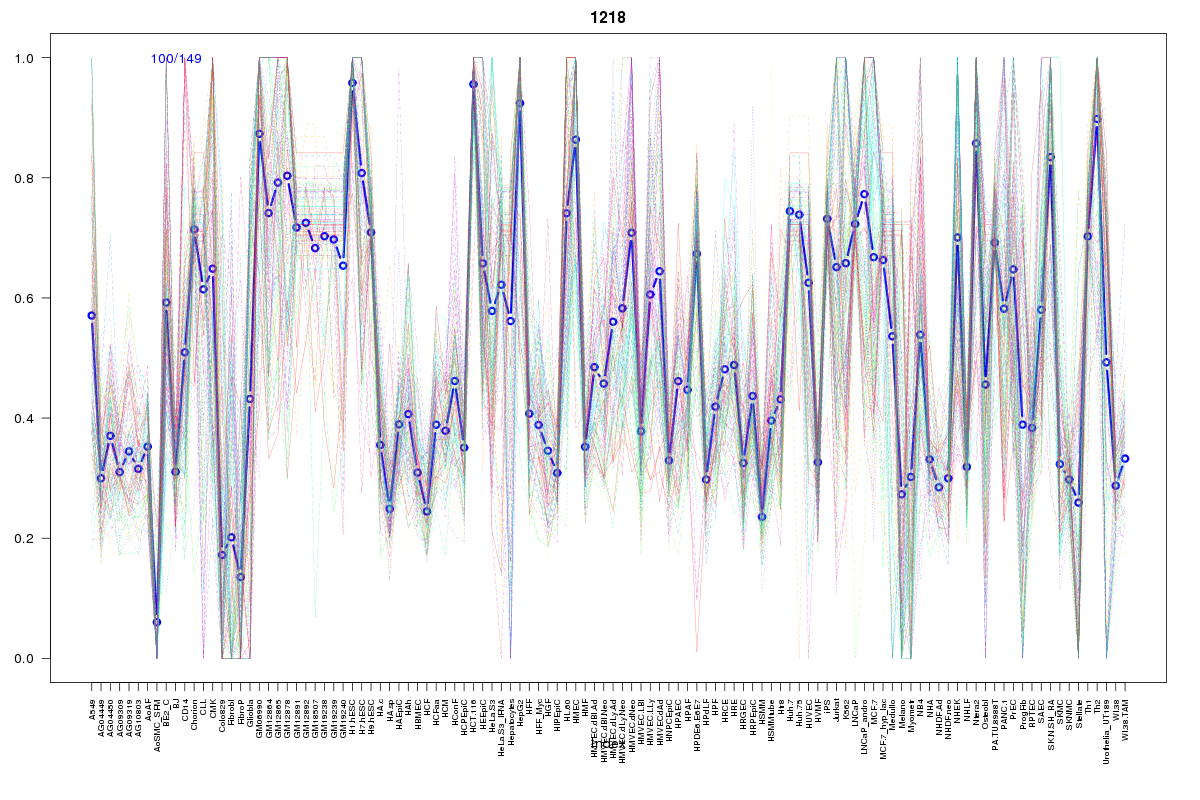 | 1218 | 1 |
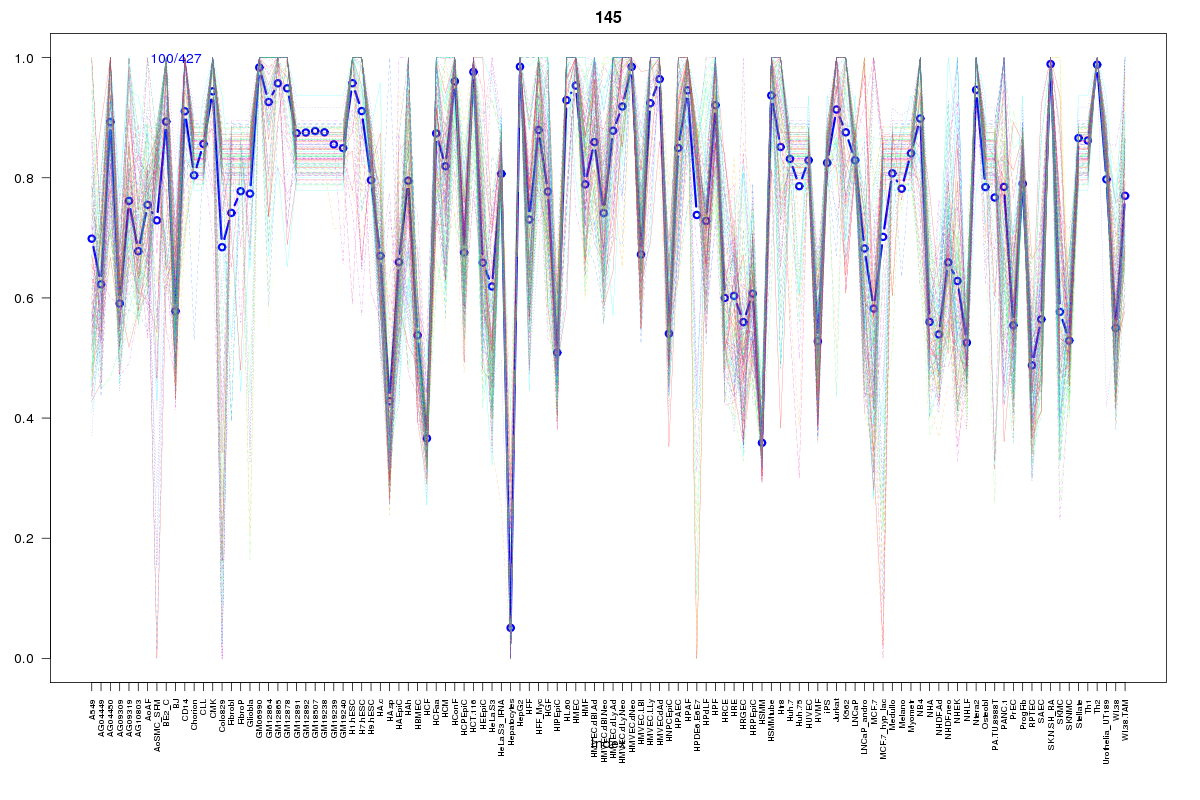 | 145 | 1 |
 | 527 | 1 |
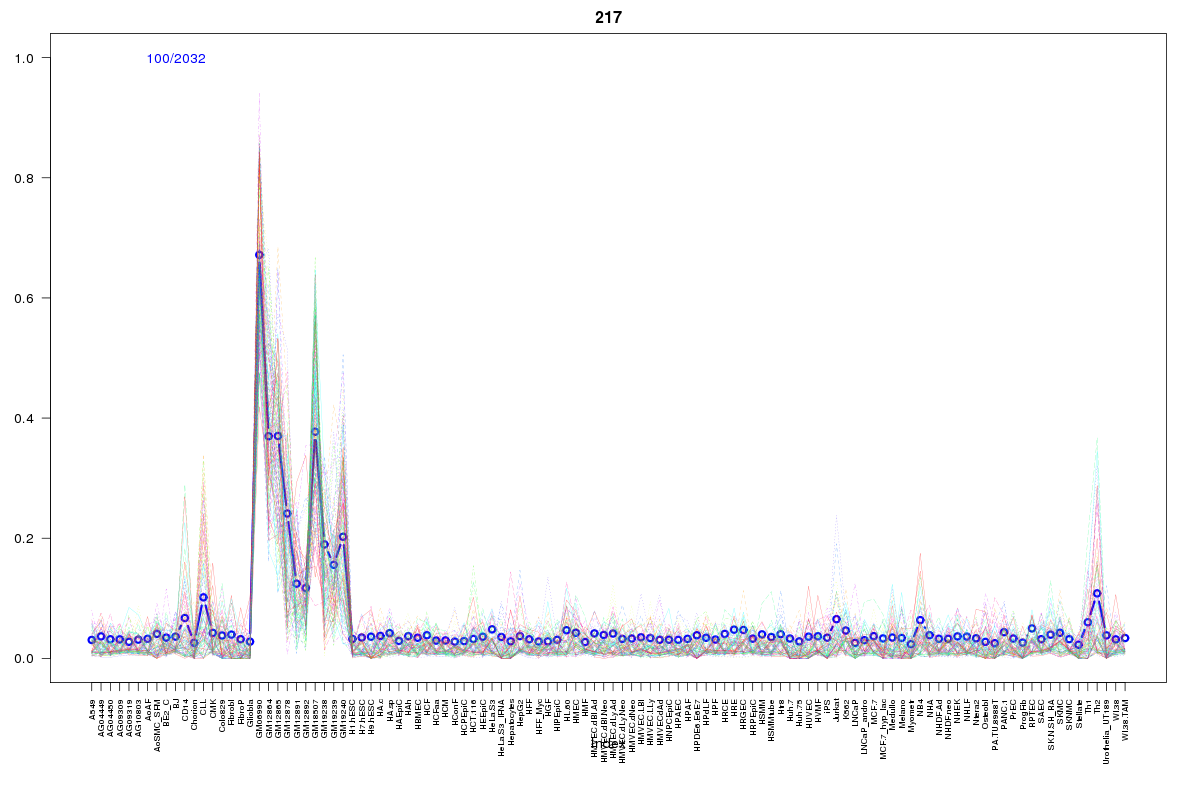 | 217 | 1 |
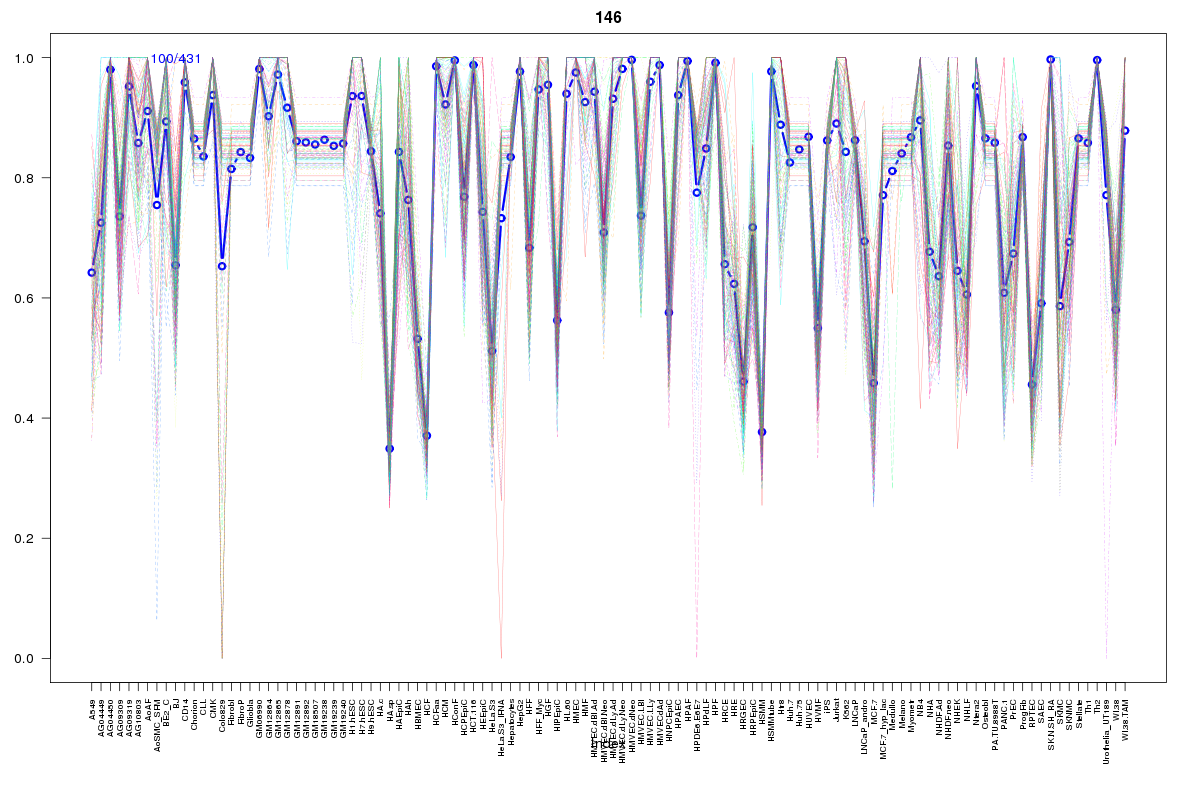 | 146 | 1 |
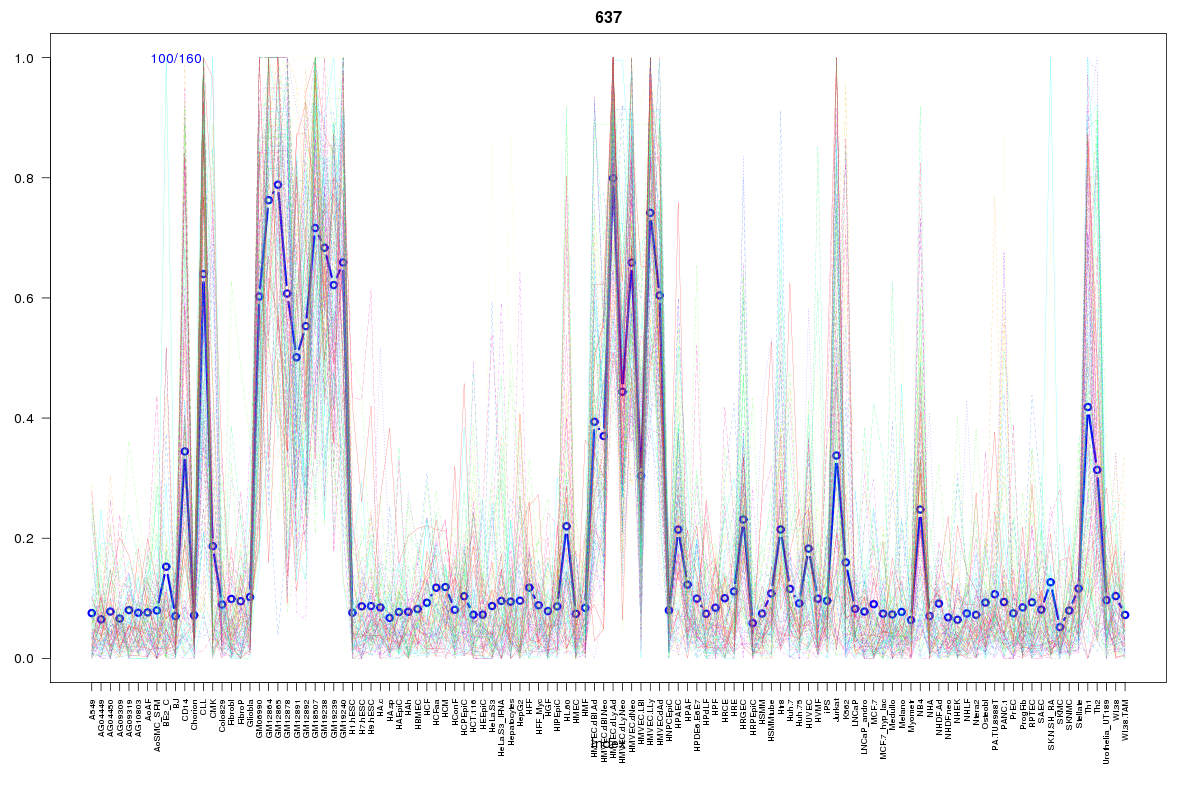 | 637 | 1 |
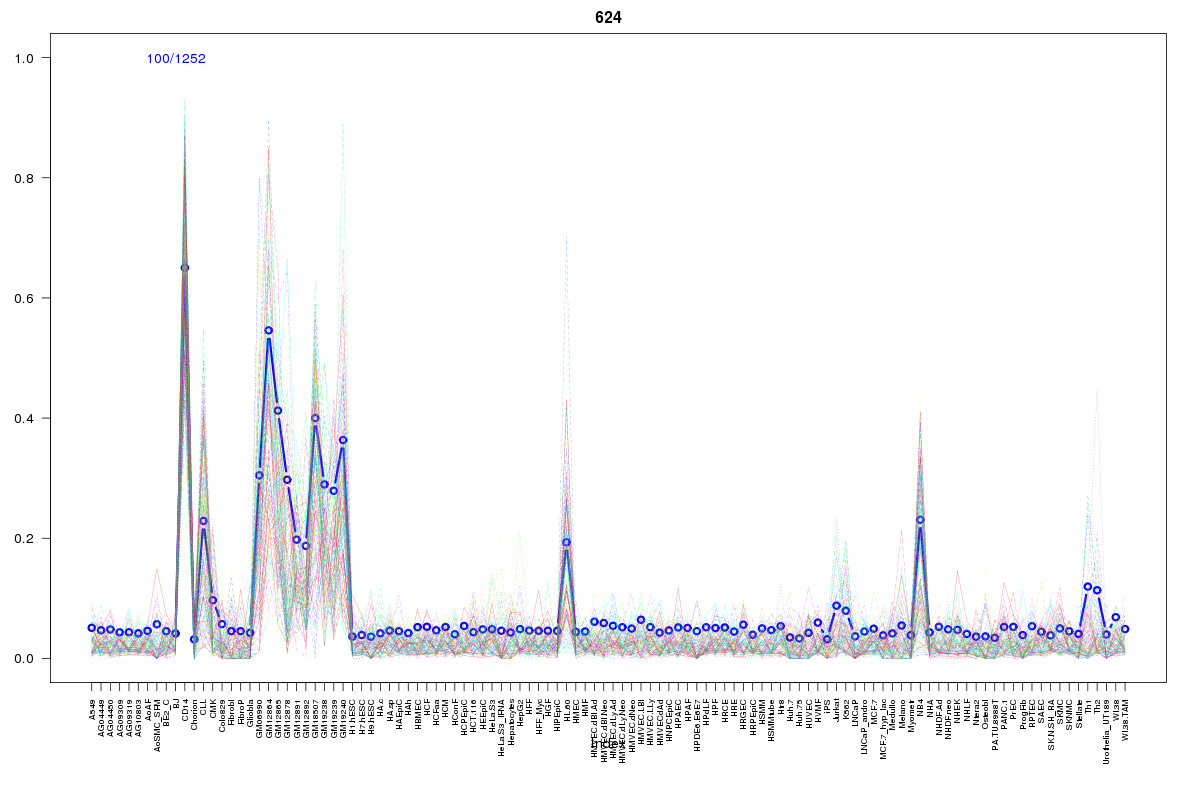 | 624 | 1 |
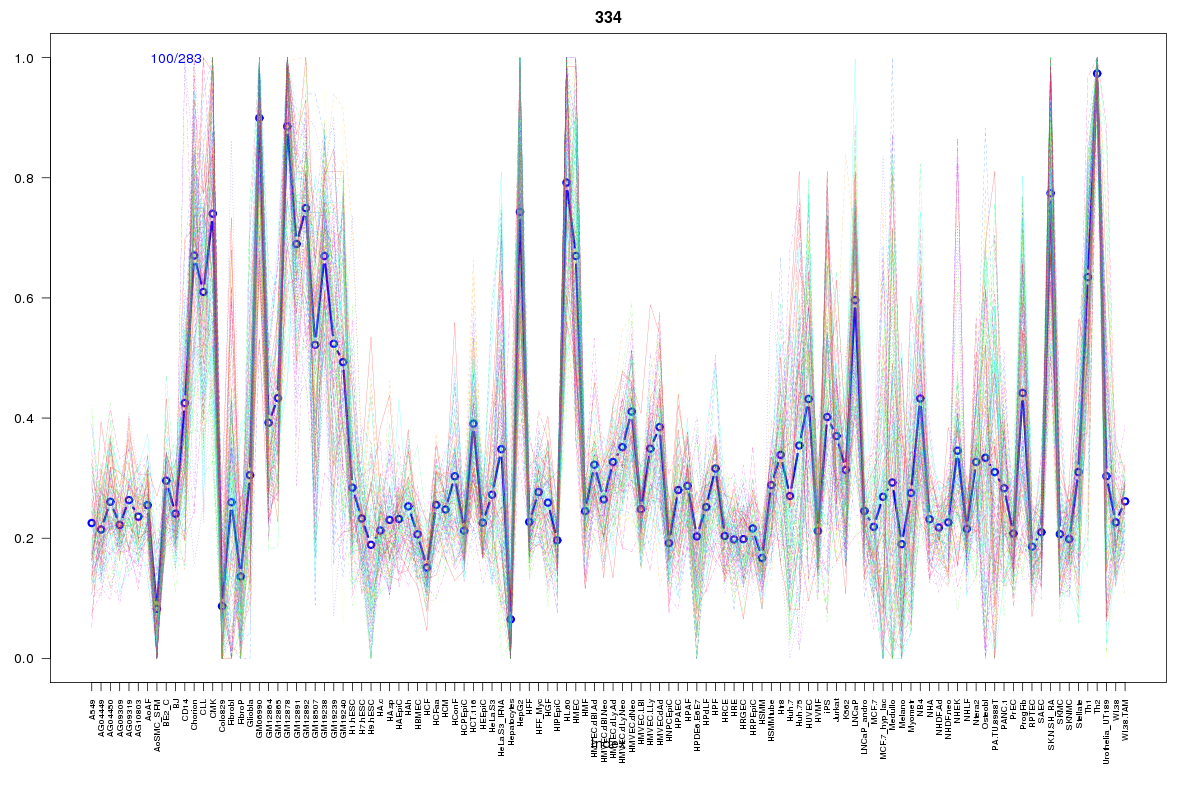 | 334 | 1 |
 | 2055 | 1 |
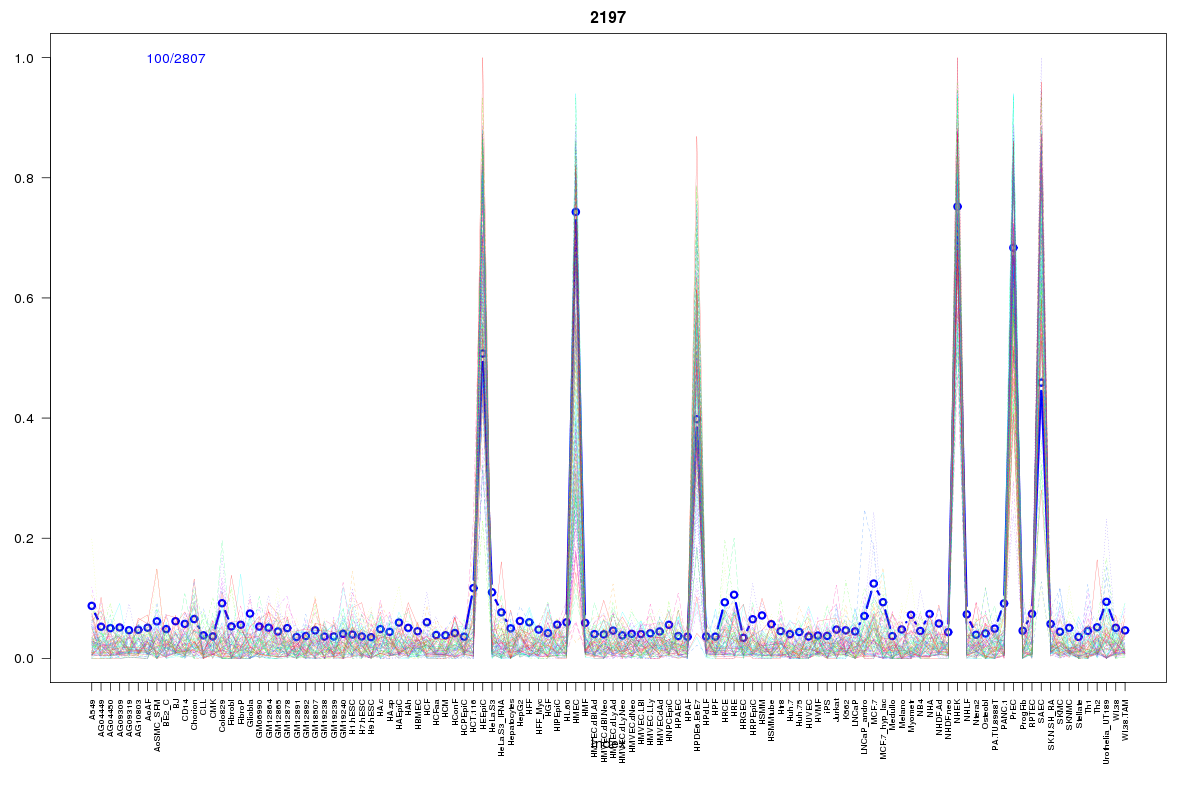 | 2197 | 1 |
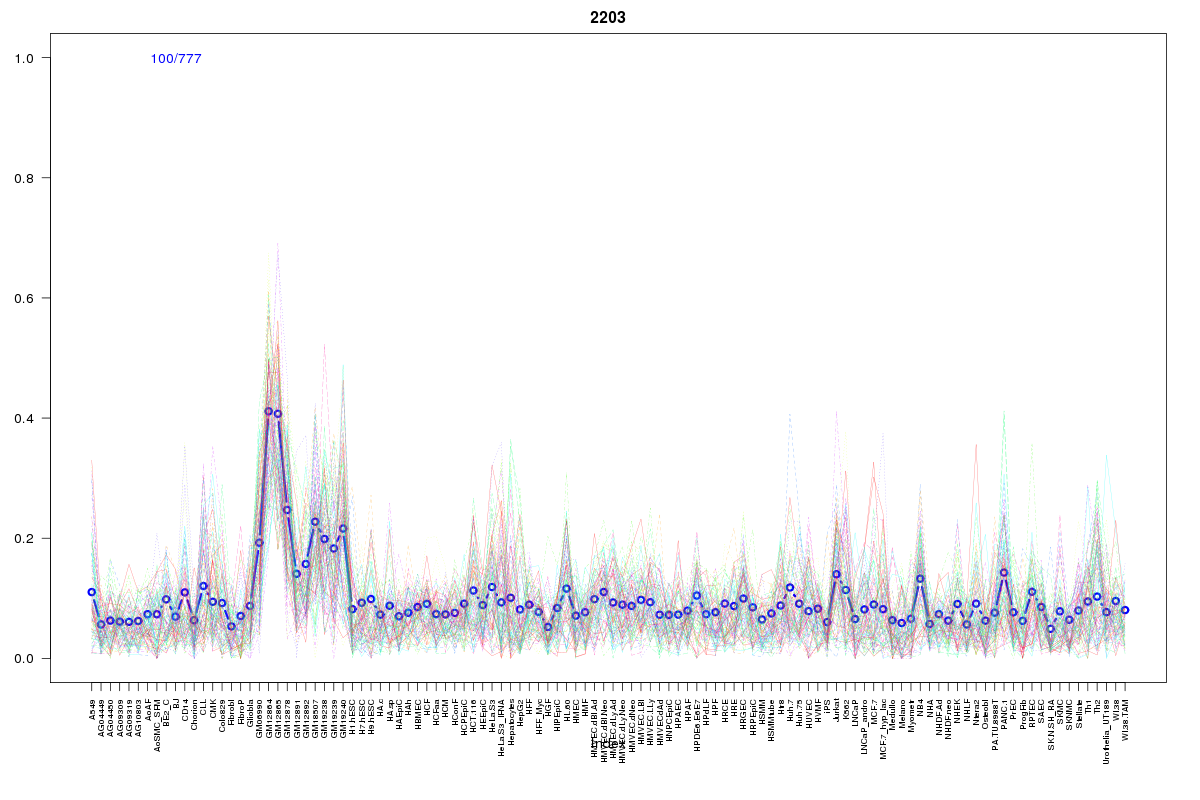 | 2203 | 1 |
 | 66 | 1 |
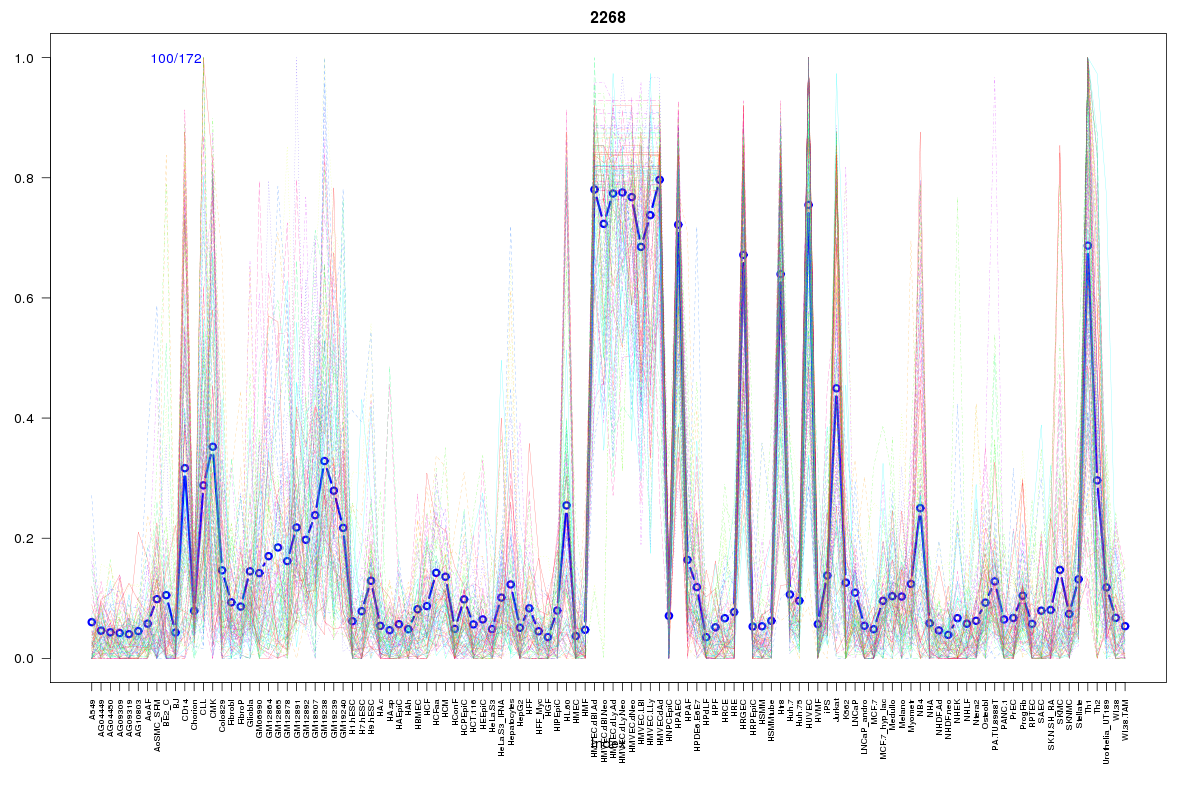 | 2268 | 1 |
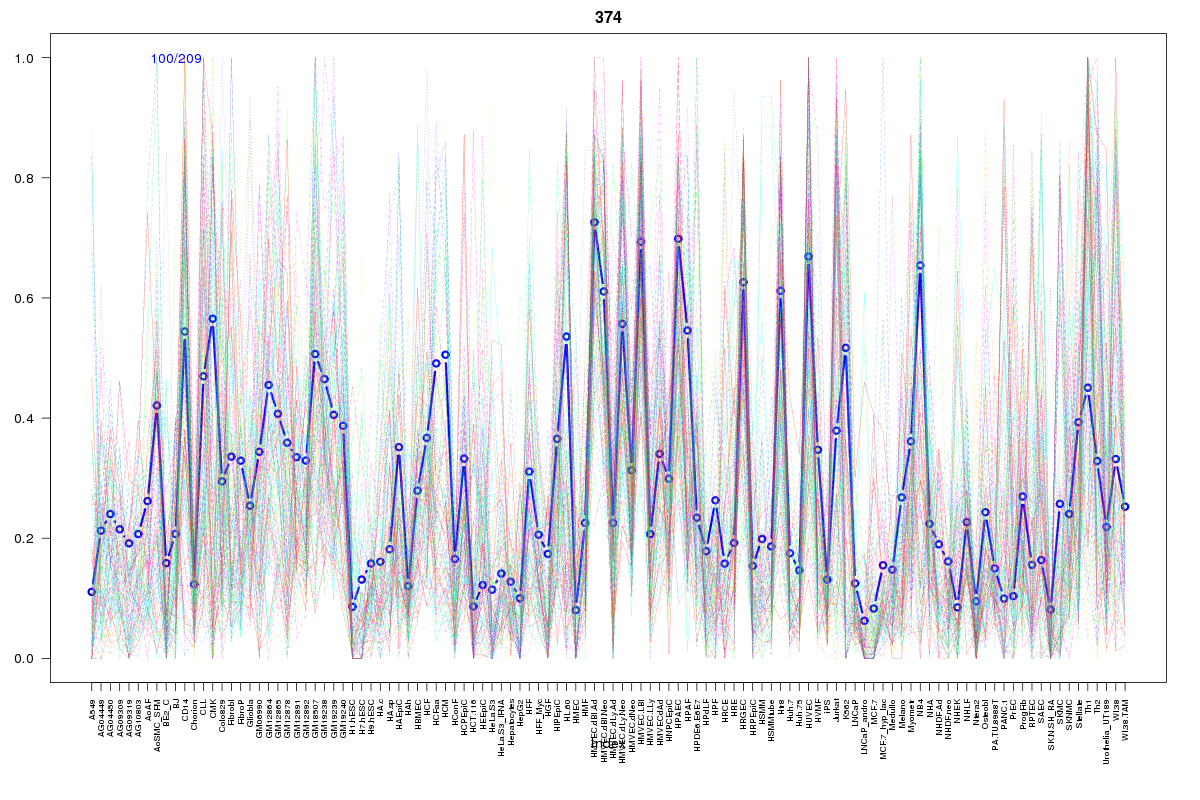 | 374 | 1 |
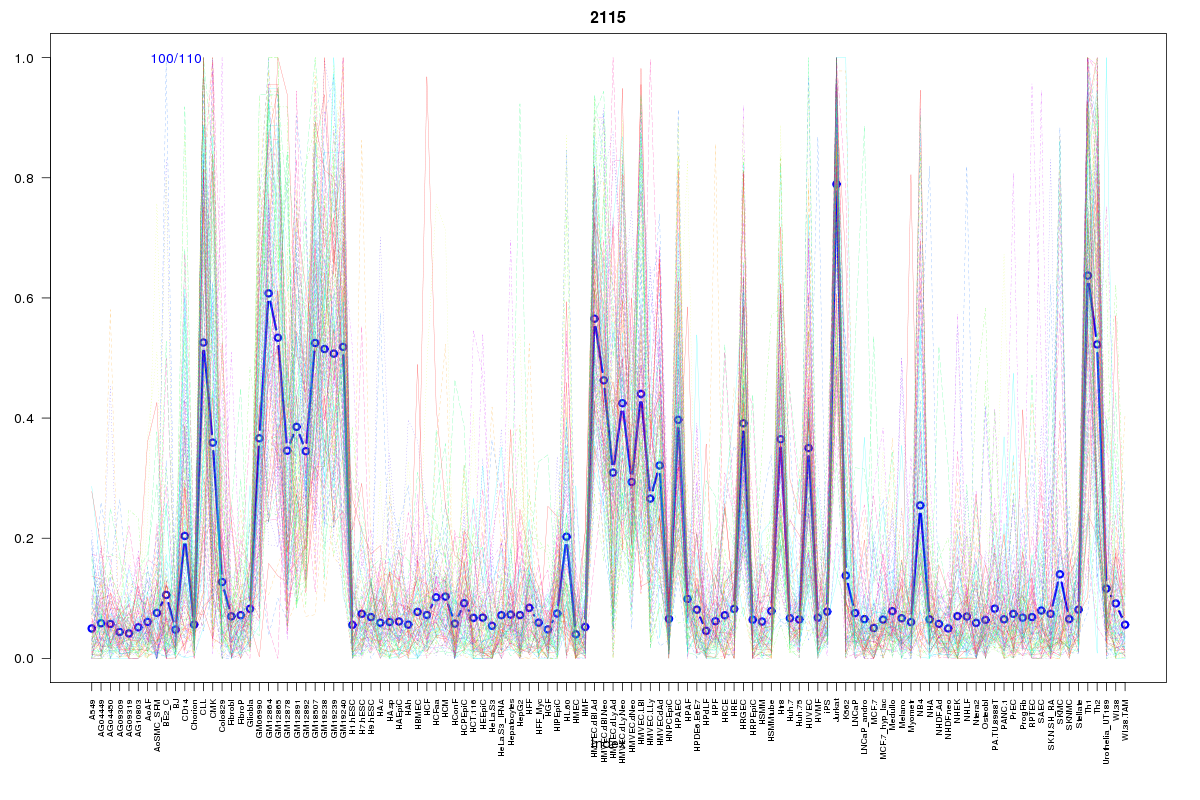 | 2115 | 1 |
 | 2116 | 1 |
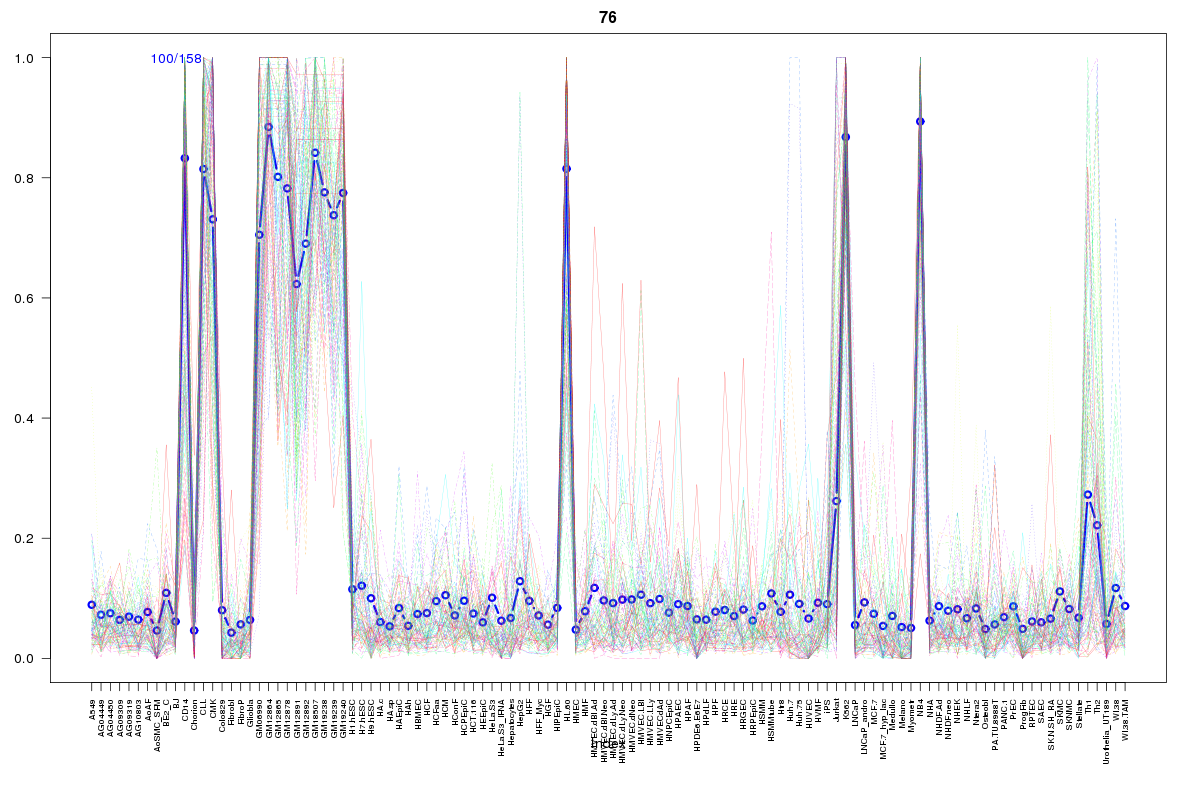 | 76 | 1 |
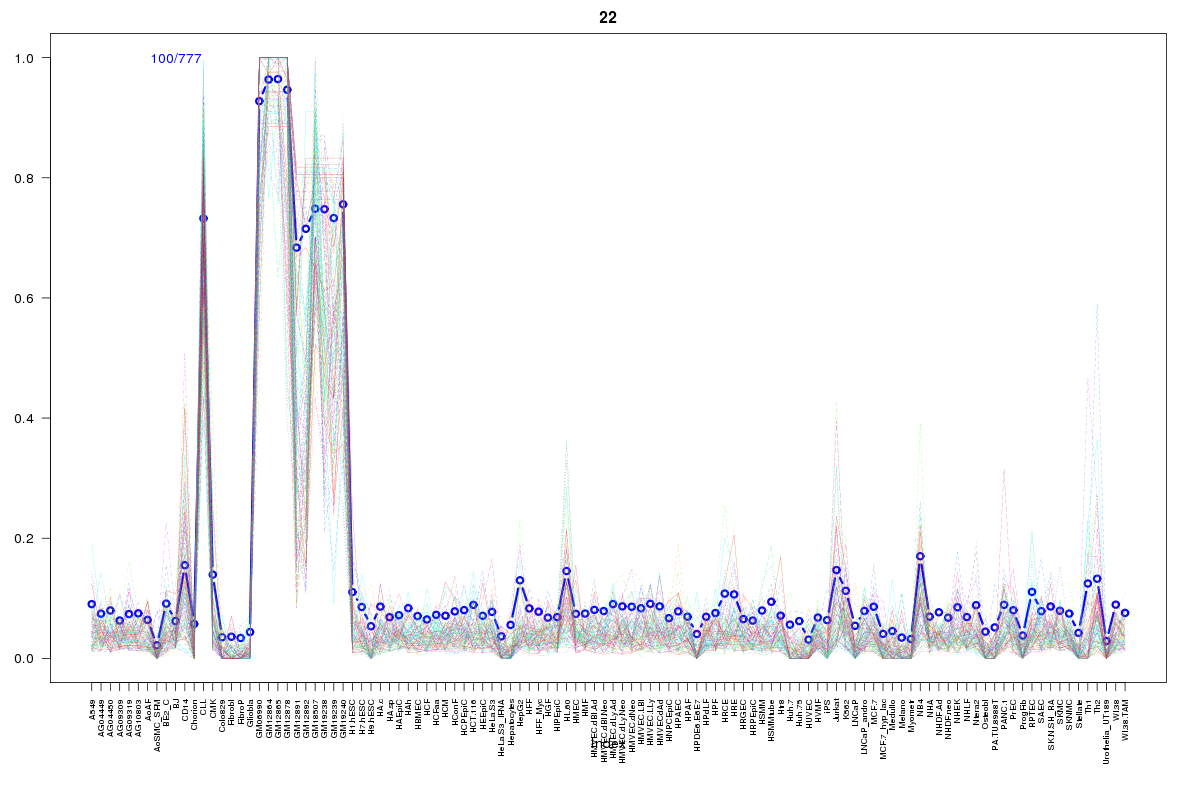 | 22 | 1 |
 | 103 | 1 |
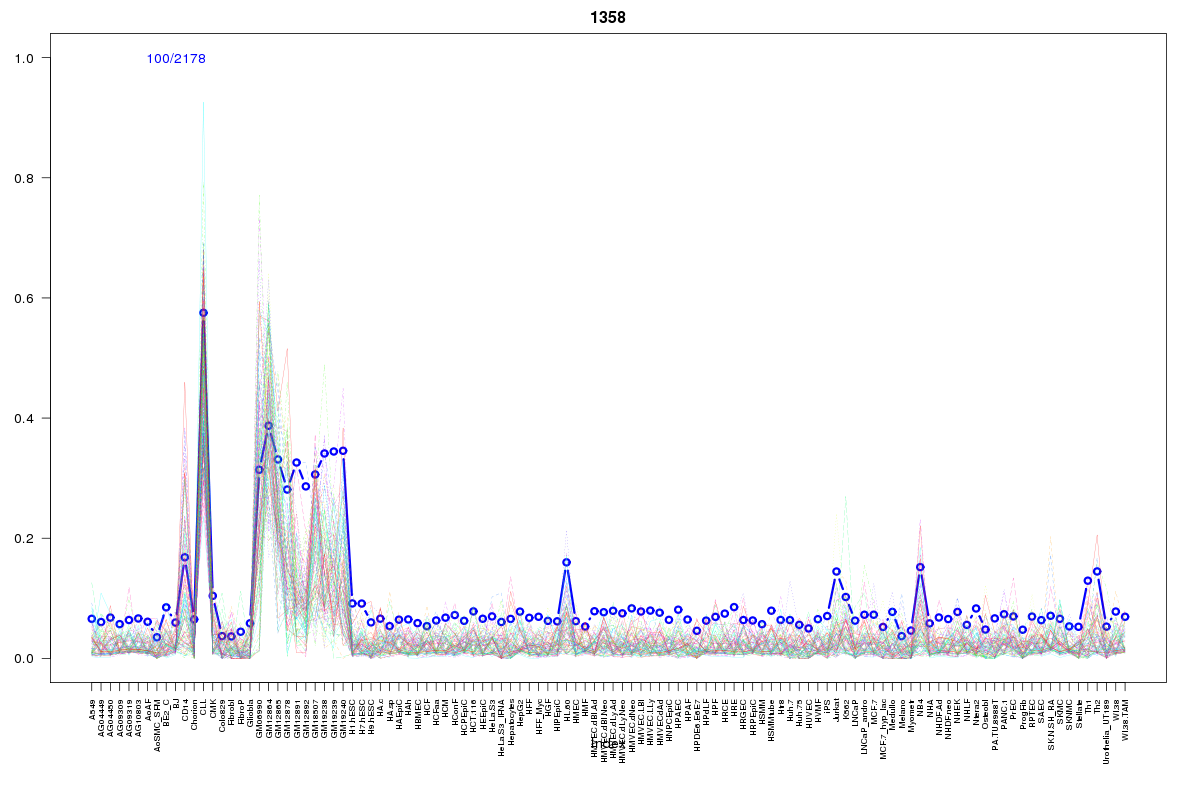 | 1358 | 1 |
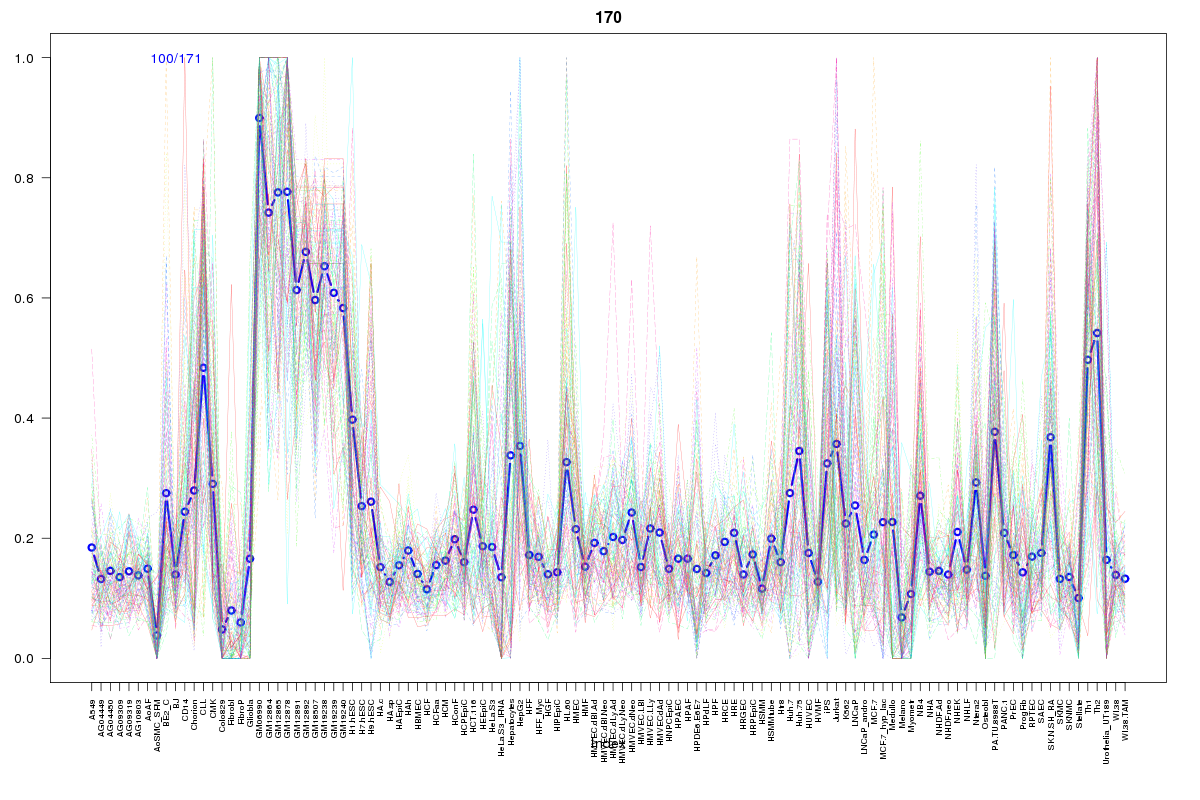 | 170 | 1 |
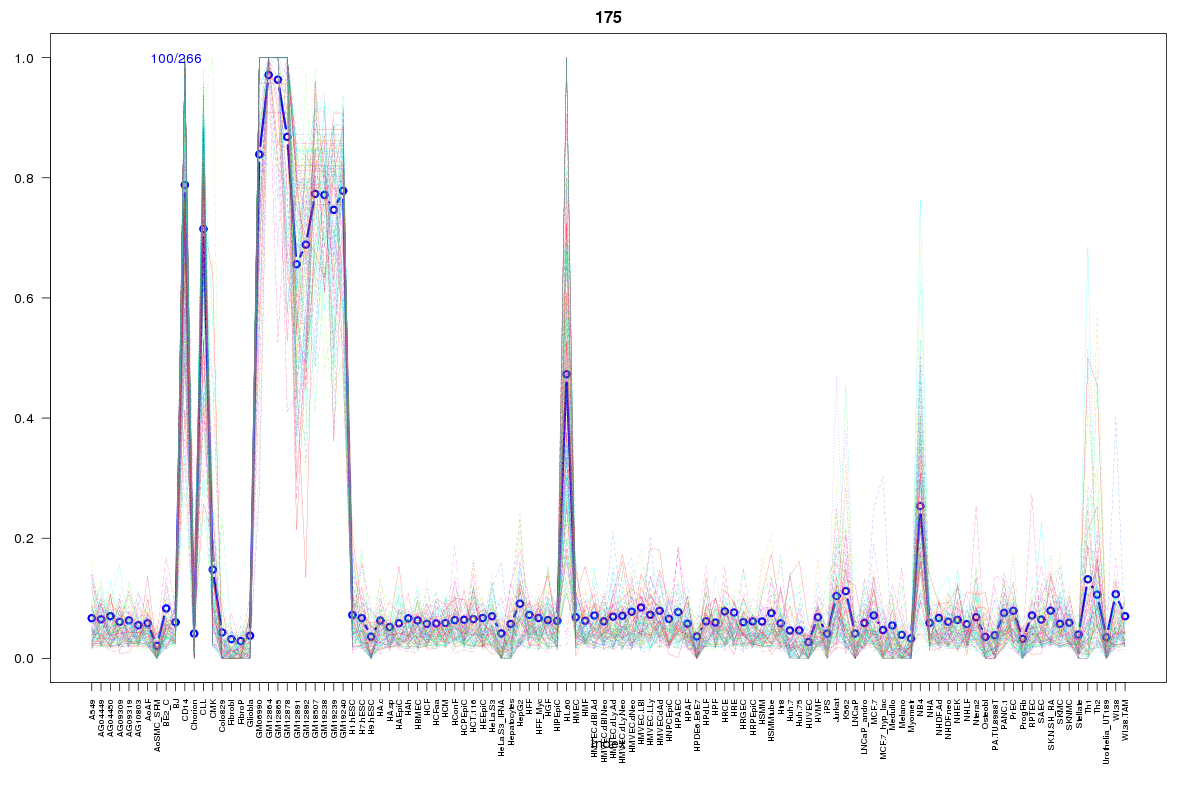 | 175 | 1 |
 | 89 | 1 |
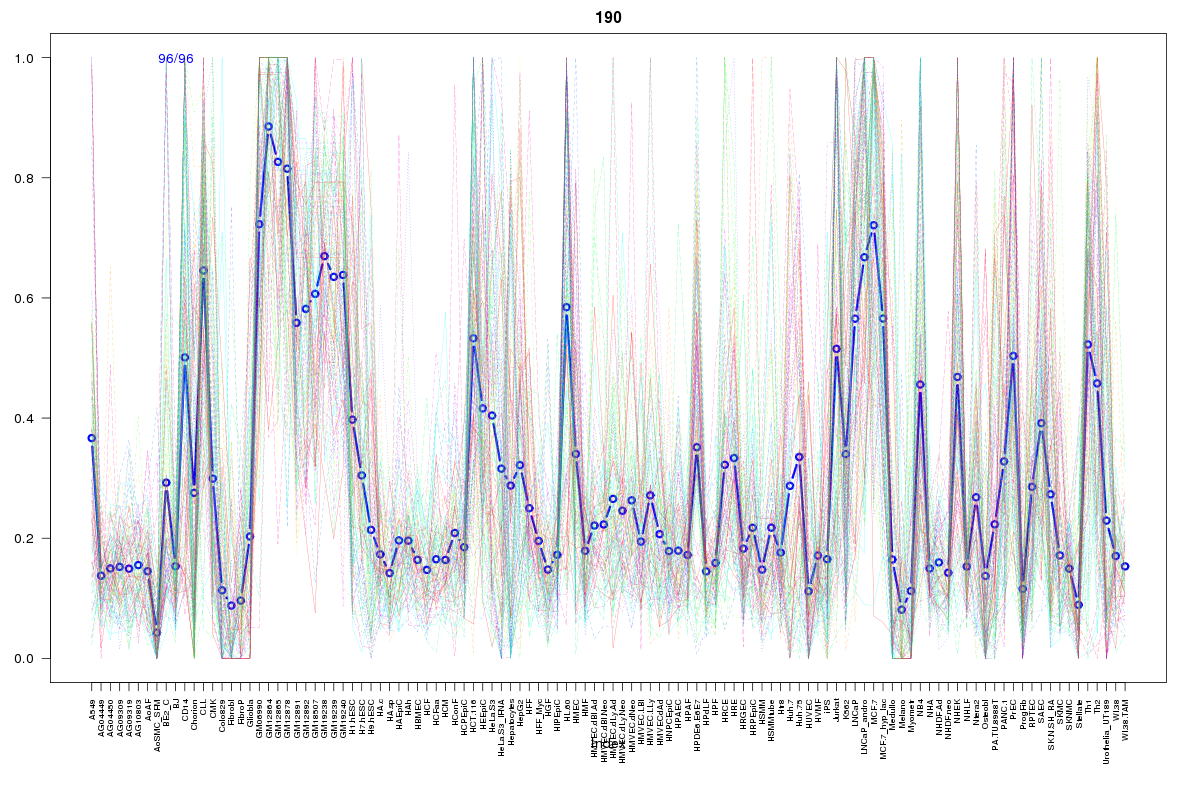 | 190 | 1 |
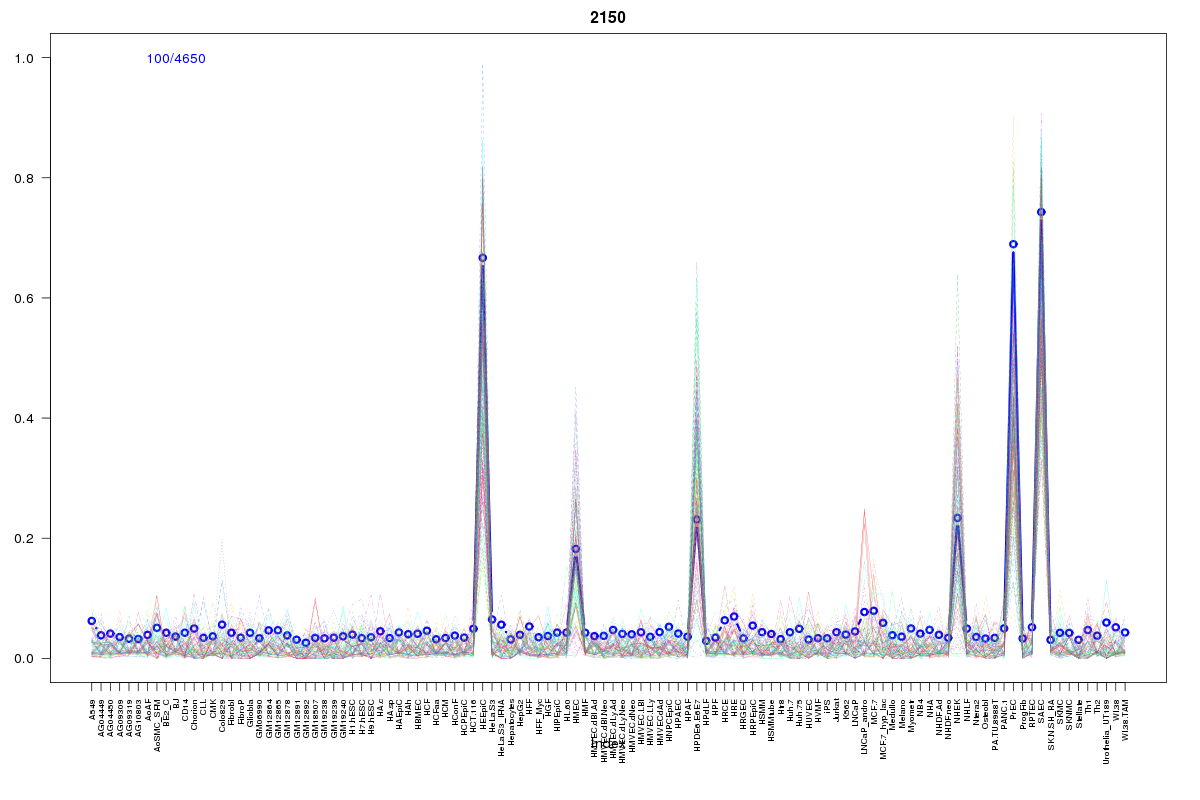 | 2150 | 1 |
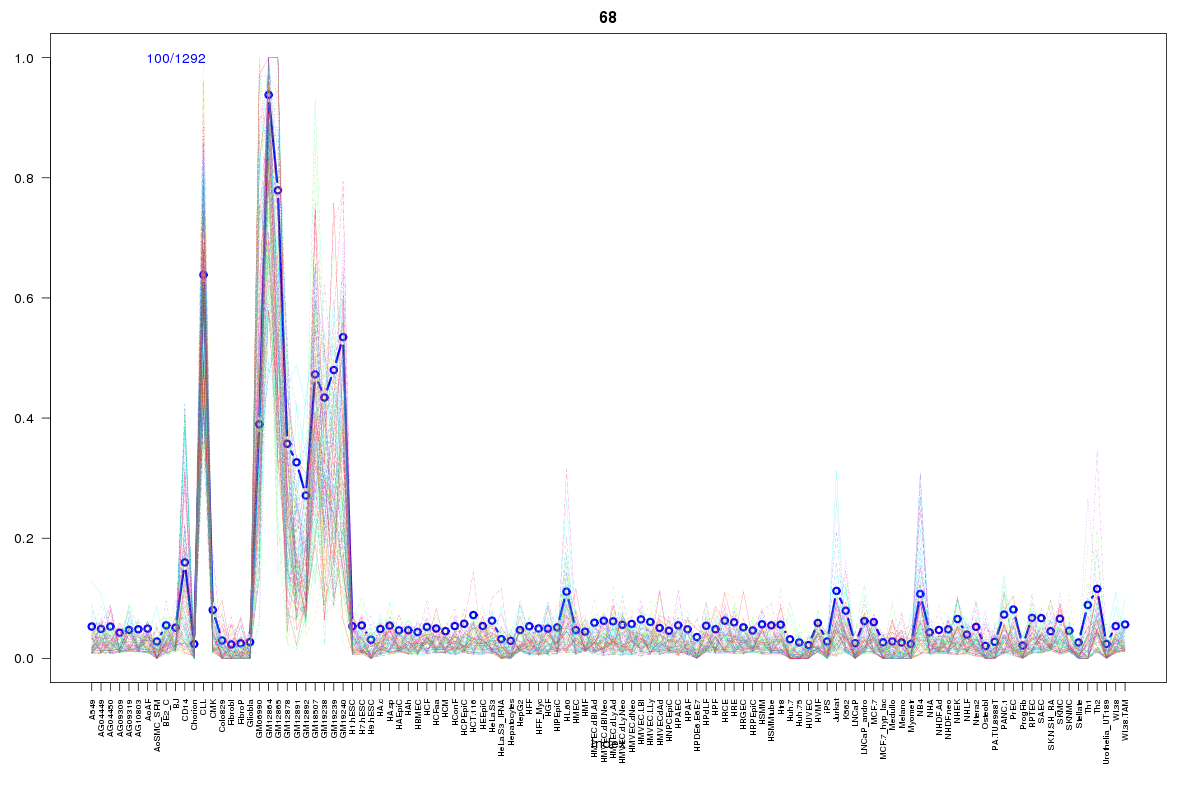 | 68 | 1 |
 | 1079 | 1 |
 | 570 | 1 |
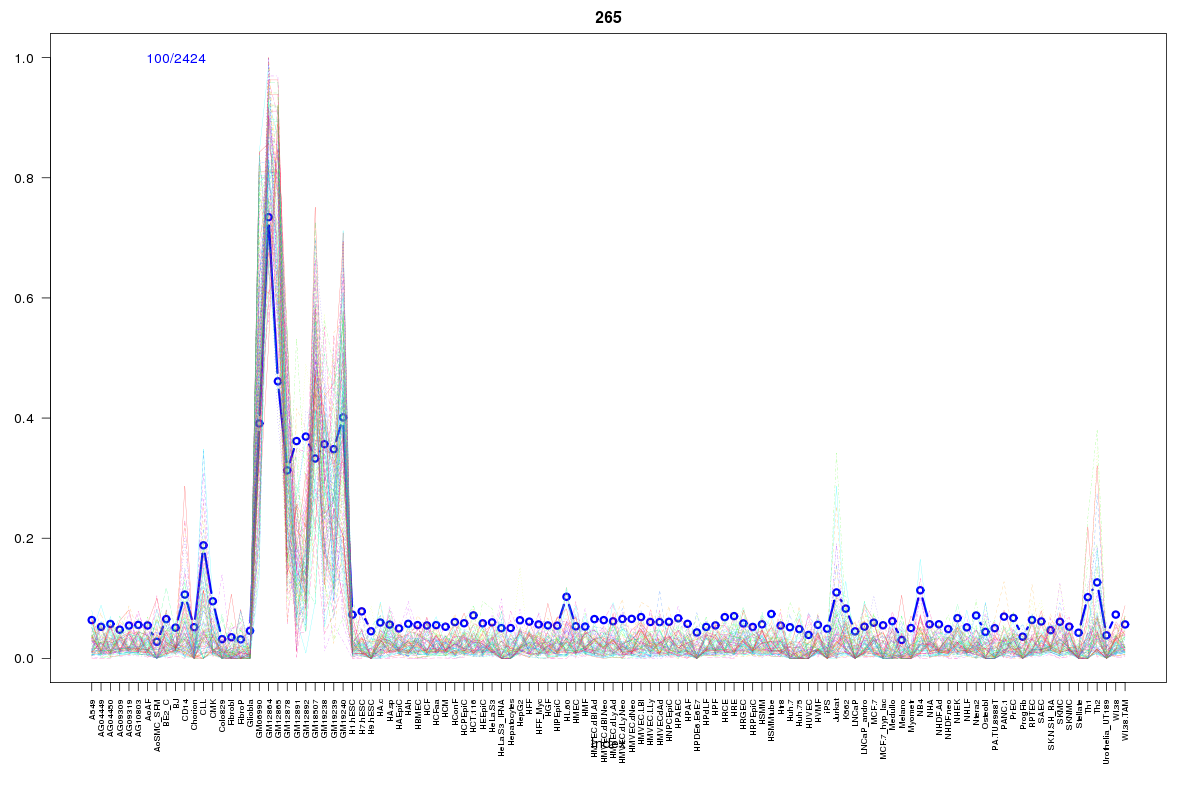 | 265 | 1 |
 | 2205 | 1 |
 | 194 | 1 |
 | 927 | 1 |
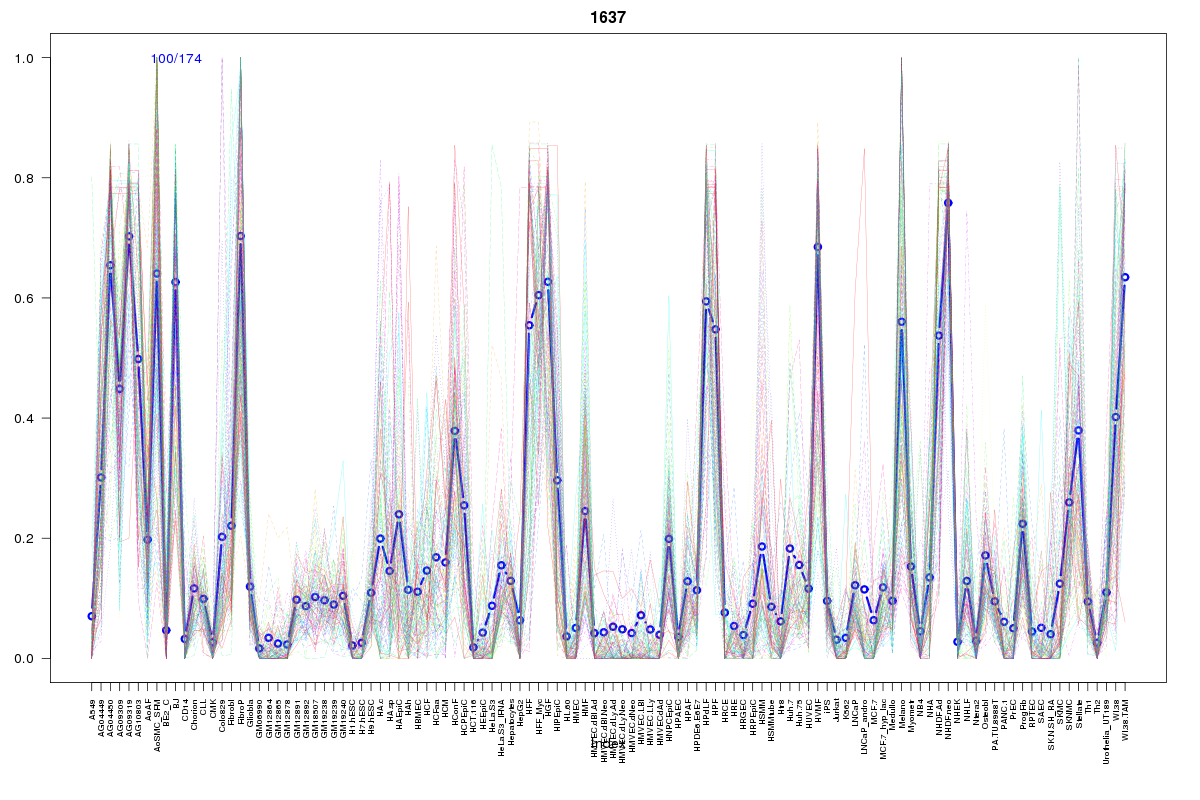 | 1637 | 1 |
Resources
BED file downloads
Connects to 54 DHS sitesTop 10 Correlated DHS Sites
p-values indiciate significant higher or lower correlation| Location | Cluster | P-value |
|---|---|---|
| chr1:203242520-203242670 | 1218 | 0.001 |
| chr1:203350460-203350610 | 637 | 0.001 |
| chr1:203259500-203259650 | 170 | 0.001 |
| chr1:203259660-203259810 | 89 | 0.001 |
| chr1:203258780-203258930 | 25 | 0.004 |
| chr1:203268460-203268610 | 68 | 0.004 |
| chr1:203294360-203294510 | 103 | 0.004 |
| chr1:203349880-203350030 | 2168 | 0.004 |
| chr1:203256445-203256595 | 25 | 0.004 |
| chr1:203243160-203243310 | 624 | 0.005 |
| chr1:203294160-203294310 | 22 | 0.006 |
External Databases
UCSCEnsembl (ENSG00000159388)