Gene: FCER1G
chr1: 161185023-161189038Expression Profile
(log scale)
Graphical Connections
Distribution of linked clusters:
You may find it interesting if many of the connected DHS sites belong to the same cluster.| Cluster Profile | Cluster ID | Number of DHS sites in this cluster |
|---|---|---|
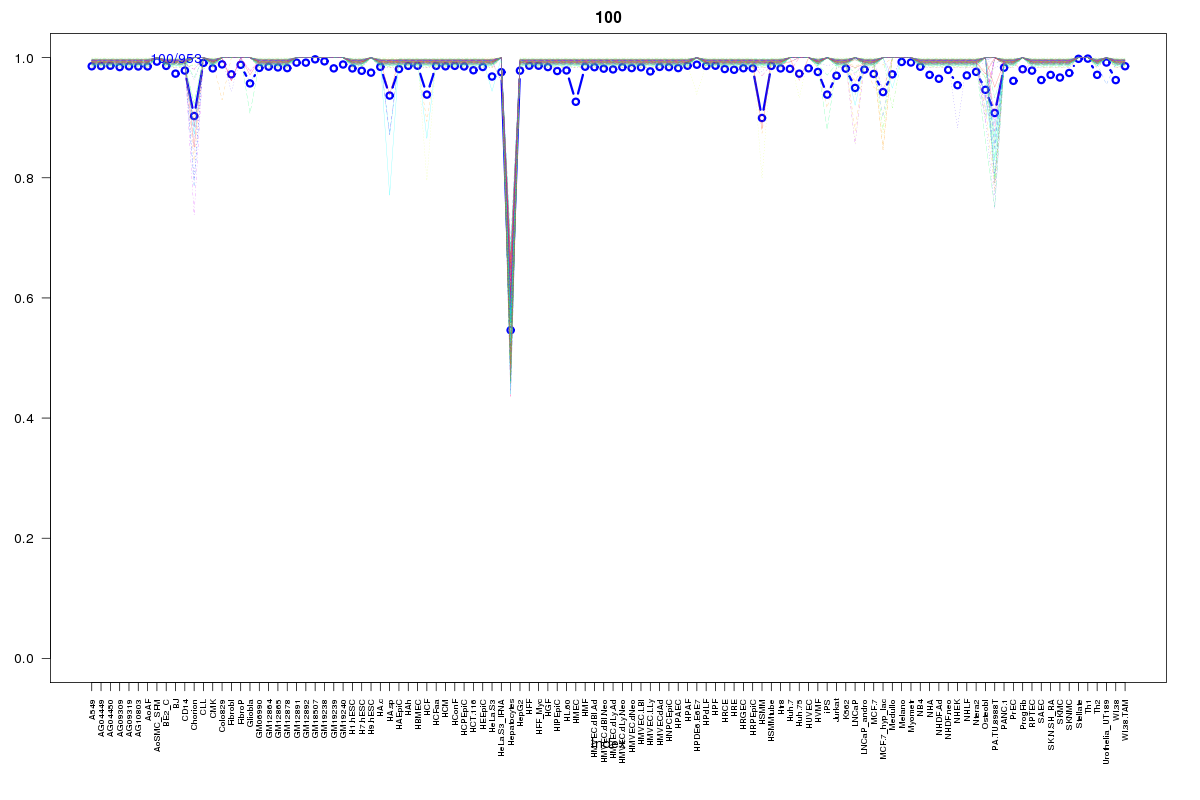 | 100 | 3 |
 | 626 | 2 |
 | 2055 | 2 |
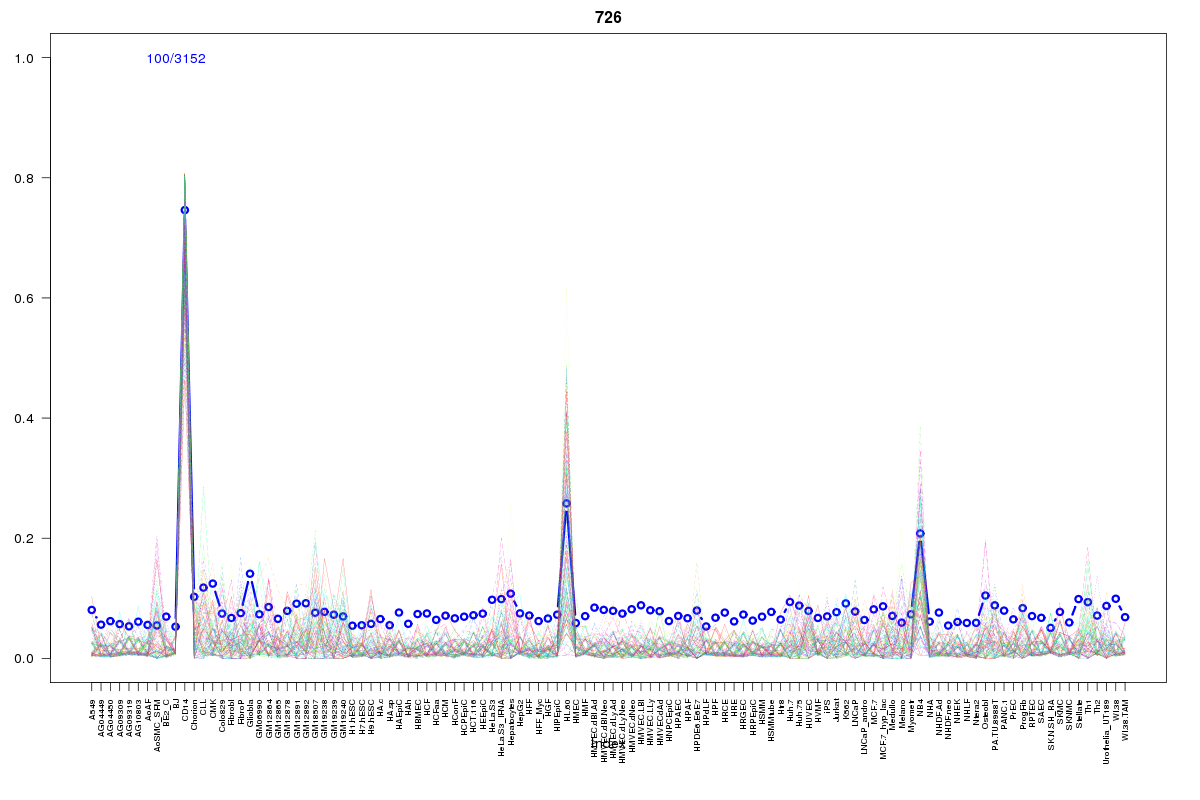 | 726 | 1 |
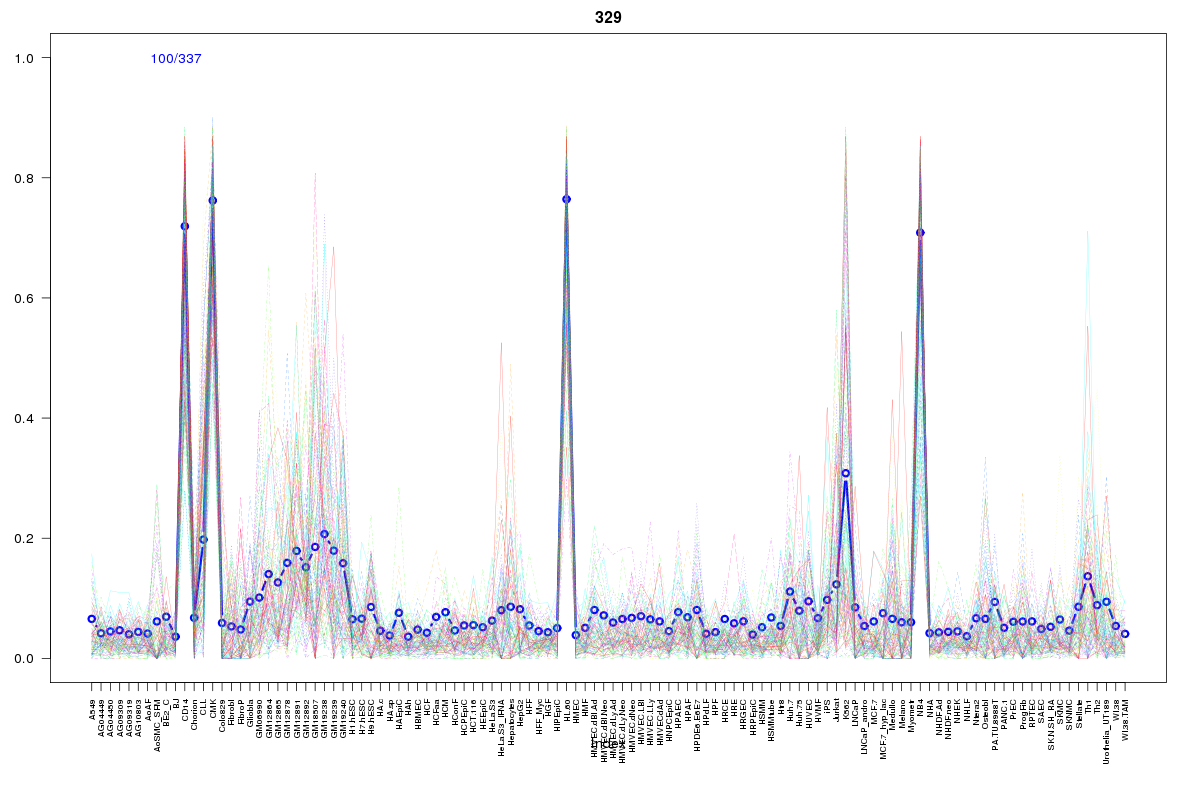 | 329 | 1 |
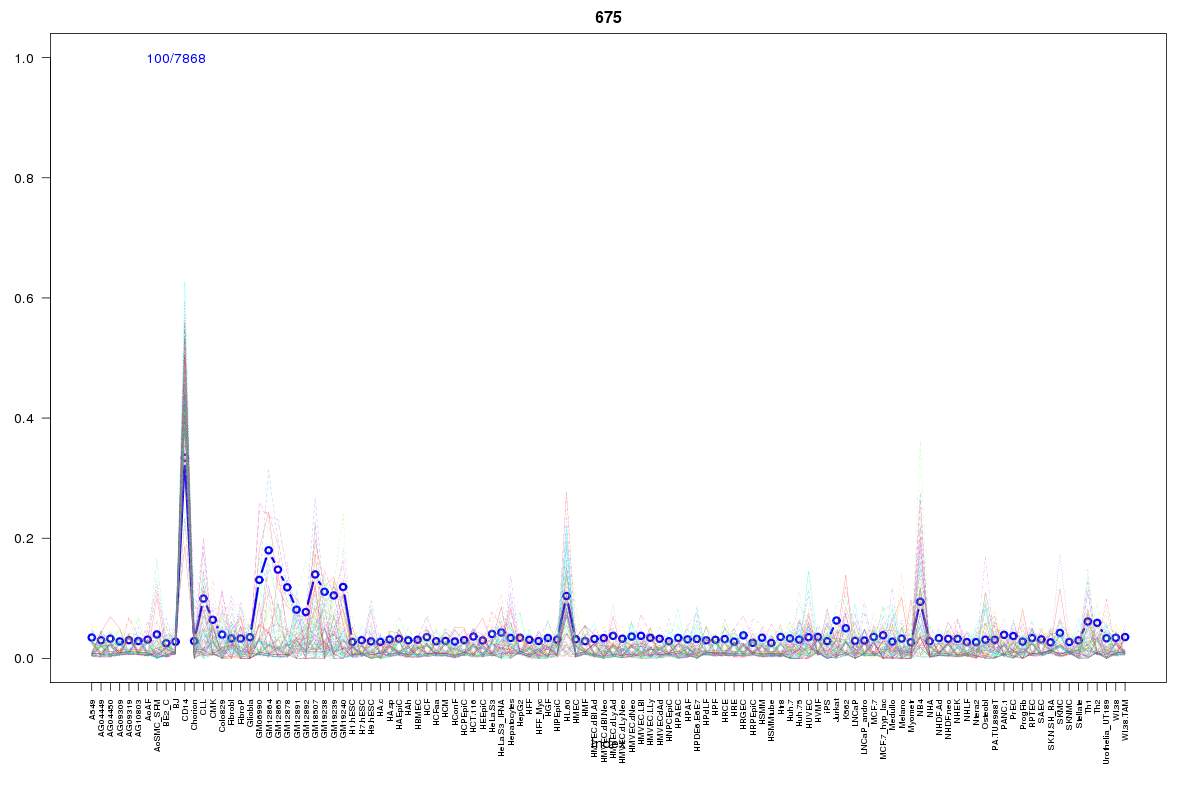 | 675 | 1 |
 | 2116 | 1 |
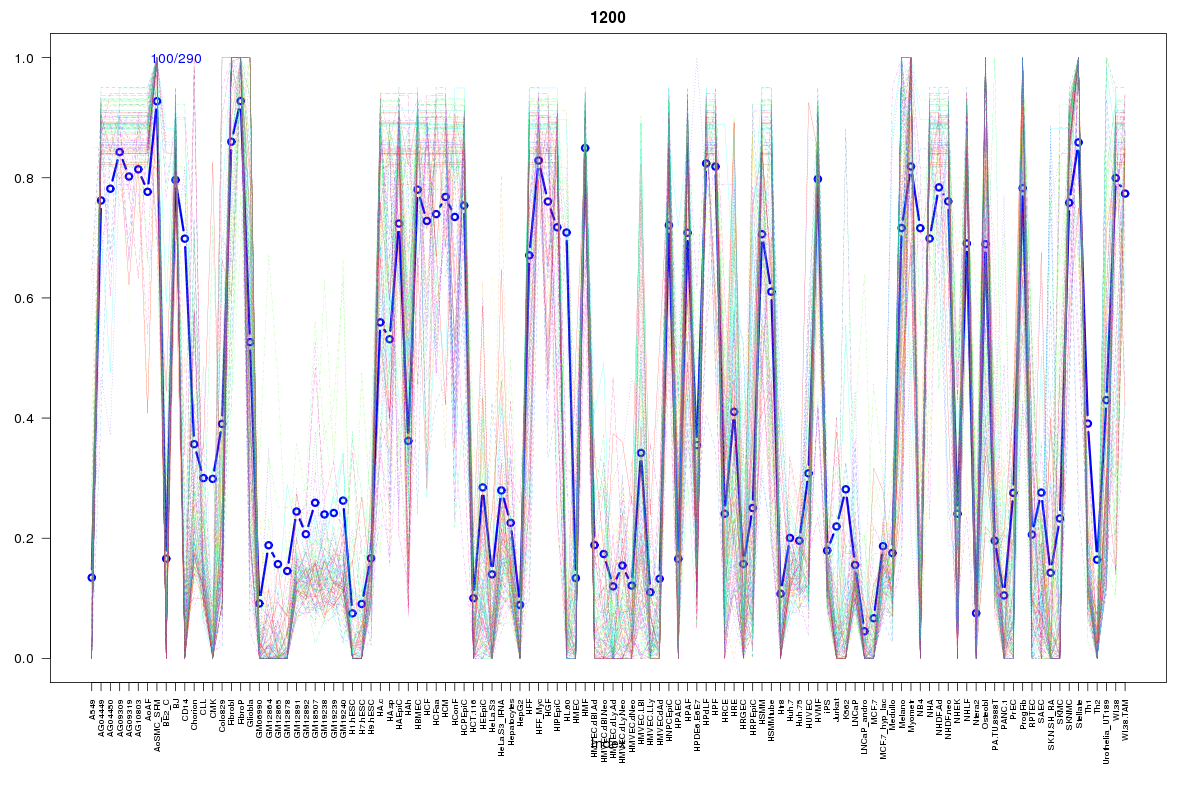 | 1200 | 1 |
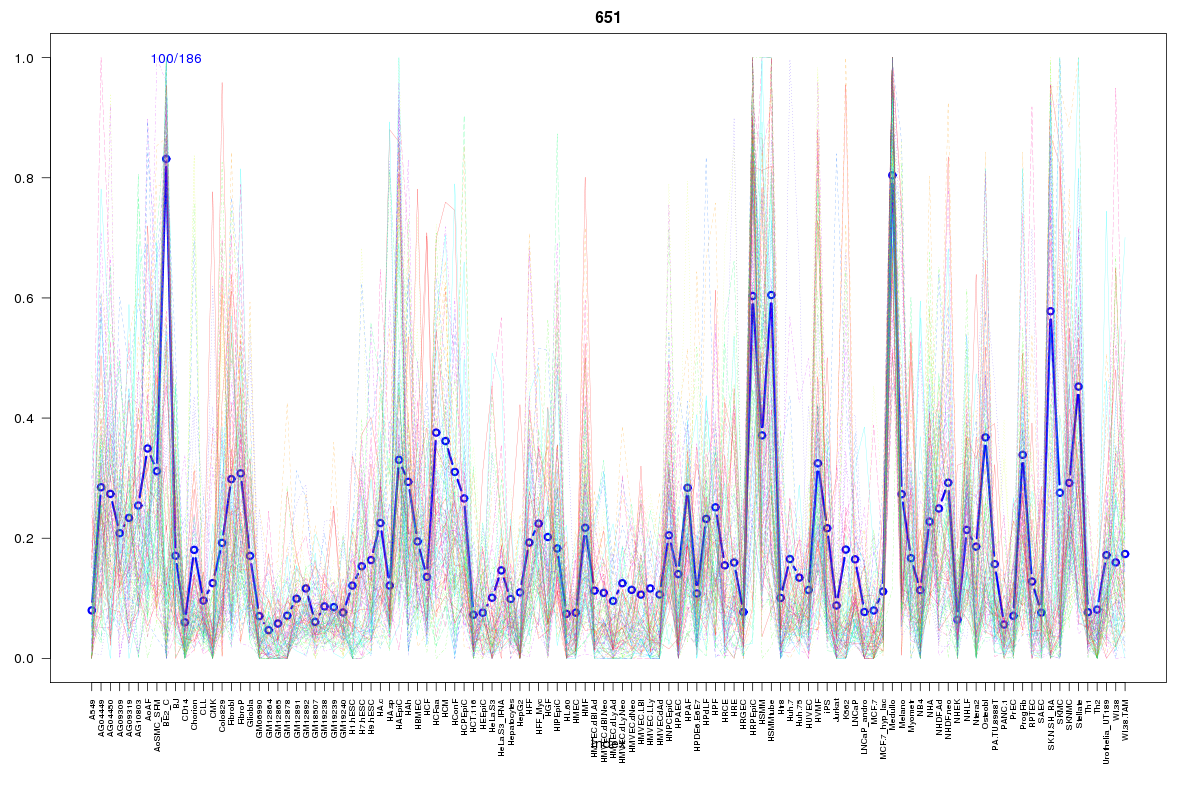 | 651 | 1 |
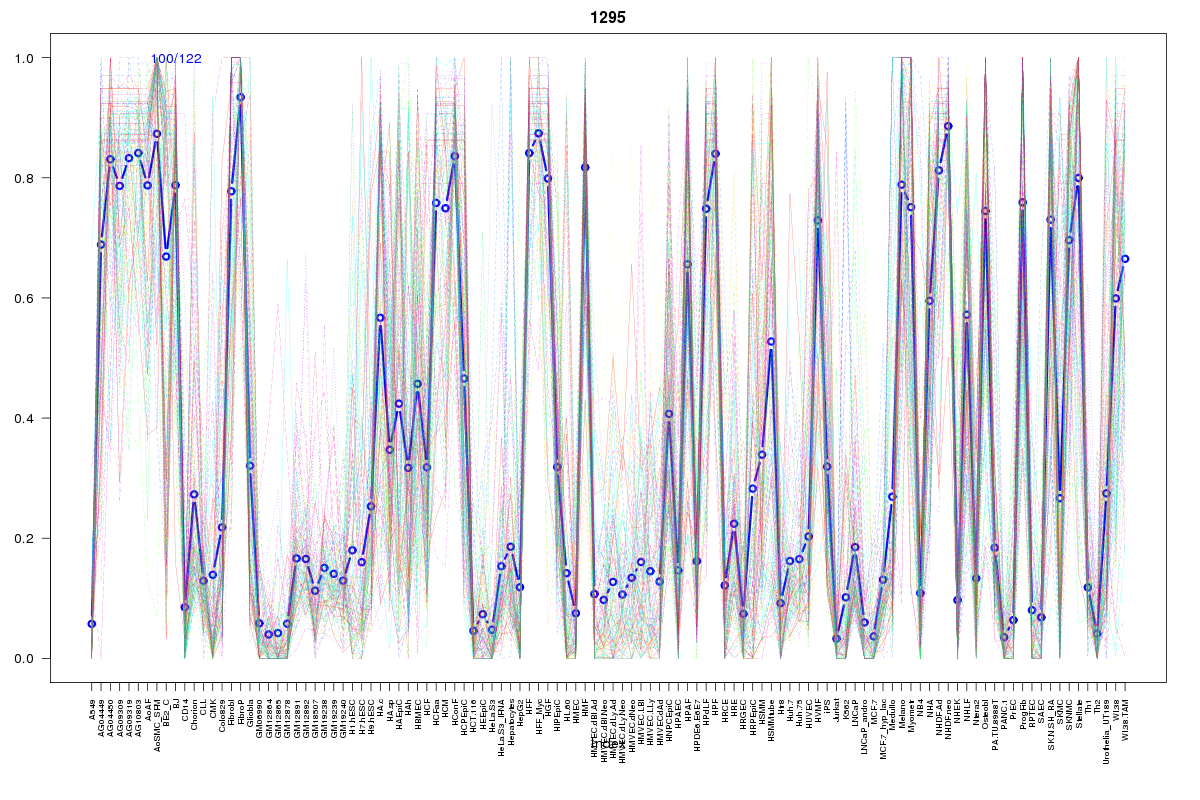 | 1295 | 1 |
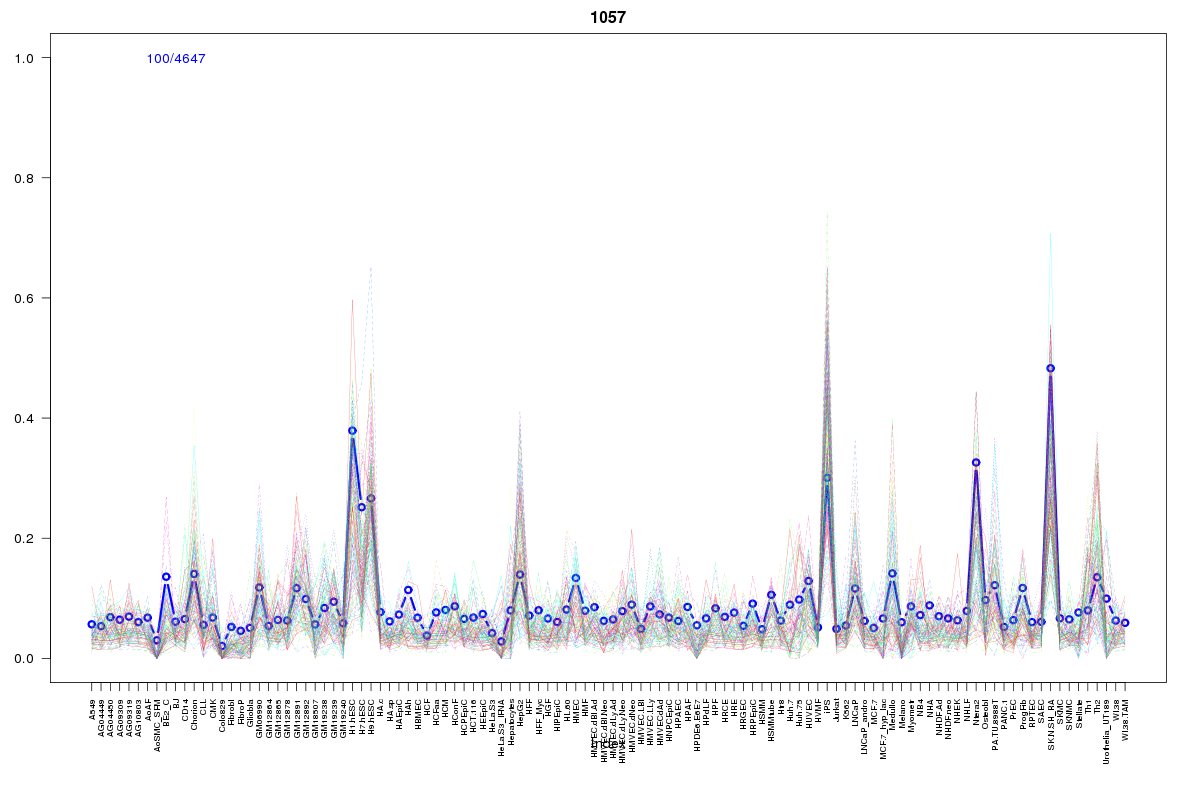 | 1057 | 1 |
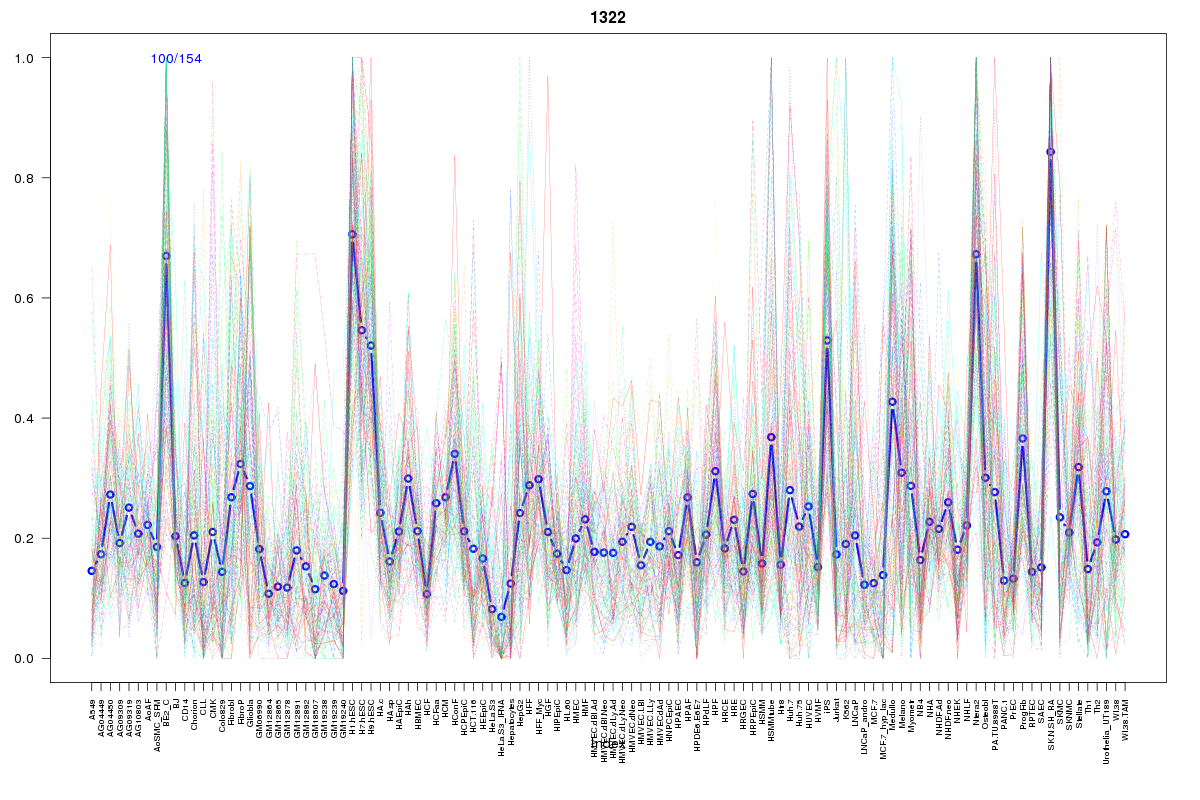 | 1322 | 1 |
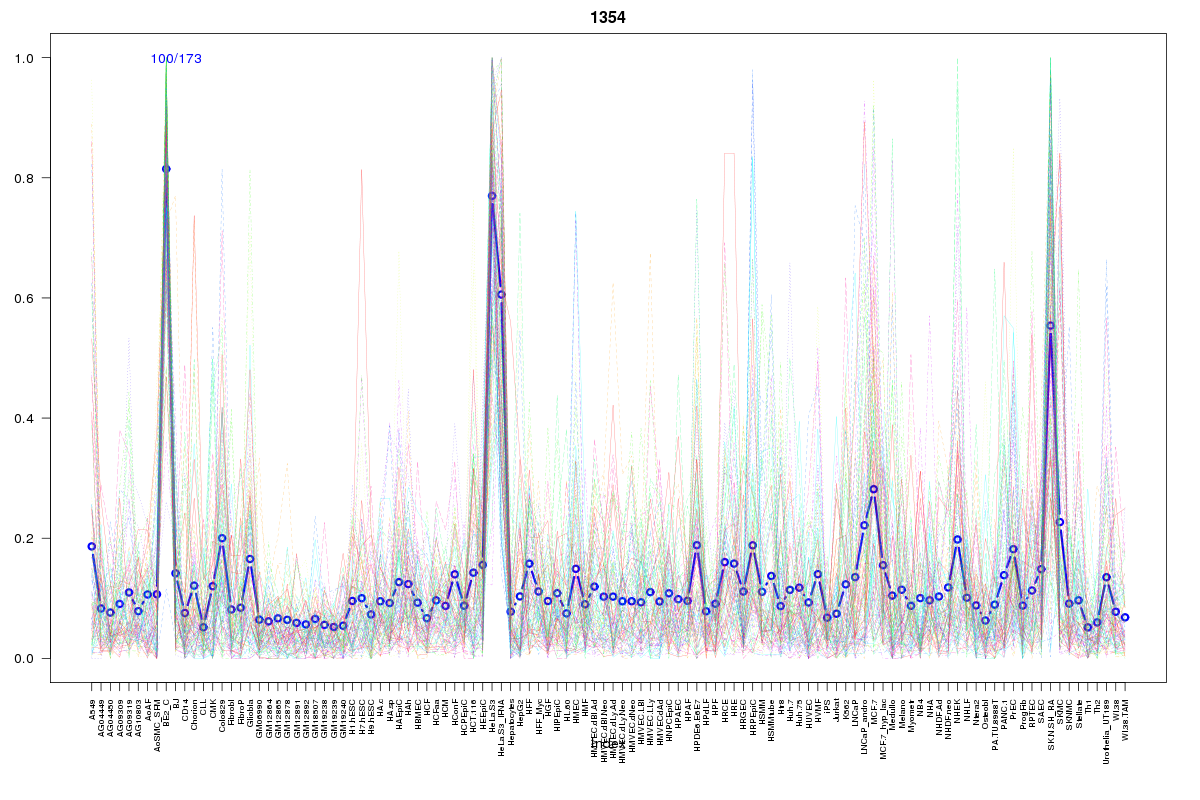 | 1354 | 1 |
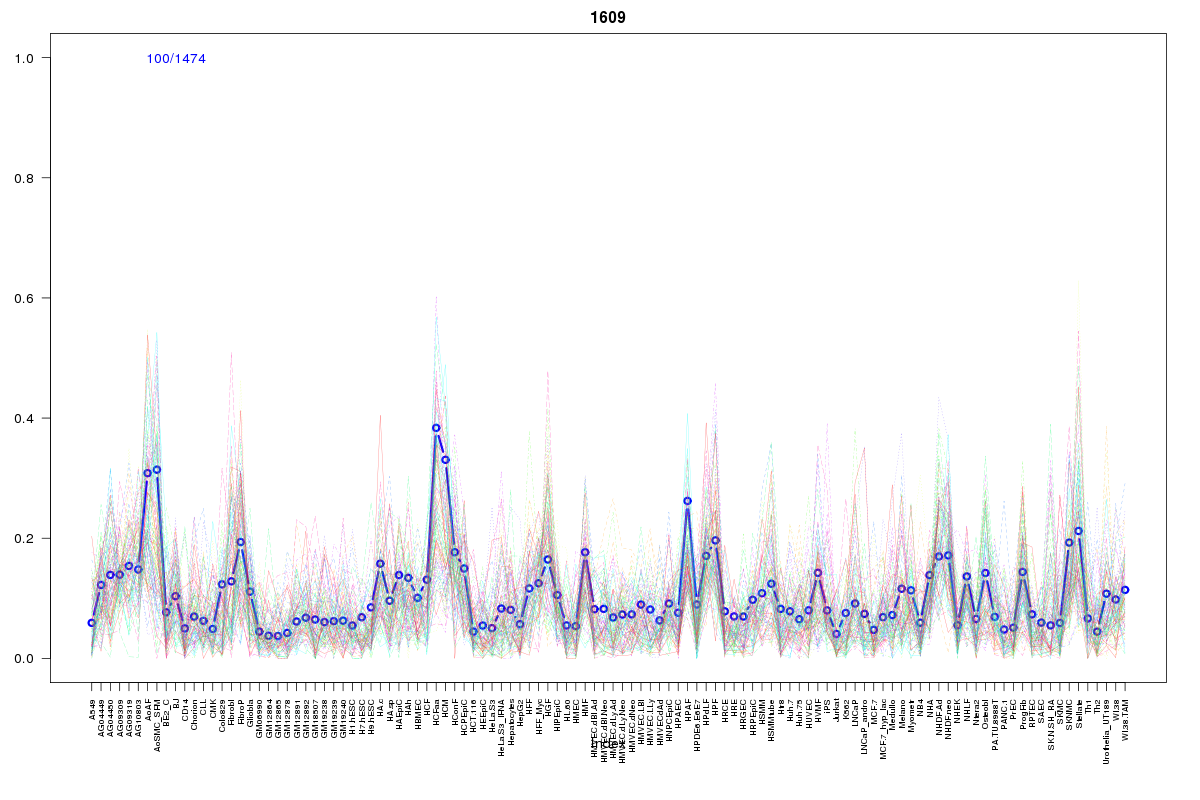 | 1609 | 1 |
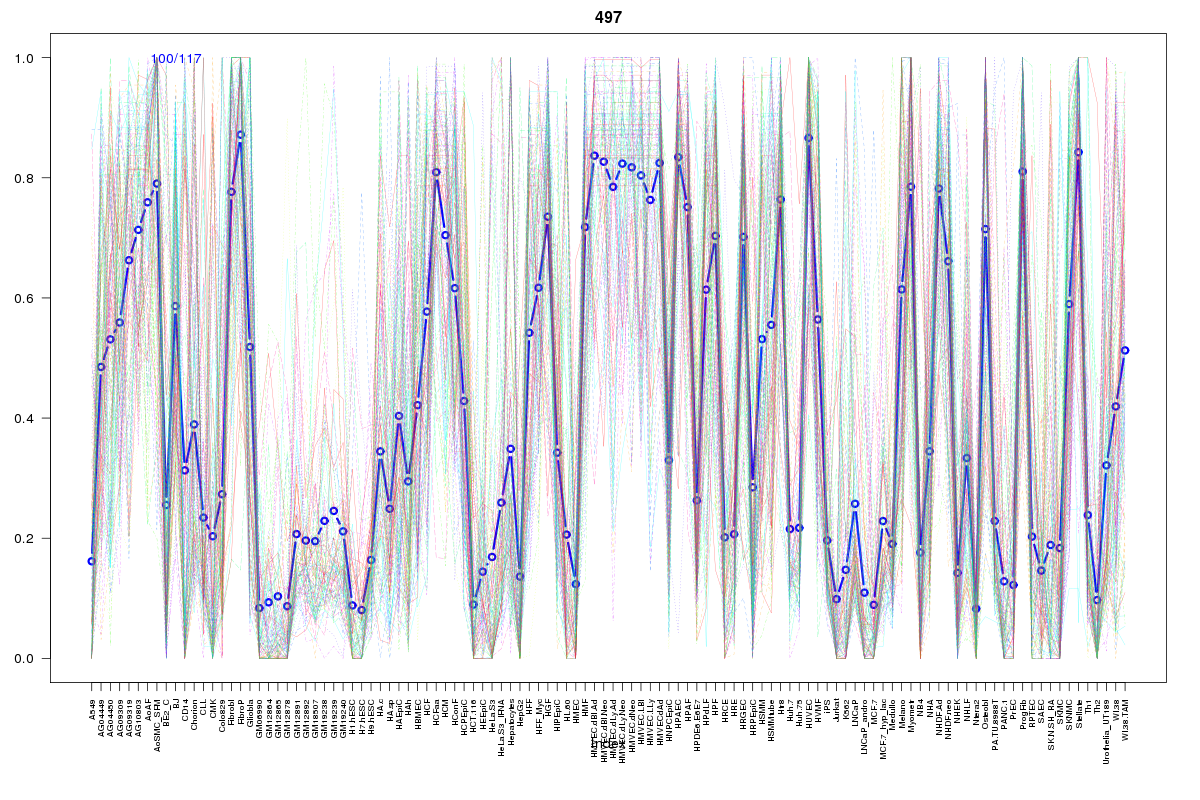 | 497 | 1 |
Resources
BED file downloads
Connects to 19 DHS sitesTop 10 Correlated DHS Sites
p-values indiciate significant higher or lower correlation| Location | Cluster | P-value |
|---|---|---|
| chr1:161108200-161108350 | 2055 | 0 |
| chr1:161183960-161184110 | 626 | 0.002 |
| chr1:161091125-161091275 | 2055 | 0.004 |
| chr1:161184900-161185050 | 329 | 0.004 |
| chr1:161184280-161184430 | 726 | 0.006 |
| chr1:161091740-161091890 | 2116 | 0.008 |
| chr1:161211560-161211710 | 675 | 0.009 |
| chr1:161256280-161256430 | 626 | 0.02 |
| chr1:161195520-161195670 | 100 | 0.024 |
| chr1:161168005-161168155 | 1057 | 0.019 |
| chr1:161168440-161168590 | 1354 | 0.015 |
External Databases
UCSCEnsembl (ENSG00000158869)