Gene: MIER3
chr5: 56215428-56247945Expression Profile
(log scale)
Graphical Connections
Distribution of linked clusters:
You may find it interesting if many of the connected DHS sites belong to the same cluster.| Cluster Profile | Cluster ID | Number of DHS sites in this cluster |
|---|---|---|
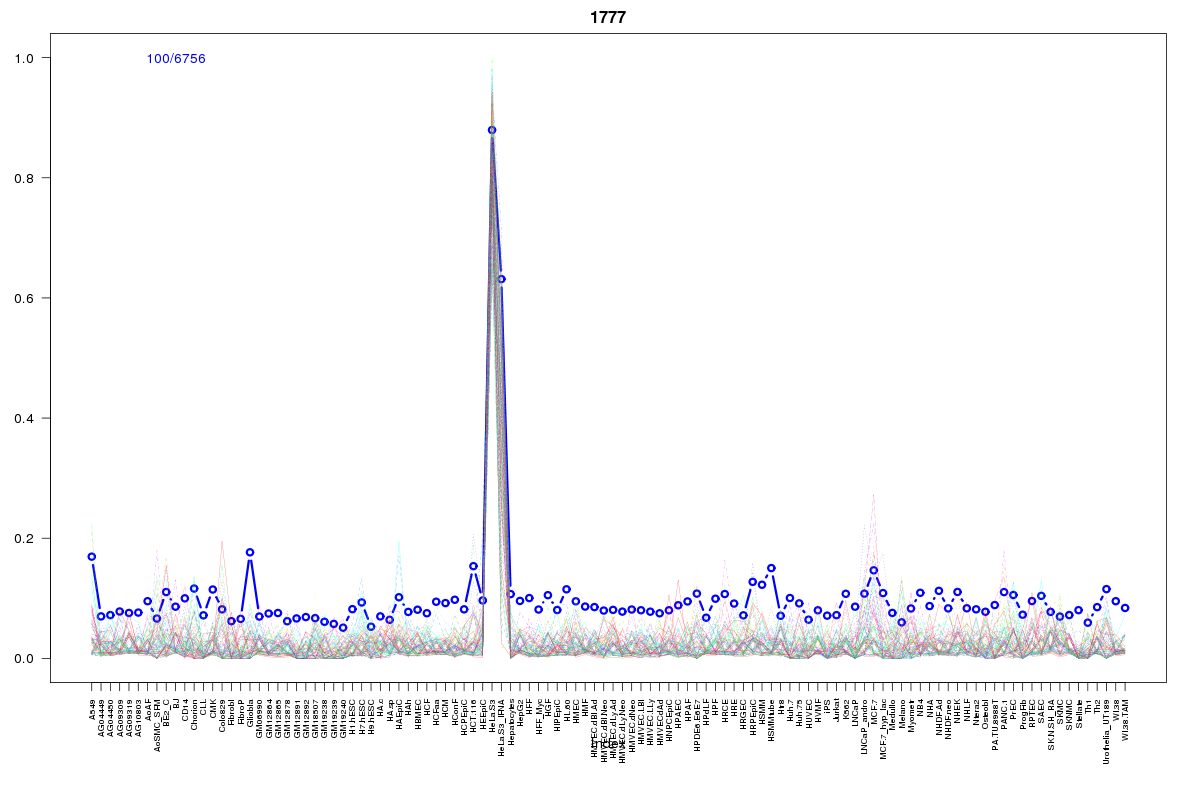 | 1777 | 4 |
 | 1724 | 2 |
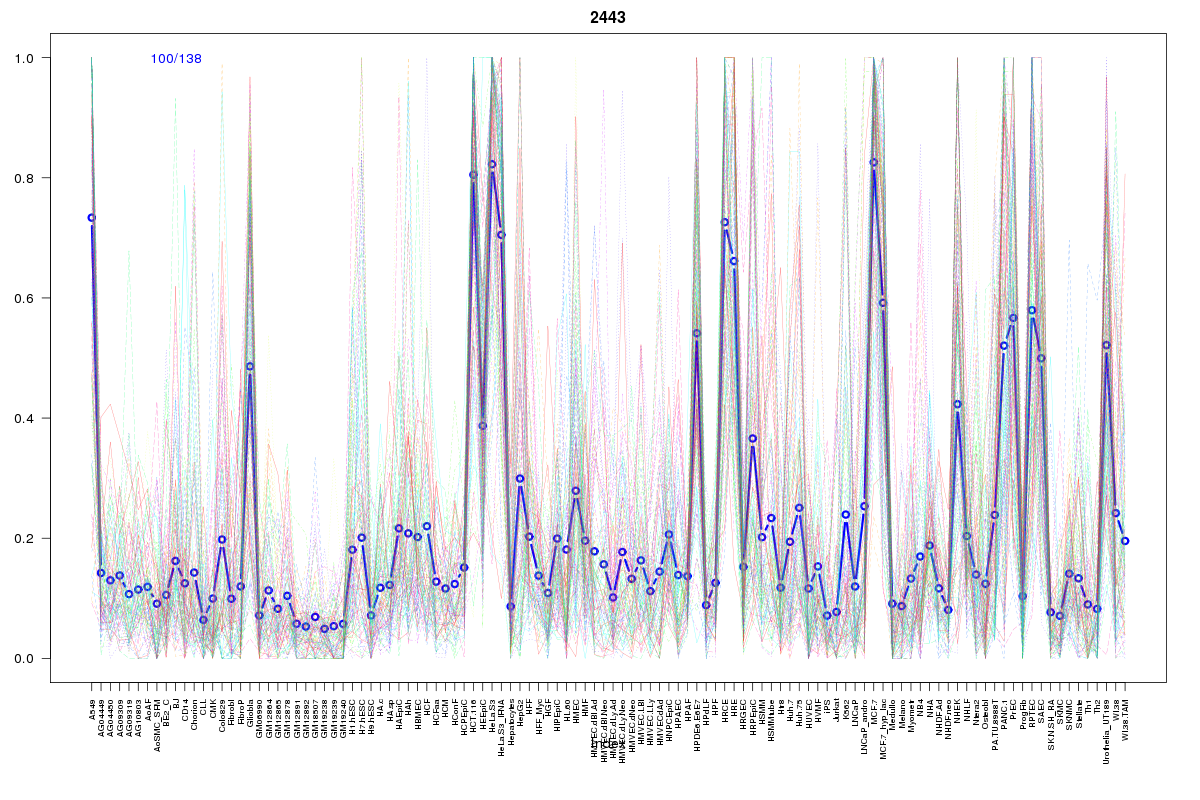 | 2443 | 1 |
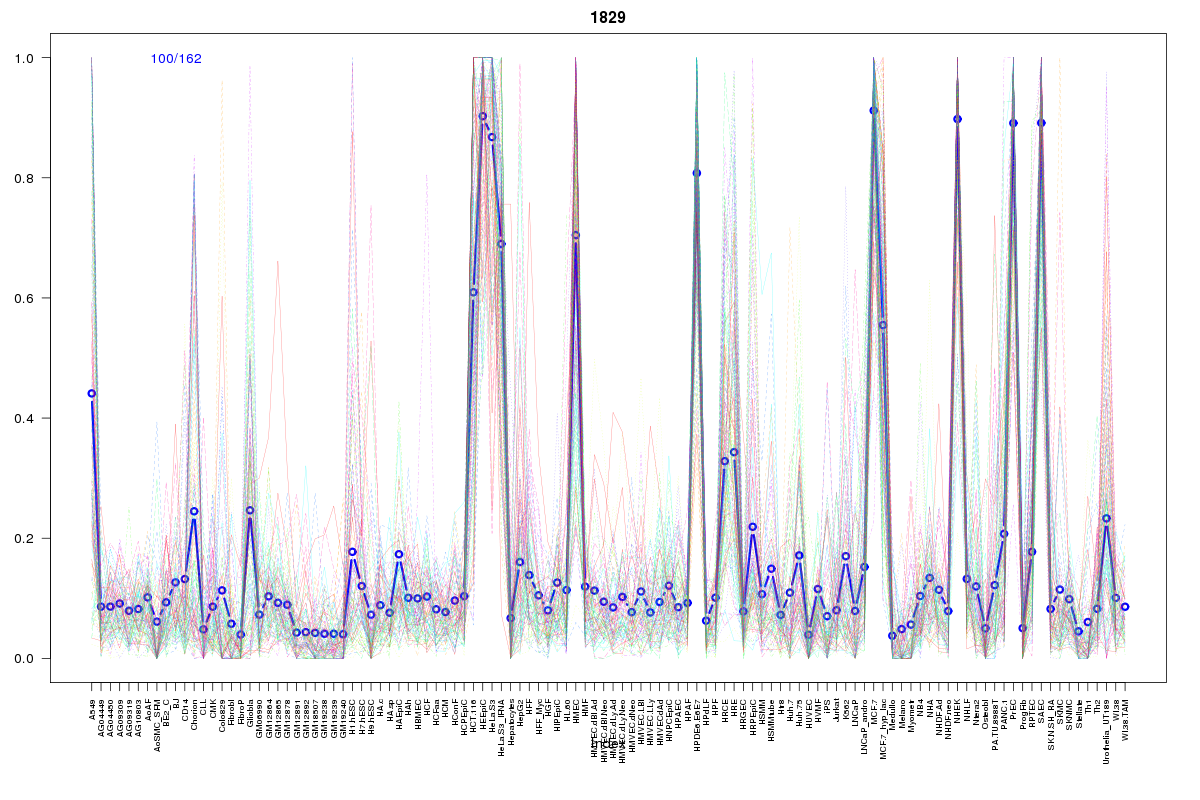 | 1829 | 1 |
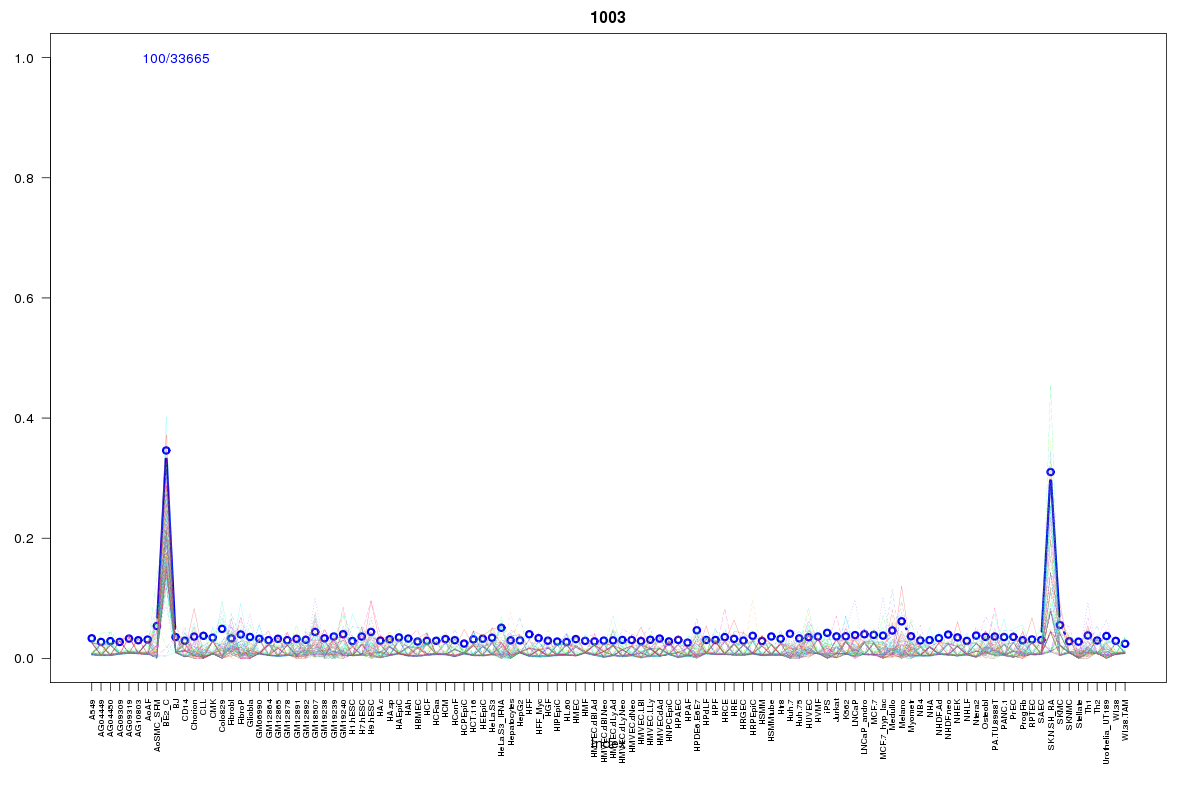 | 1003 | 1 |
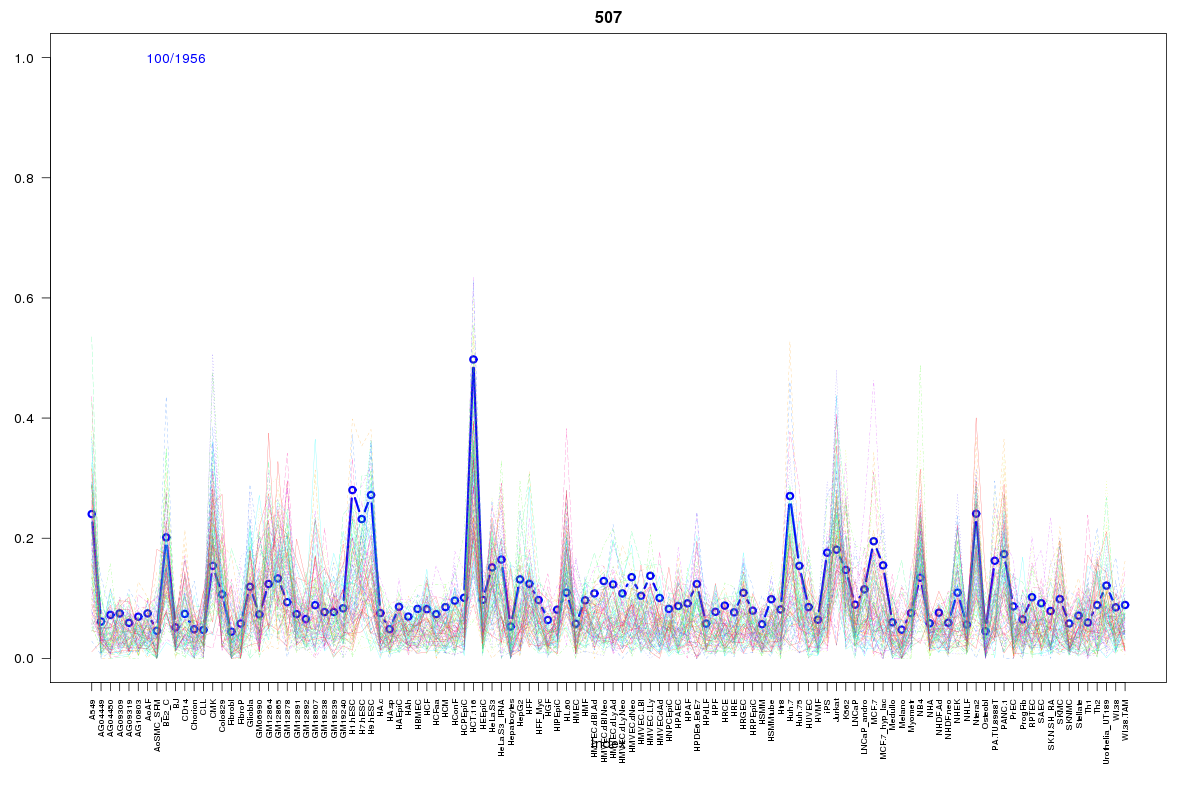 | 507 | 1 |
 | 1177 | 1 |
 | 2059 | 1 |
 | 1980 | 1 |
Resources
BED file downloads
Connects to 13 DHS sitesTop 10 Correlated DHS Sites
p-values indiciate significant higher or lower correlation| Location | Cluster | P-value |
|---|---|---|
| chr5:56292200-56292350 | 1980 | 0 |
| chr5:56328100-56328250 | 2443 | 0.002 |
| chr5:56299040-56299190 | 1777 | 0.005 |
| chr5:56248465-56248615 | 2059 | 0.005 |
| chr5:56196740-56196890 | 1177 | 0.005 |
| chr5:56300965-56301115 | 1777 | 0.007 |
| chr5:56122965-56123115 | 507 | 0.01 |
| chr5:56329060-56329210 | 1829 | 0.014 |
| chr5:56305805-56305955 | 1724 | 0.014 |
| chr5:56327725-56327875 | 1777 | 0.019 |
| chr5:56346905-56347055 | 1777 | 0.023 |
External Databases
UCSCEnsembl (ENSG00000155545)