Gene: ATP10D
chr4: 47487304-47595503Expression Profile
(log scale)
Graphical Connections
Distribution of linked clusters:
You may find it interesting if many of the connected DHS sites belong to the same cluster.| Cluster Profile | Cluster ID | Number of DHS sites in this cluster |
|---|---|---|
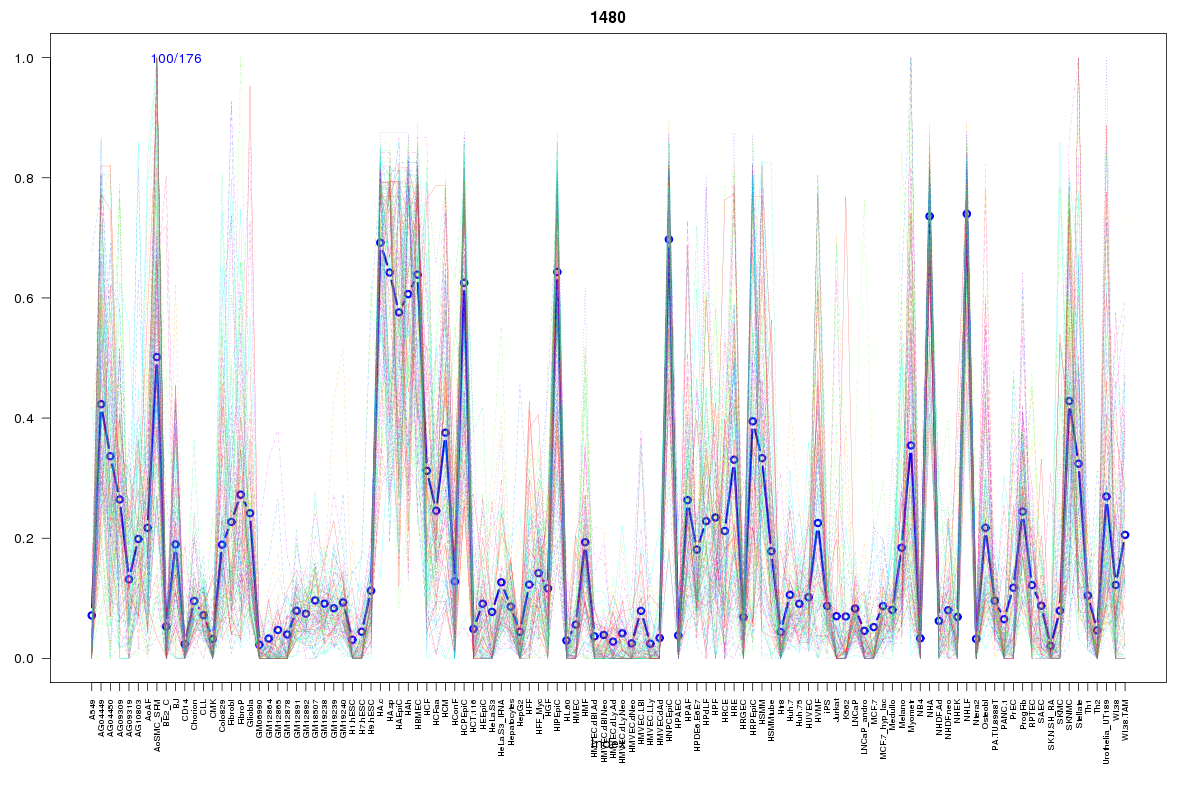 | 1480 | 1 |
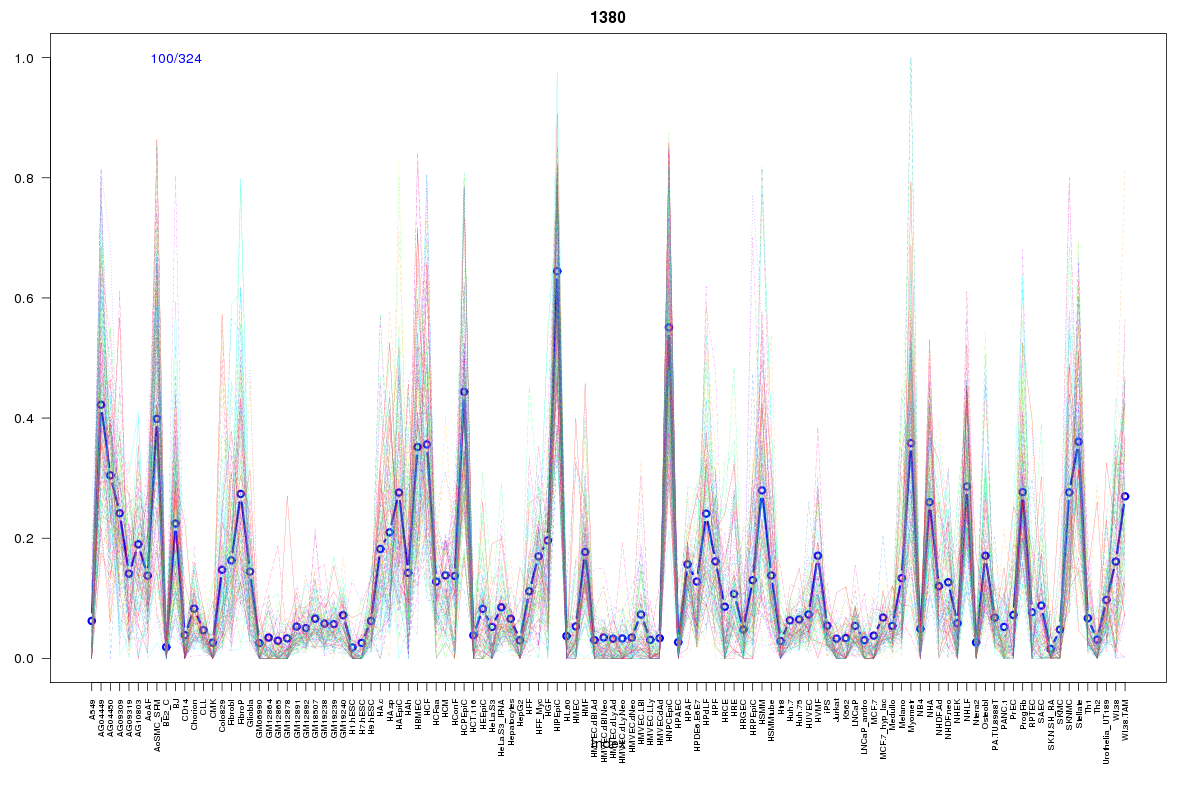 | 1380 | 1 |
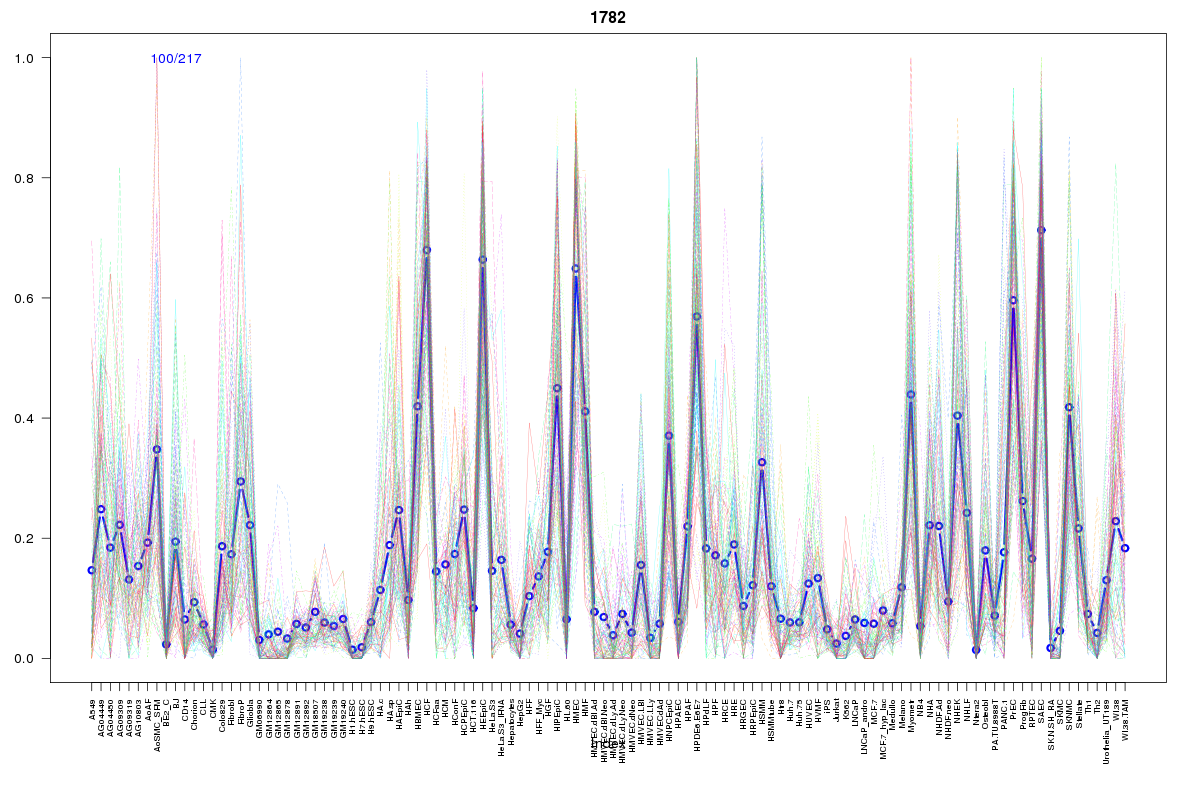 | 1782 | 1 |
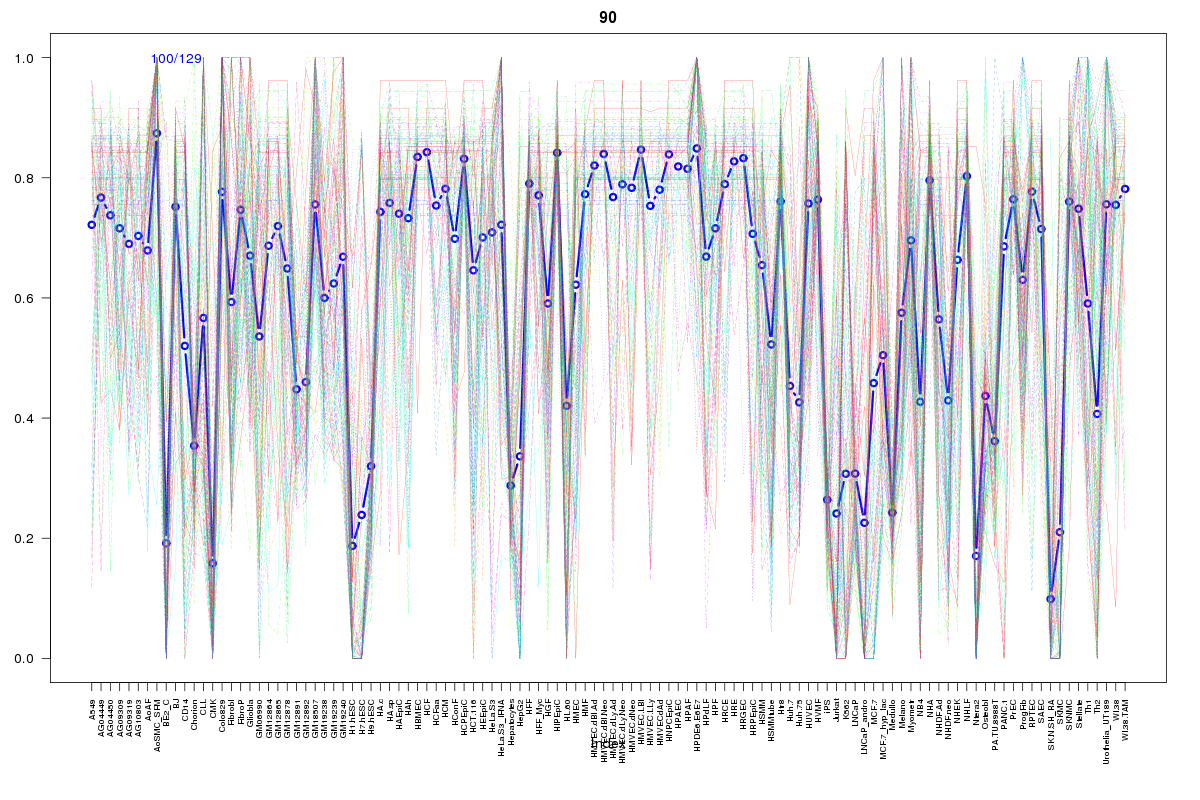 | 90 | 1 |
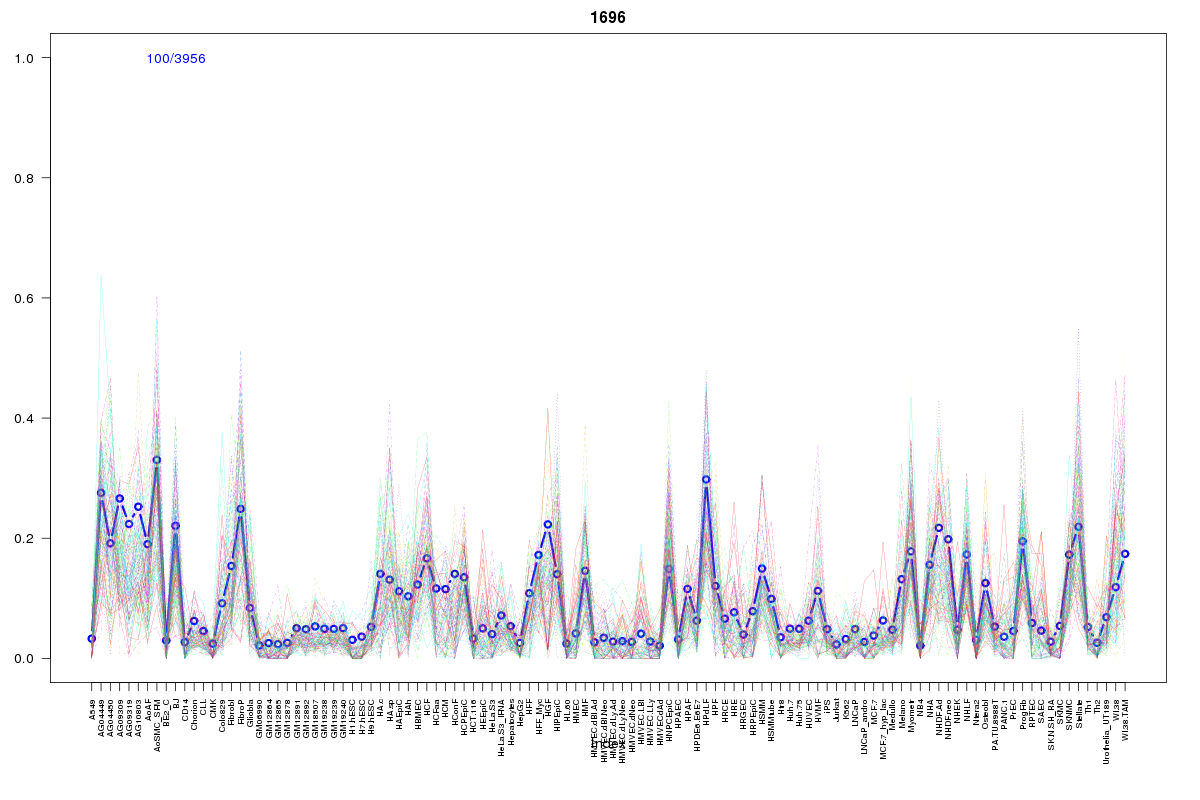 | 1696 | 1 |
 | 946 | 1 |
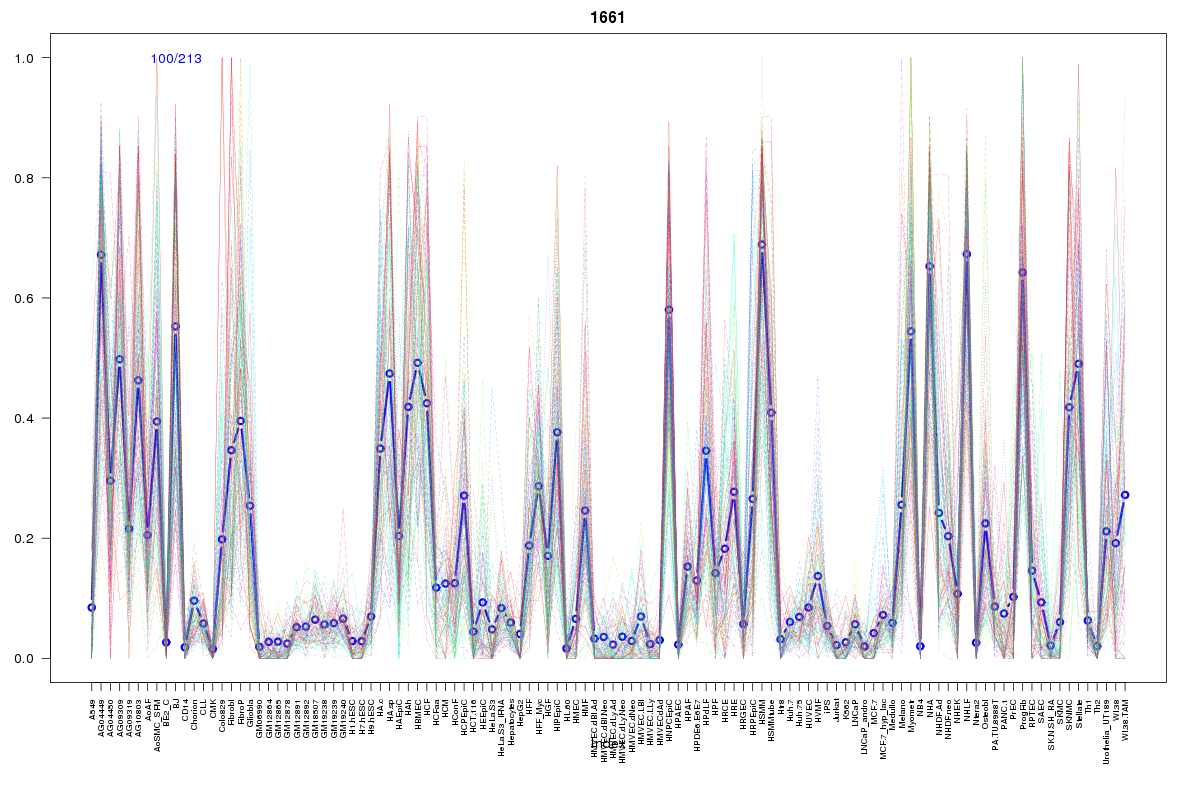 | 1661 | 1 |
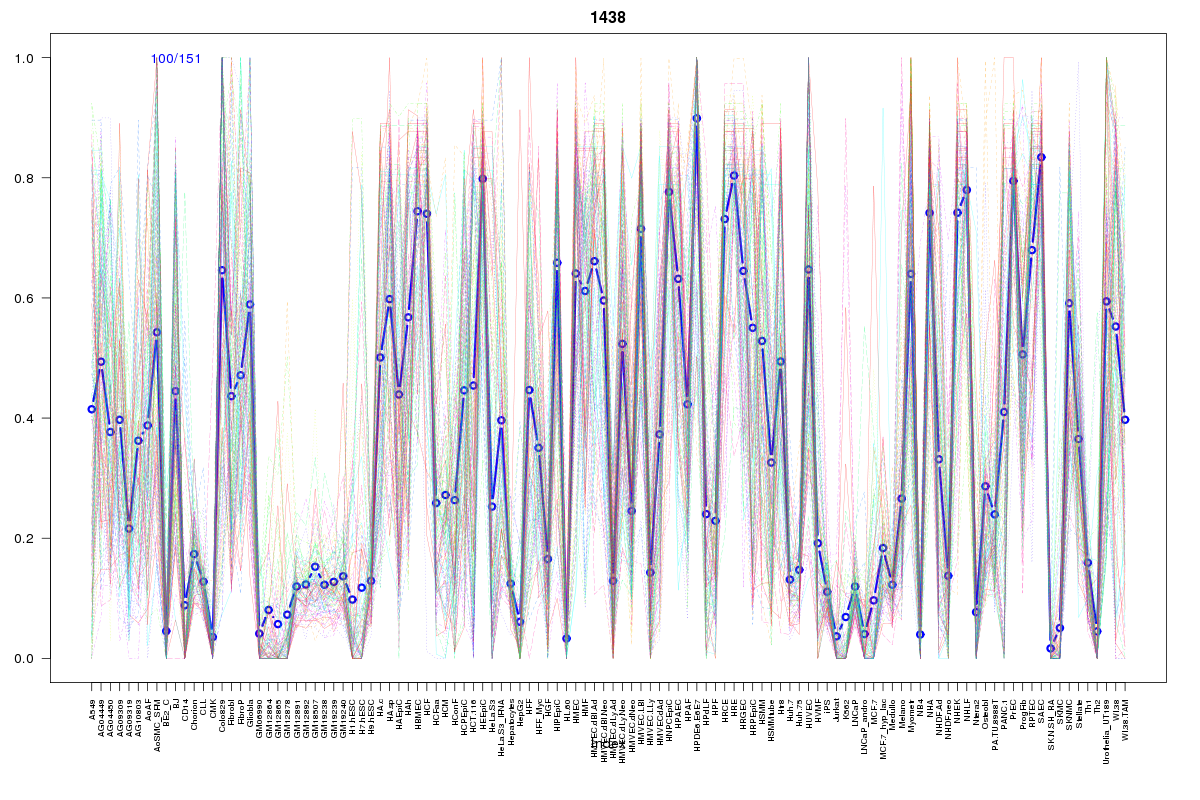 | 1438 | 1 |
 | 1241 | 1 |
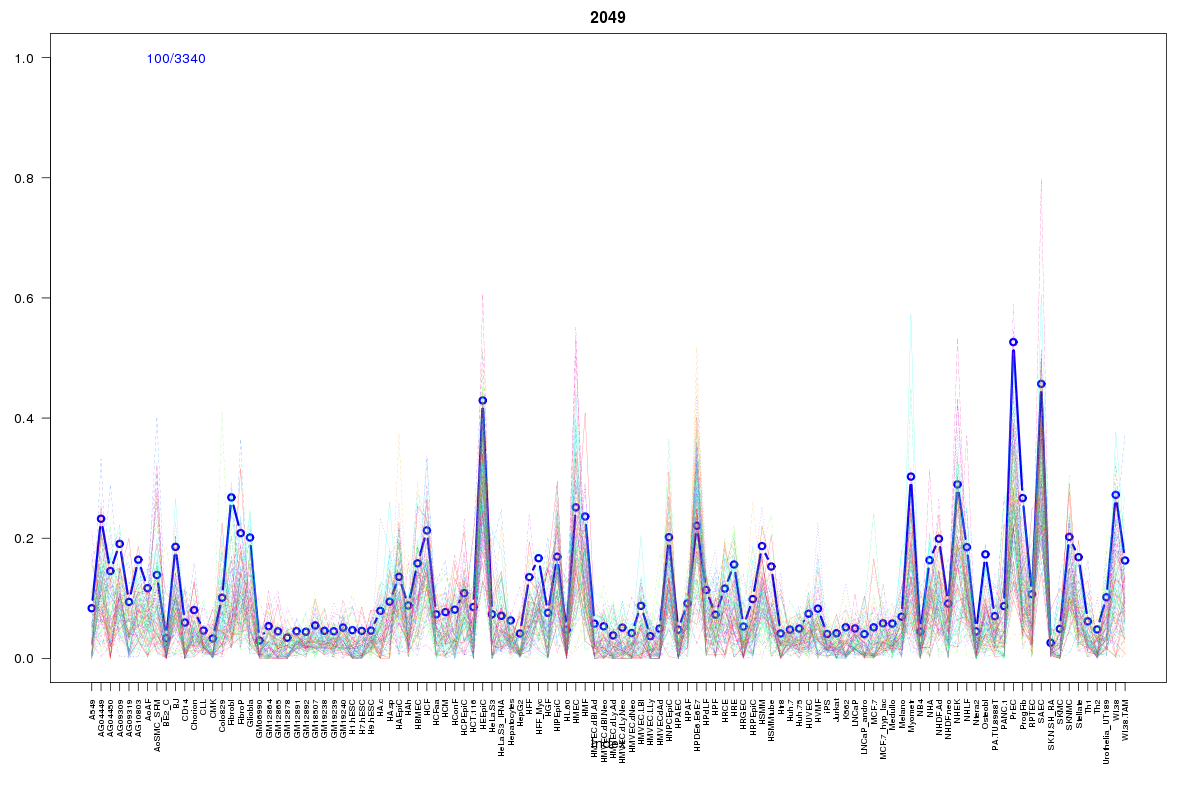 | 2049 | 1 |
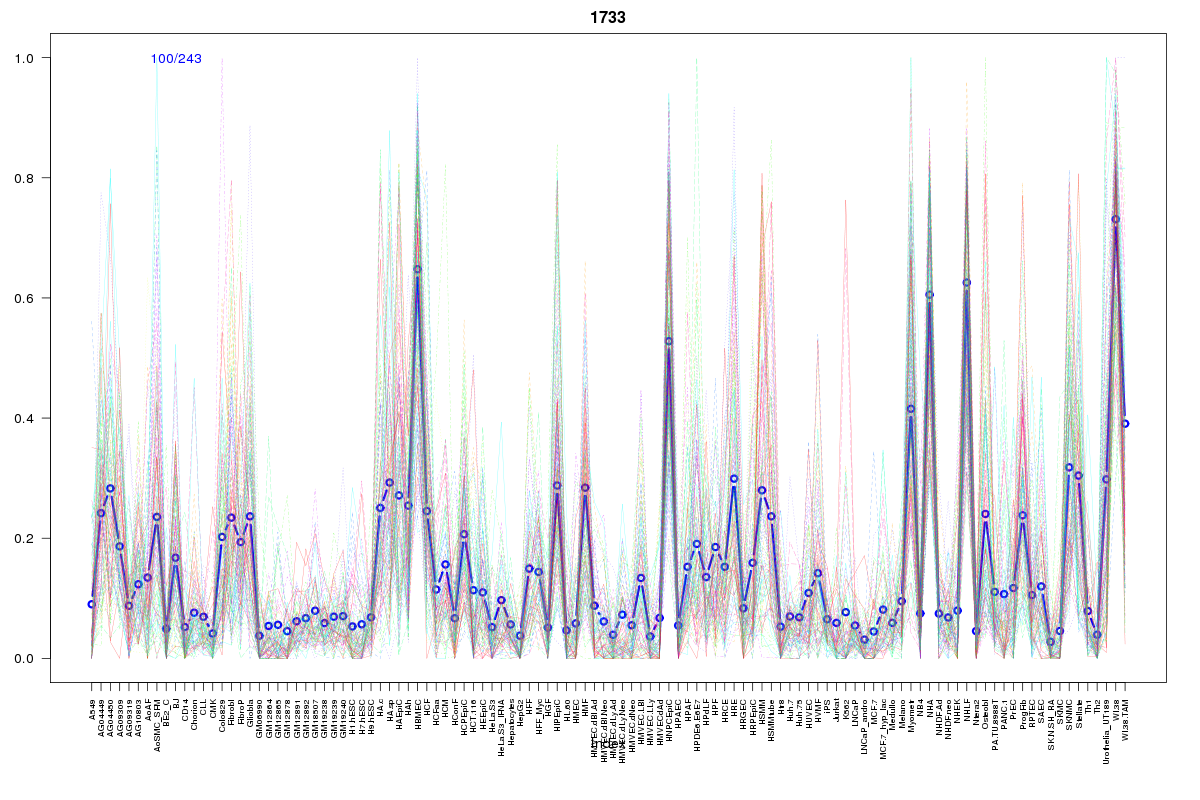 | 1733 | 1 |
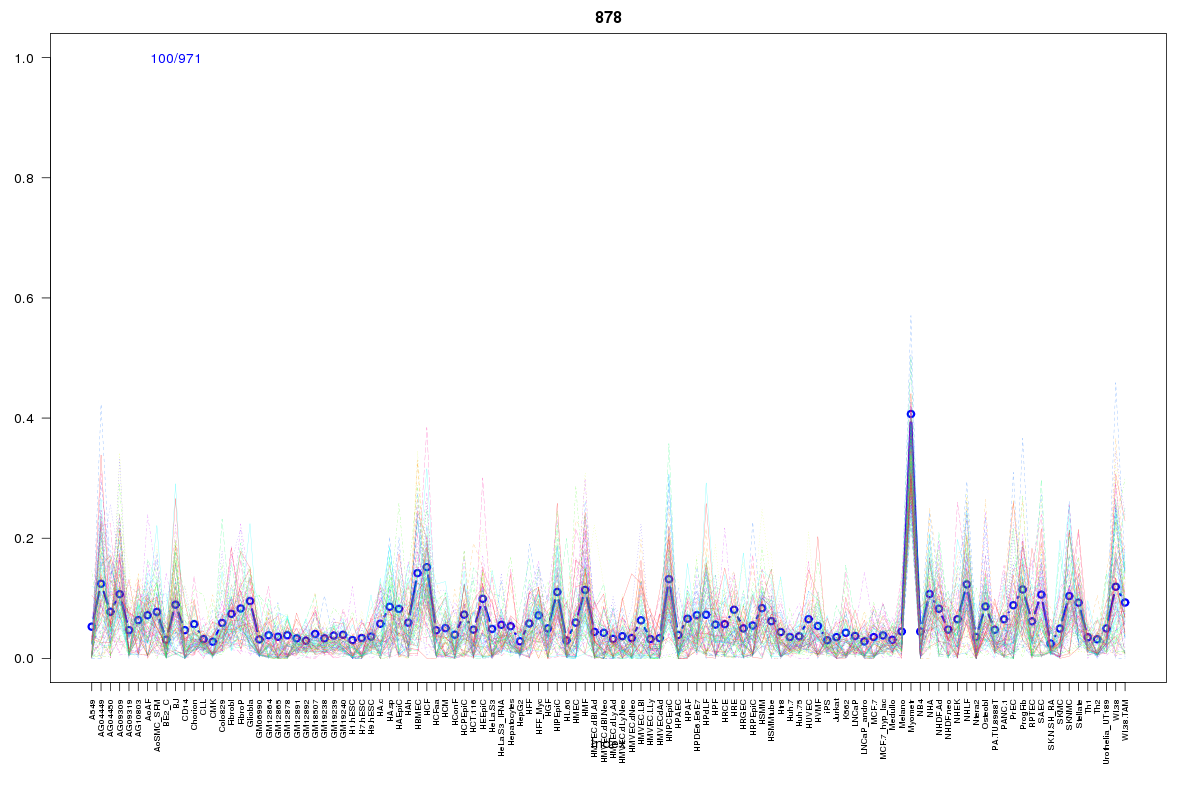 | 878 | 1 |
Resources
BED file downloads
Connects to 12 DHS sitesTop 10 Correlated DHS Sites
p-values indiciate significant higher or lower correlation| Location | Cluster | P-value |
|---|---|---|
| chr4:47527580-47527730 | 946 | 0 |
| chr4:47487500-47487650 | 90 | 0.001 |
| chr4:47533380-47533530 | 1438 | 0.004 |
| chr4:47484480-47484630 | 1782 | 0.004 |
| chr4:47553820-47553970 | 1733 | 0.007 |
| chr4:47533780-47533930 | 1241 | 0.01 |
| chr4:47472080-47472230 | 1380 | 0.01 |
| chr4:47530900-47531050 | 1661 | 0.012 |
| chr4:47488540-47488690 | 1696 | 0.015 |
| chr4:47617580-47617730 | 878 | 0.016 |
| chr4:47544800-47544950 | 2049 | 0.02 |
External Databases
UCSCEnsembl (ENSG00000145246)