Gene: ACTA1
chr1: 229566991-229569841Expression Profile
(log scale)
Graphical Connections
Distribution of linked clusters:
You may find it interesting if many of the connected DHS sites belong to the same cluster.| Cluster Profile | Cluster ID | Number of DHS sites in this cluster |
|---|---|---|
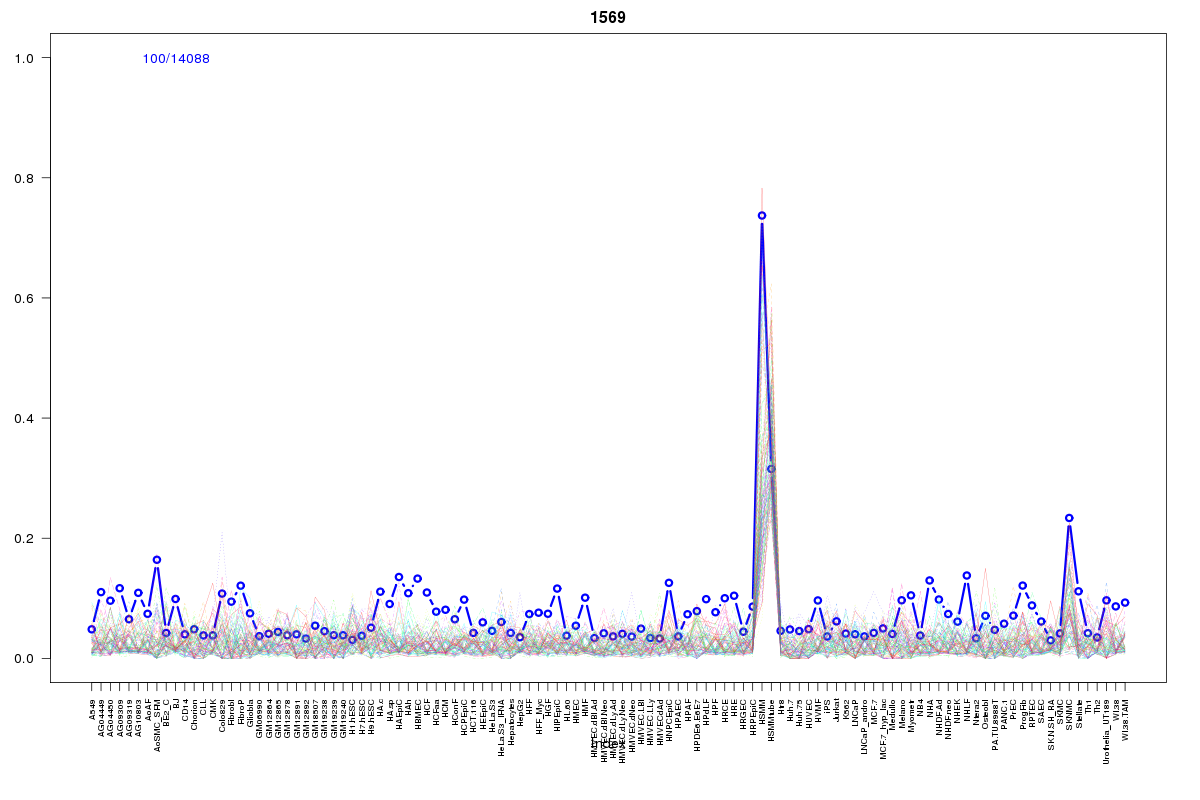 | 1569 | 5 |
 | 1721 | 3 |
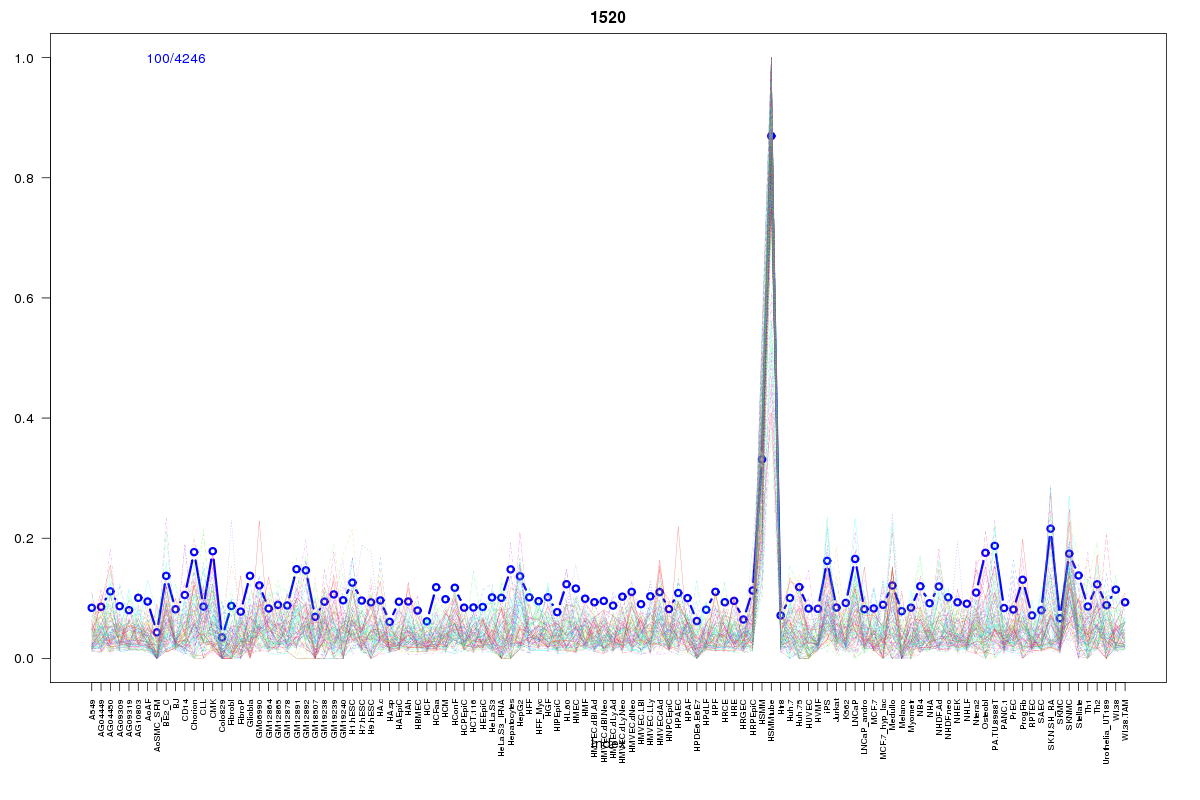 | 1520 | 1 |
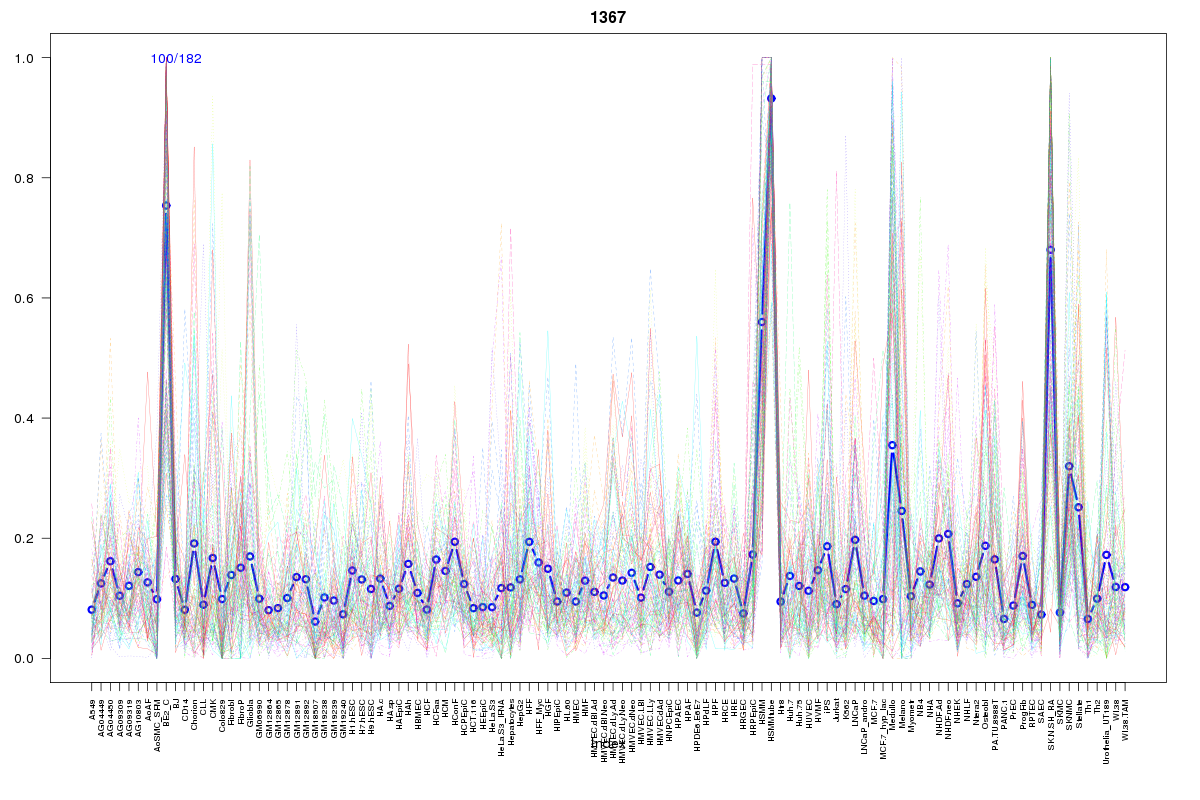 | 1367 | 1 |
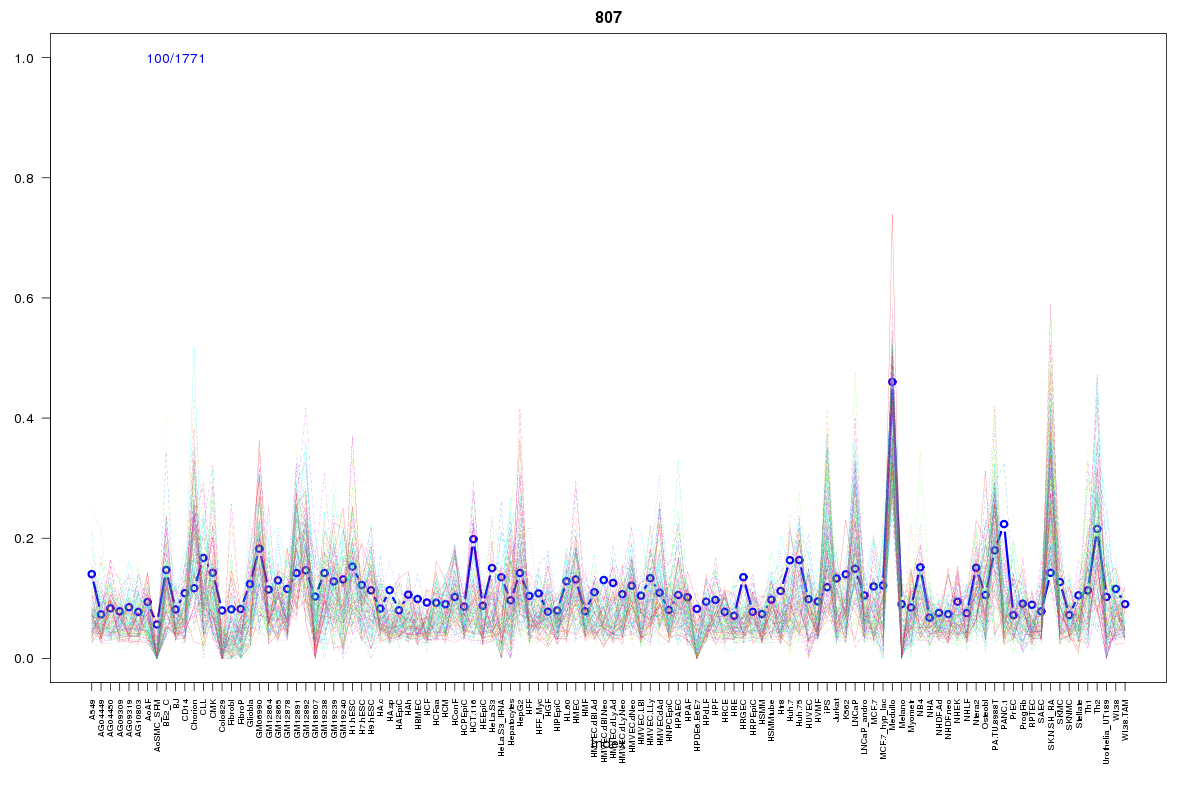 | 807 | 1 |
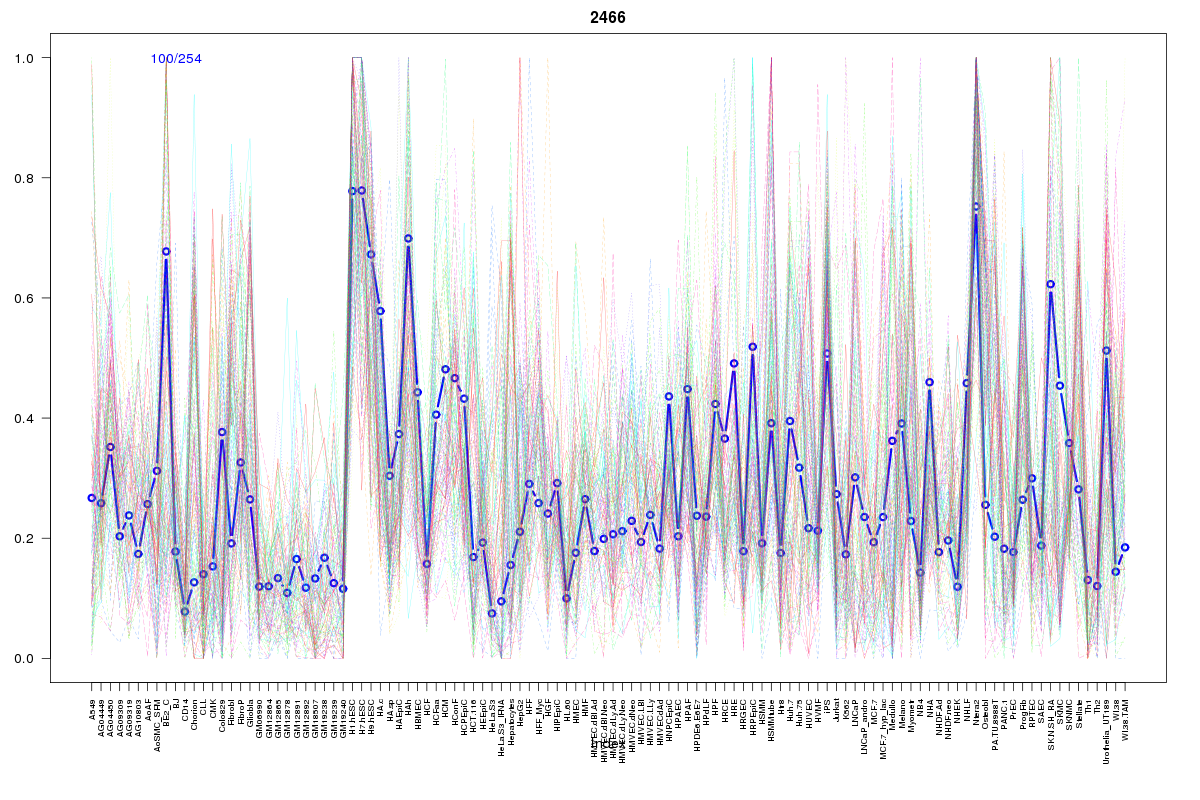 | 2466 | 1 |
 | 110 | 1 |
 | 253 | 1 |
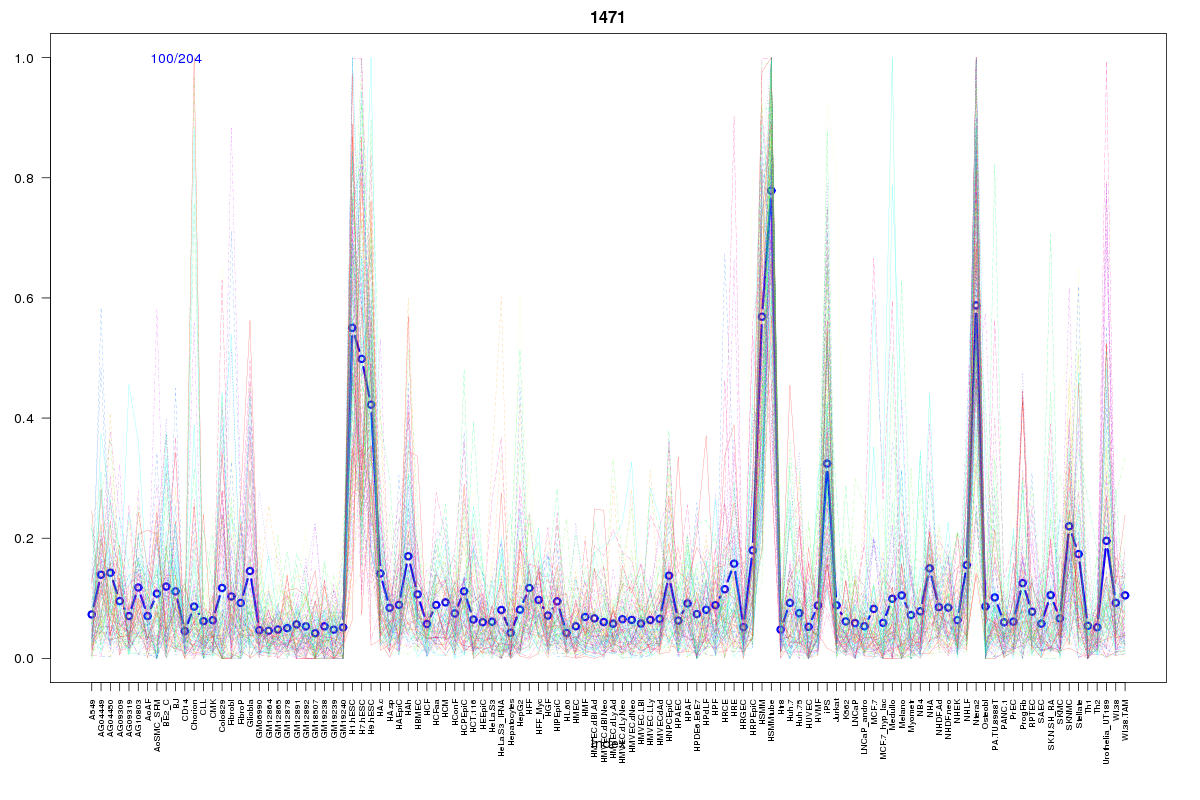 | 1471 | 1 |
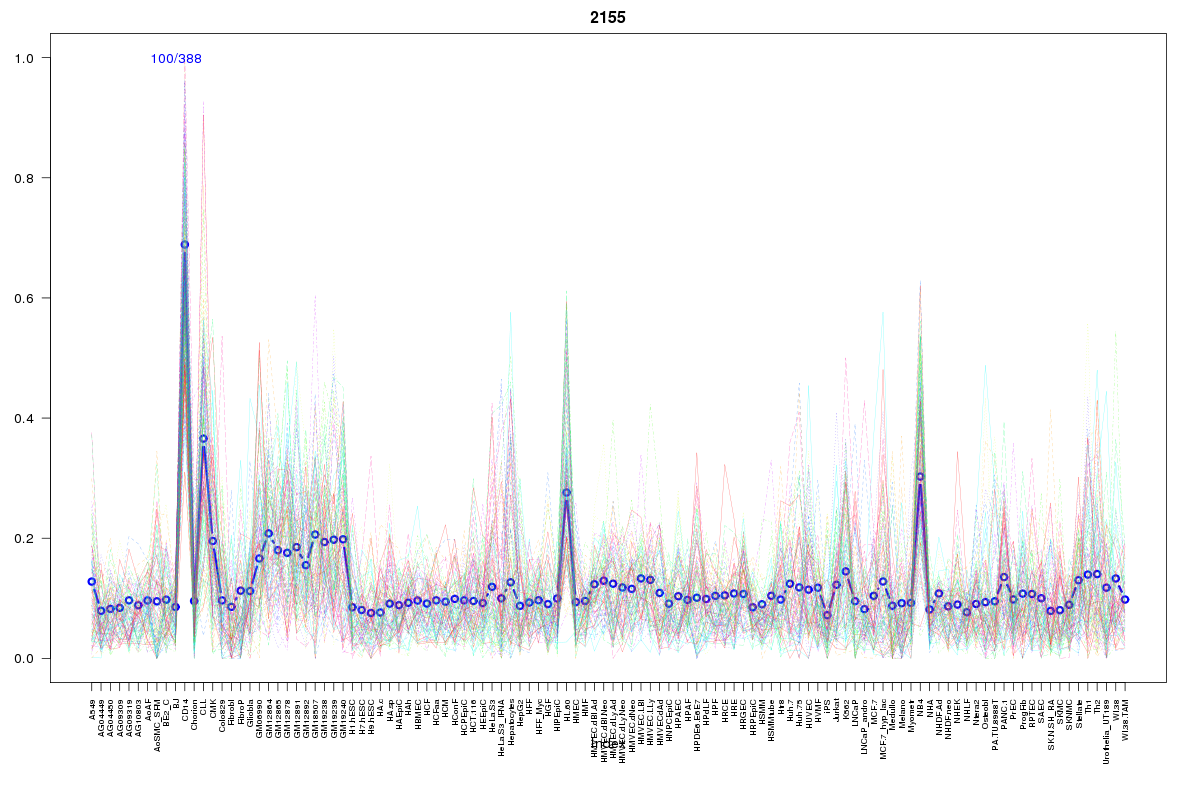 | 2155 | 1 |
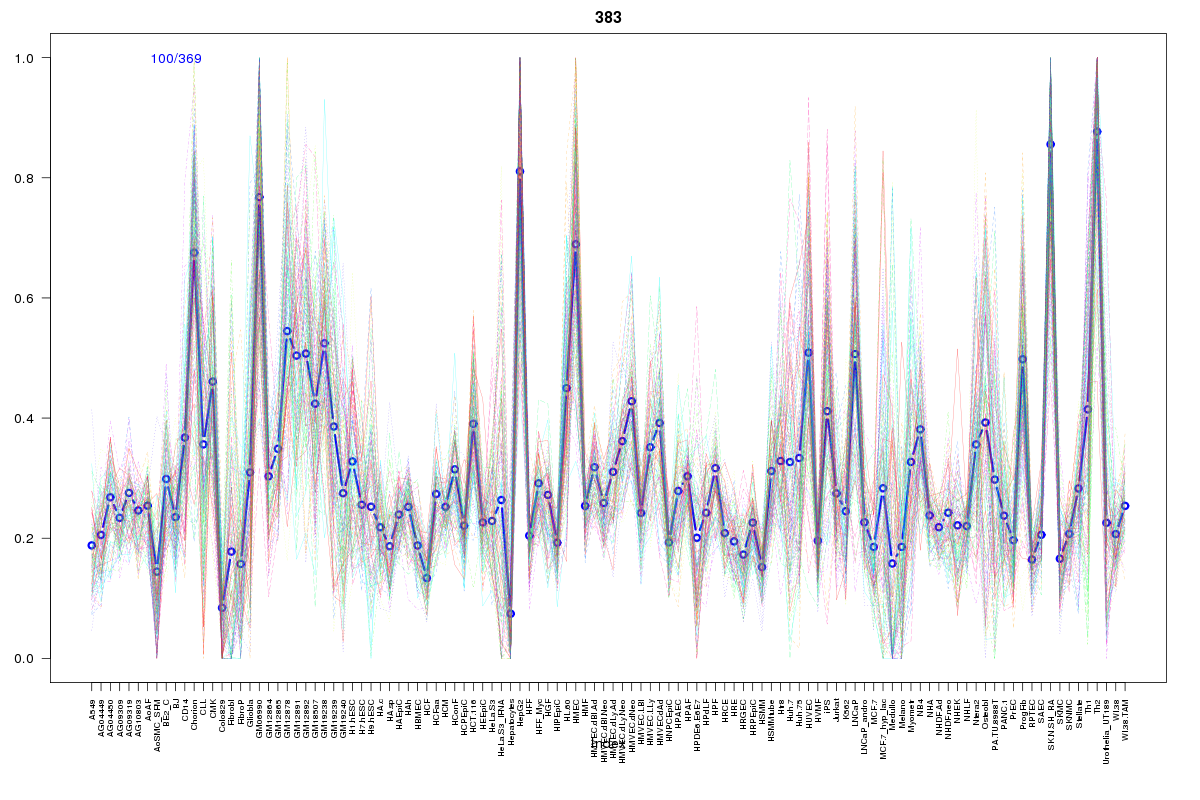 | 383 | 1 |
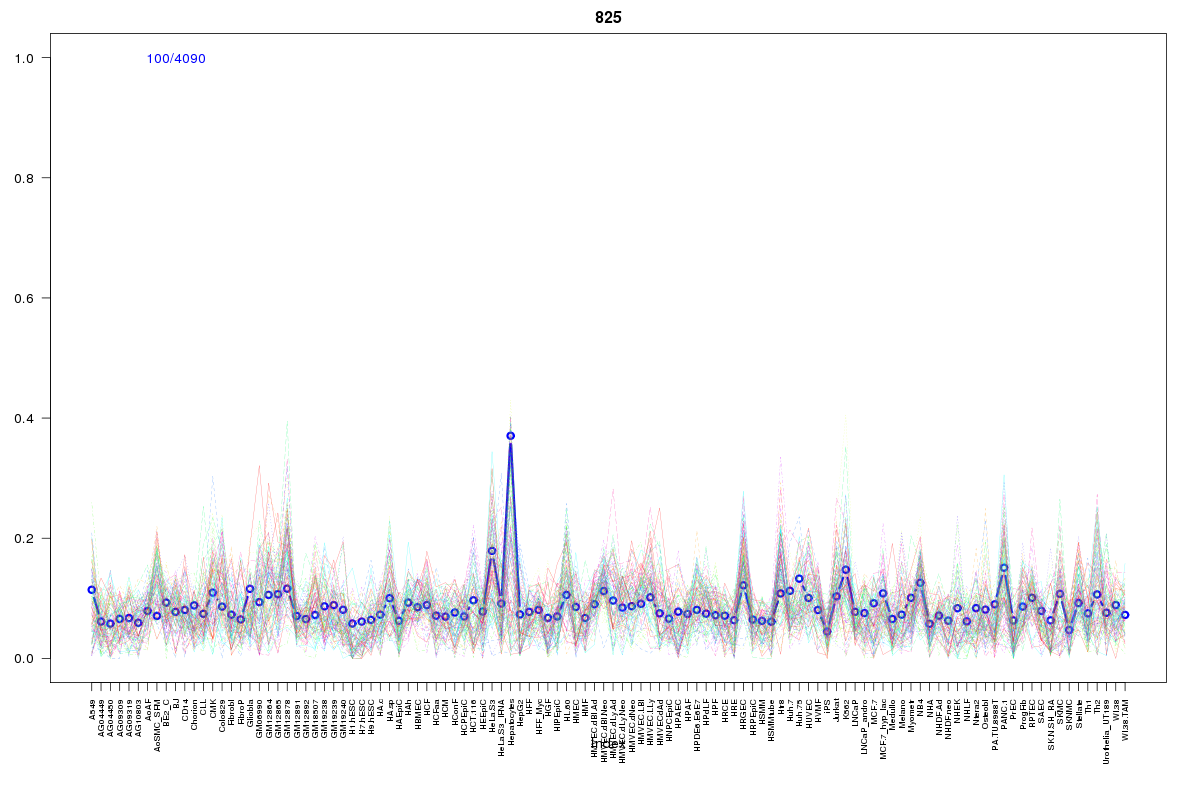 | 825 | 1 |
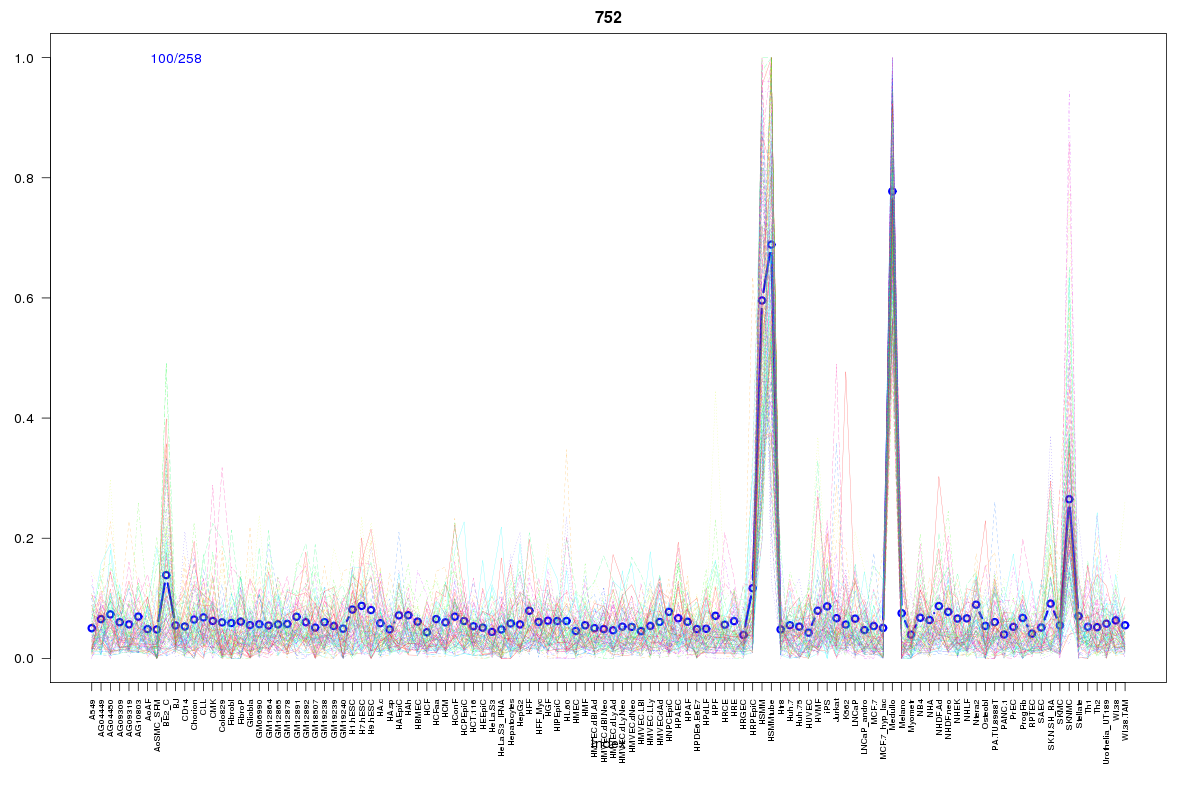 | 752 | 1 |
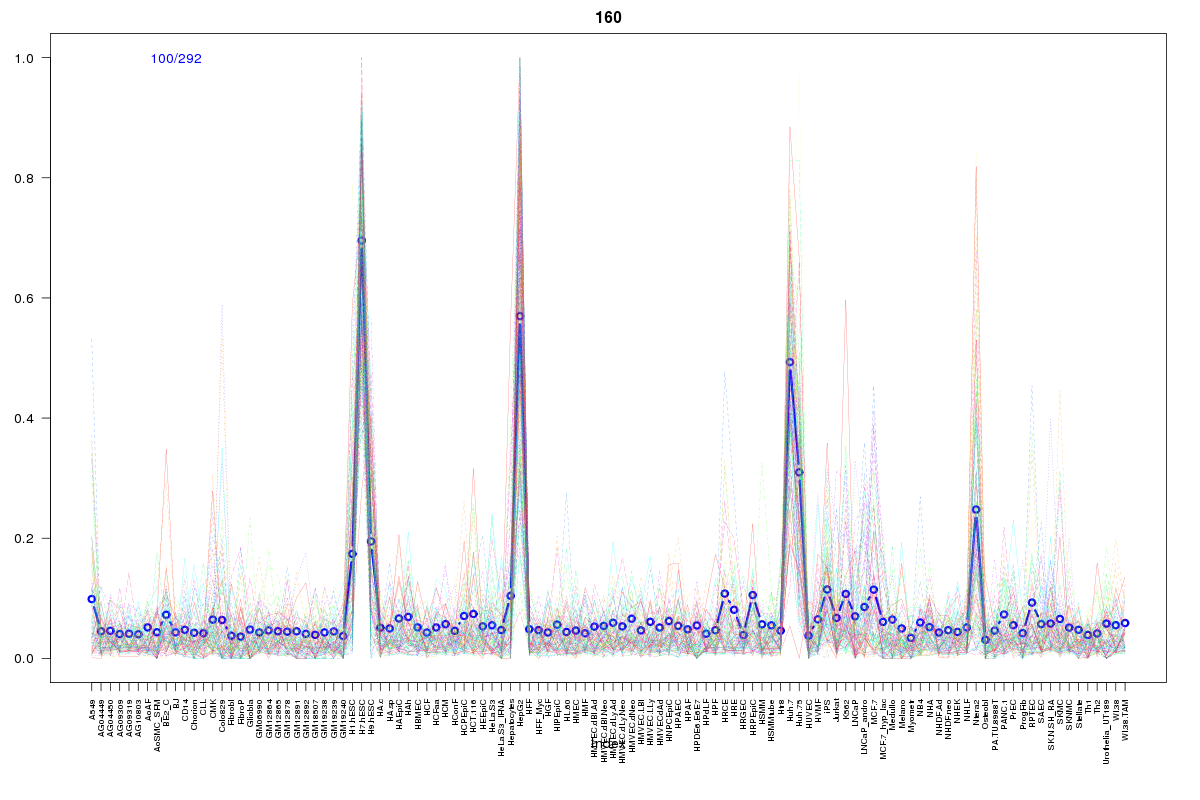 | 160 | 1 |
Resources
BED file downloads
Connects to 20 DHS sitesTop 10 Correlated DHS Sites
p-values indiciate significant higher or lower correlation| Location | Cluster | P-value |
|---|---|---|
| chr1:229500060-229500210 | 1569 | 0.002 |
| chr1:229550300-229550450 | 1721 | 0.004 |
| chr1:229500225-229500375 | 1569 | 0.004 |
| chr1:229544205-229544355 | 1520 | 0.005 |
| chr1:229570505-229570655 | 1471 | 0.008 |
| chr1:229623000-229623150 | 1721 | 0.008 |
| chr1:229506540-229506690 | 752 | 0.008 |
| chr1:229577860-229578010 | 1721 | 0.01 |
| chr1:229566620-229566770 | 2466 | 0.01 |
| chr1:229506705-229506855 | 1569 | 0.015 |
| chr1:229571005-229571155 | 1569 | 0.015 |
External Databases
UCSCEnsembl (ENSG00000143632)