Gene: GABPB2
chr1: 151043053-151070391Expression Profile
(log scale)
Graphical Connections
Distribution of linked clusters:
You may find it interesting if many of the connected DHS sites belong to the same cluster.| Cluster Profile | Cluster ID | Number of DHS sites in this cluster |
|---|---|---|
 | 1355 | 4 |
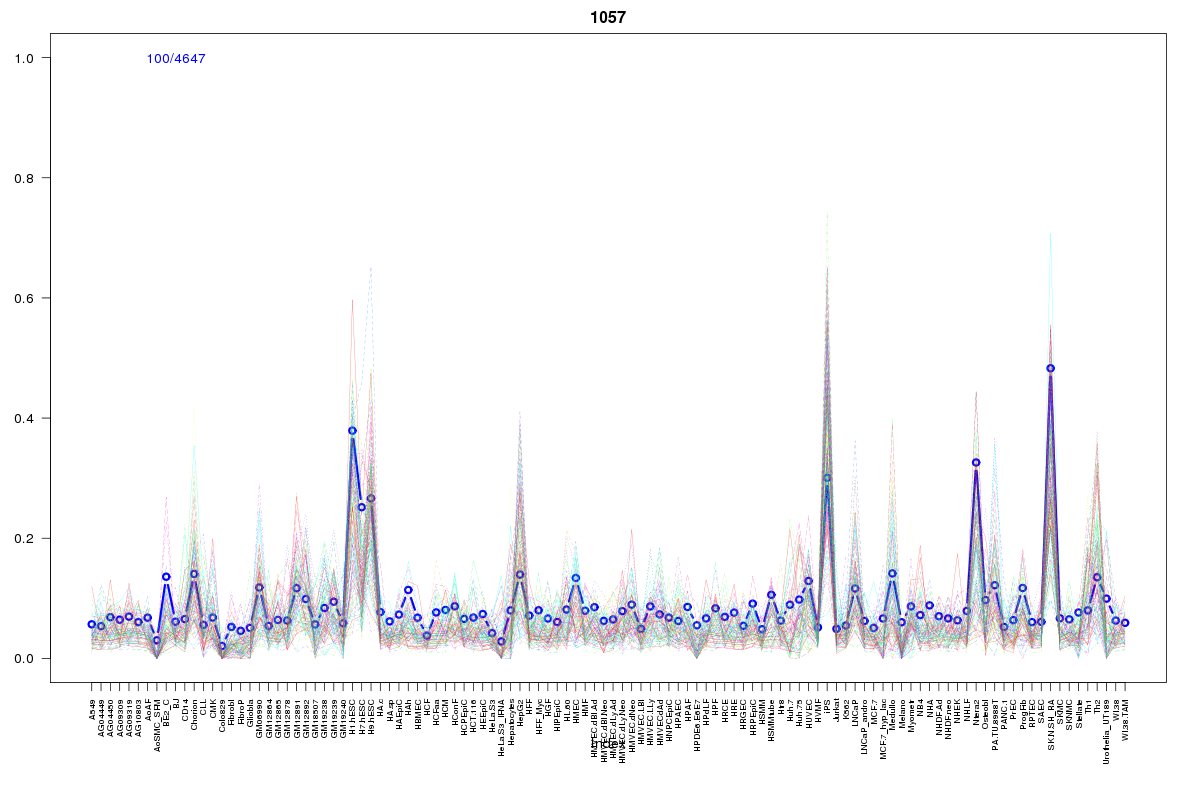 | 1057 | 1 |
 | 110 | 1 |
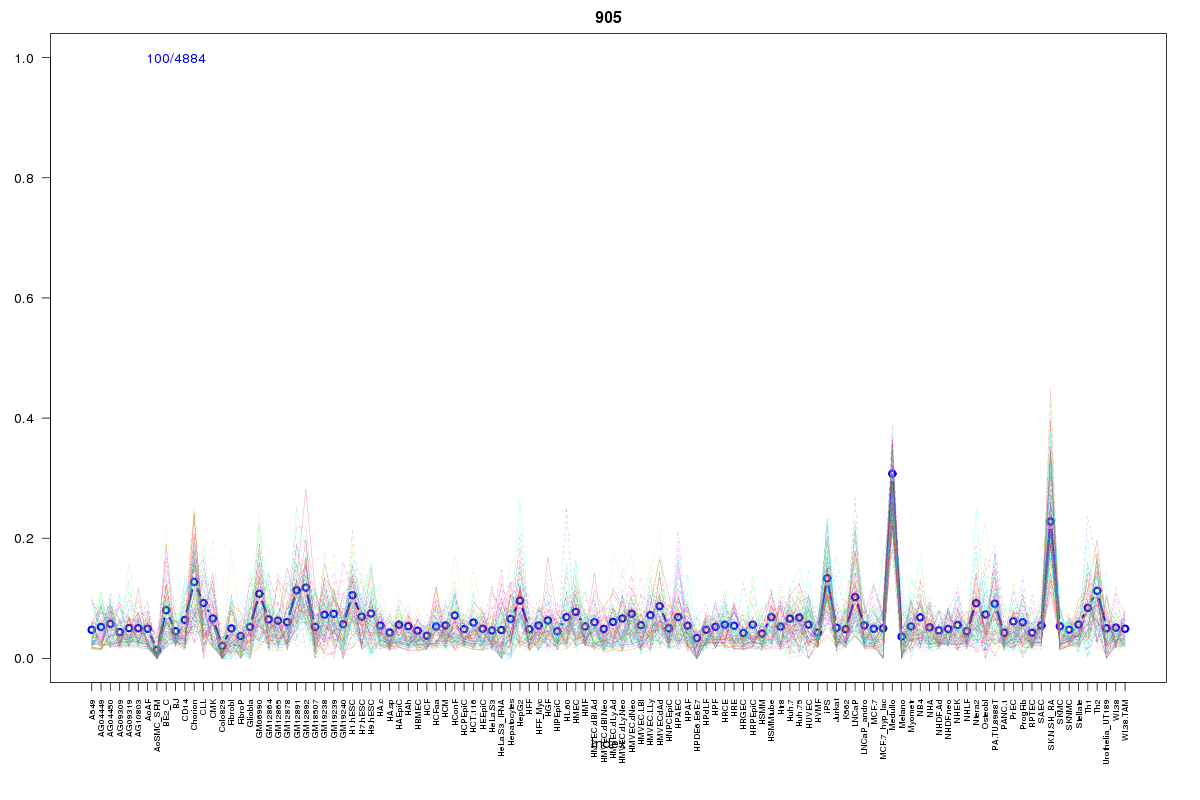 | 905 | 1 |
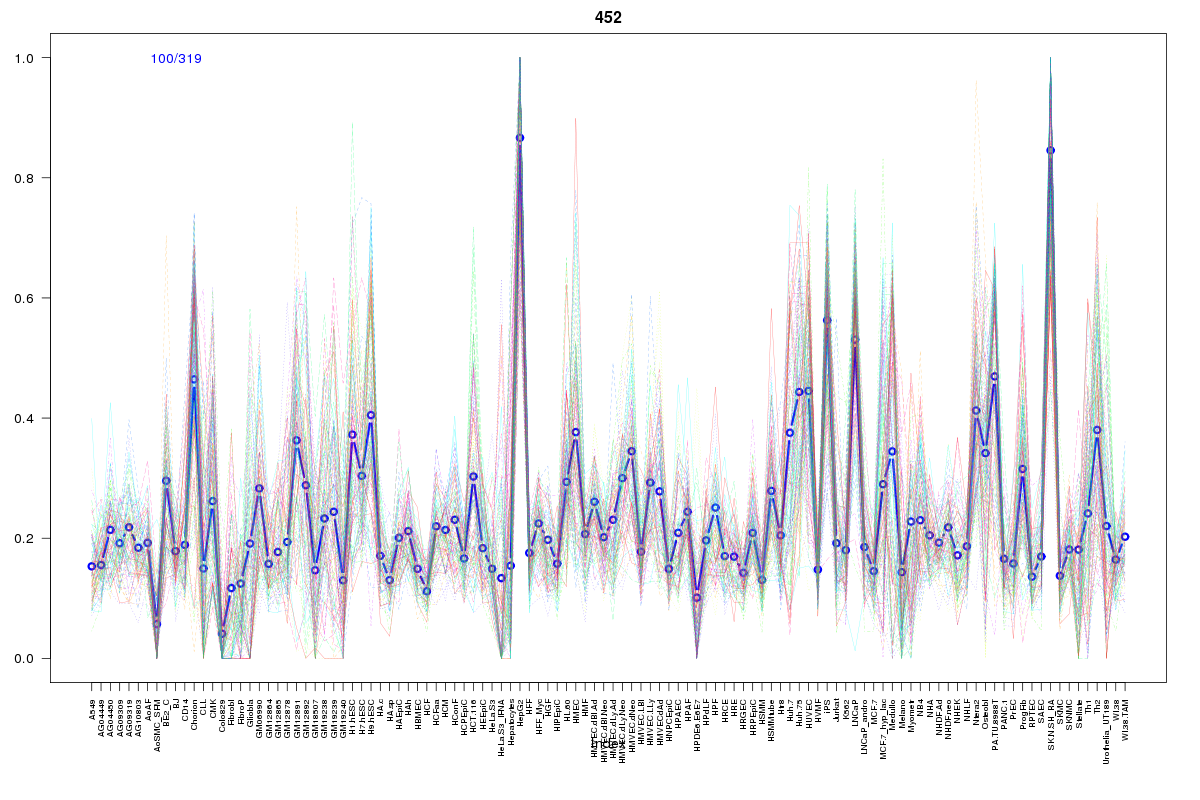 | 452 | 1 |
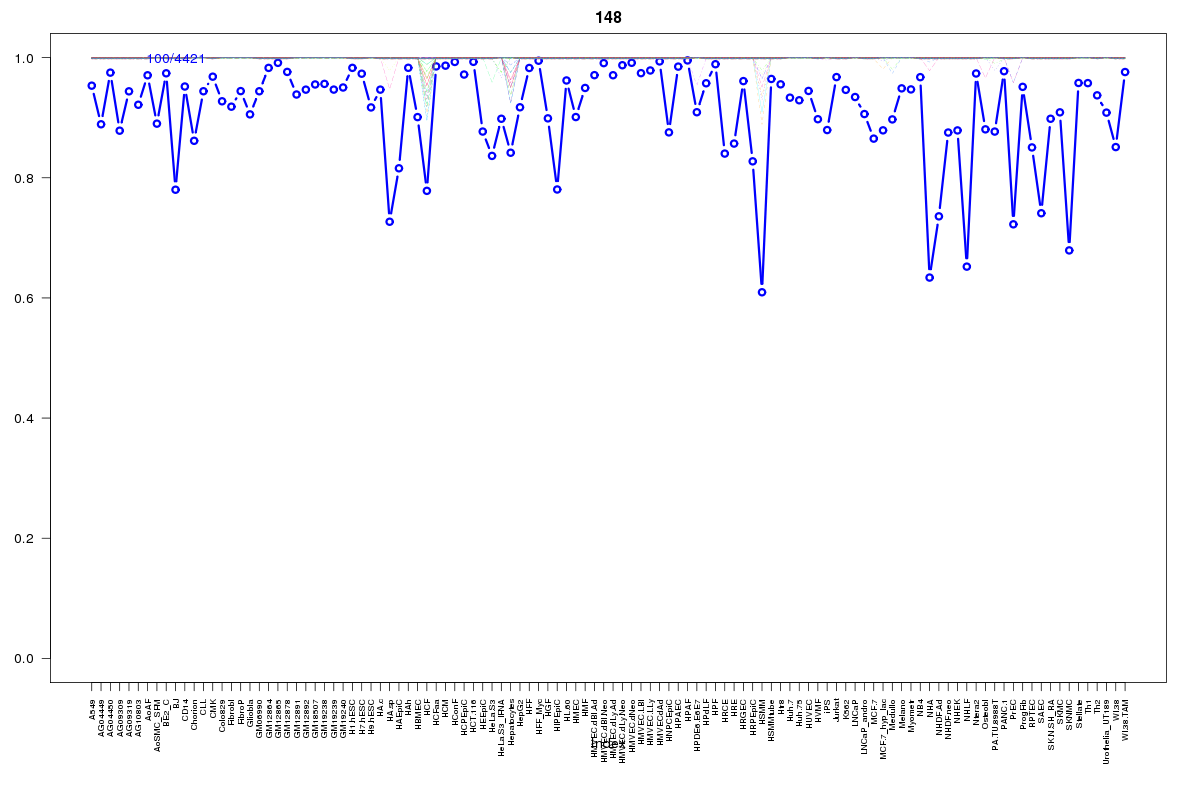 | 148 | 1 |
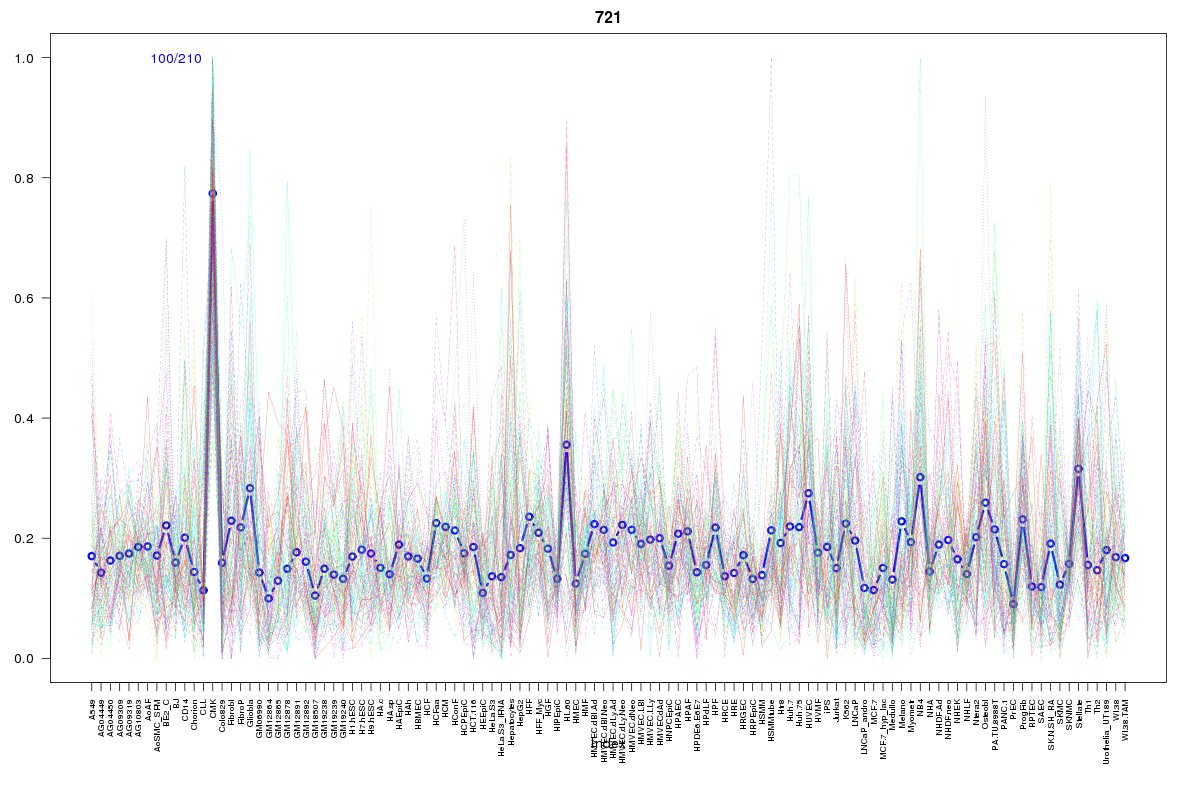 | 721 | 1 |
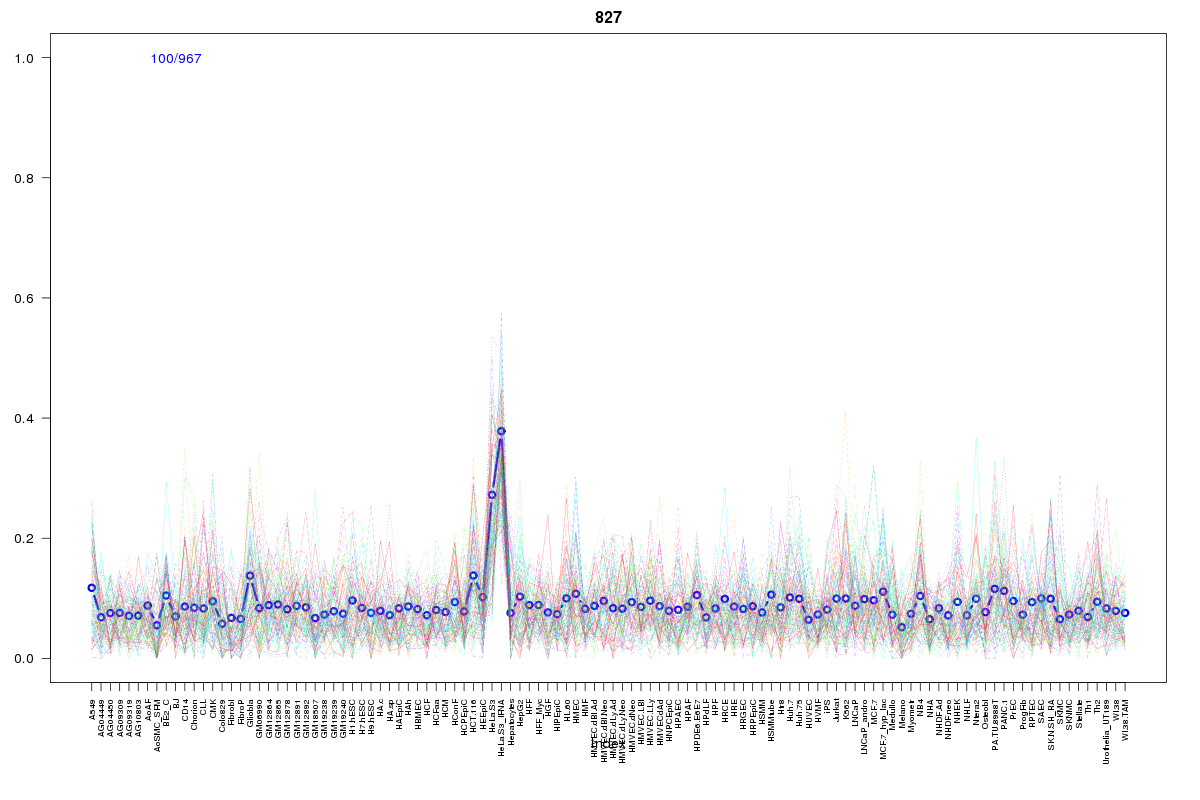 | 827 | 1 |
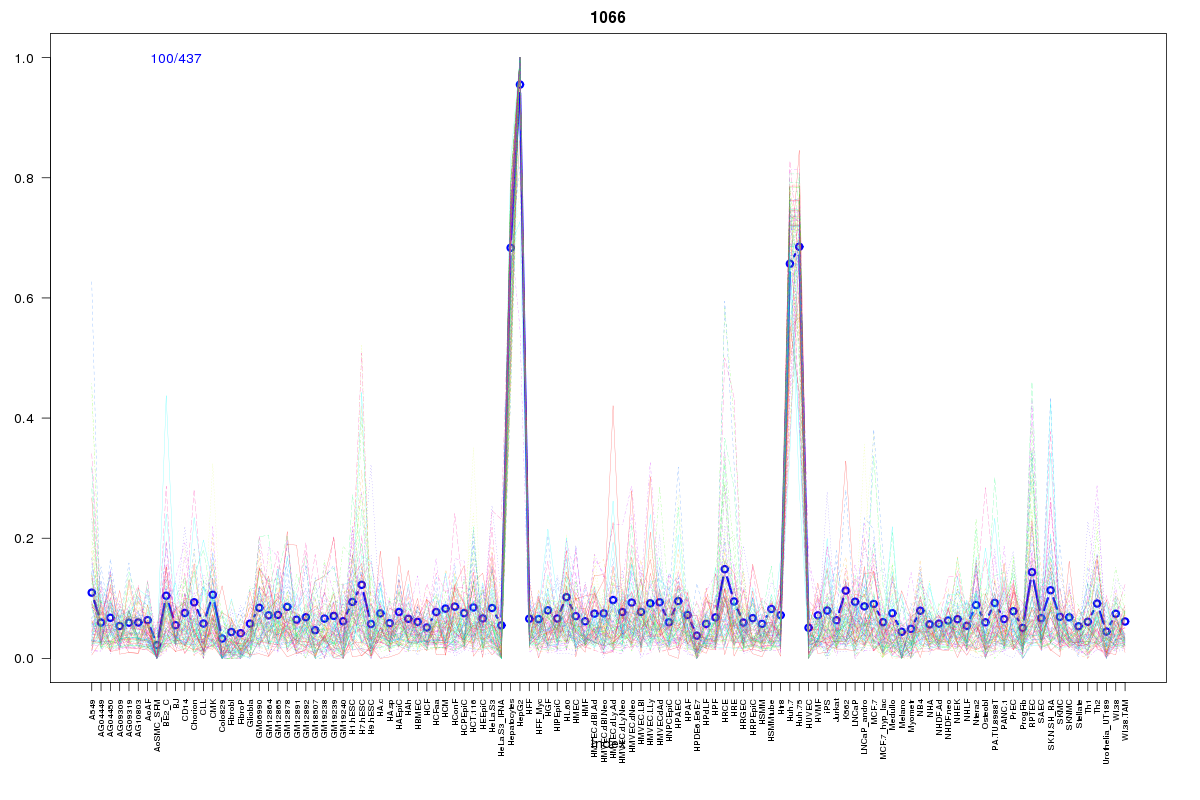 | 1066 | 1 |
 | 2175 | 1 |
 | 149 | 1 |
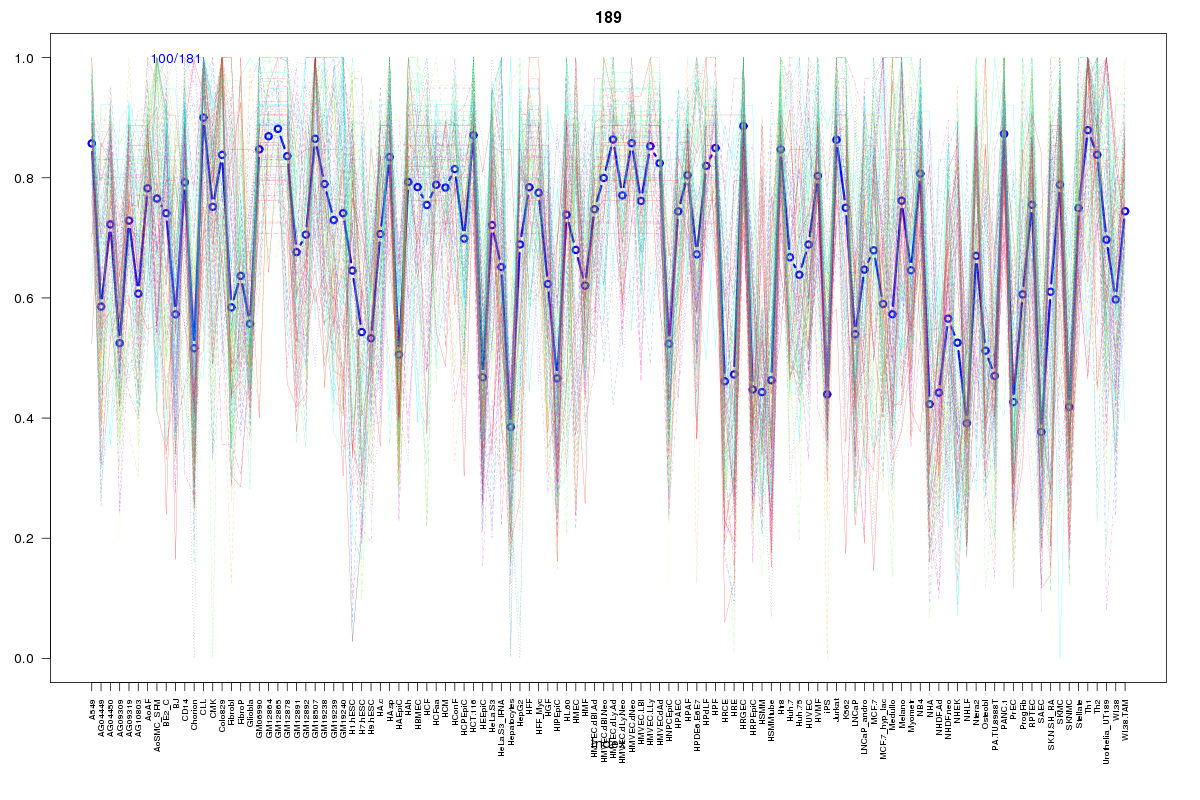 | 189 | 1 |
Resources
BED file downloads
Connects to 15 DHS sitesTop 10 Correlated DHS Sites
p-values indiciate significant higher or lower correlation| Location | Cluster | P-value |
|---|---|---|
| chr1:151042920-151043070 | 149 | 0 |
| chr1:151043160-151043310 | 189 | 0 |
| chr1:150978400-150978550 | 827 | 0.002 |
| chr1:151033720-151033870 | 2175 | 0.021 |
| chr1:151105905-151106055 | 110 | 0.019 |
| chr1:151105625-151105775 | 1057 | 0.012 |
| chr1:151118885-151119035 | 452 | 0.009 |
| chr1:151119140-151119290 | 148 | 0.008 |
| chr1:150985640-150985790 | 1066 | 0.006 |
| chr1:151125640-151125790 | 1355 | 0.005 |
| chr1:151080005-151080155 | 1355 | 0.004 |
External Databases
UCSCEnsembl (ENSG00000143458)