Gene: MCL1
chr1: 150547031-150552066Expression Profile
(log scale)
Graphical Connections
Distribution of linked clusters:
You may find it interesting if many of the connected DHS sites belong to the same cluster.| Cluster Profile | Cluster ID | Number of DHS sites in this cluster |
|---|---|---|
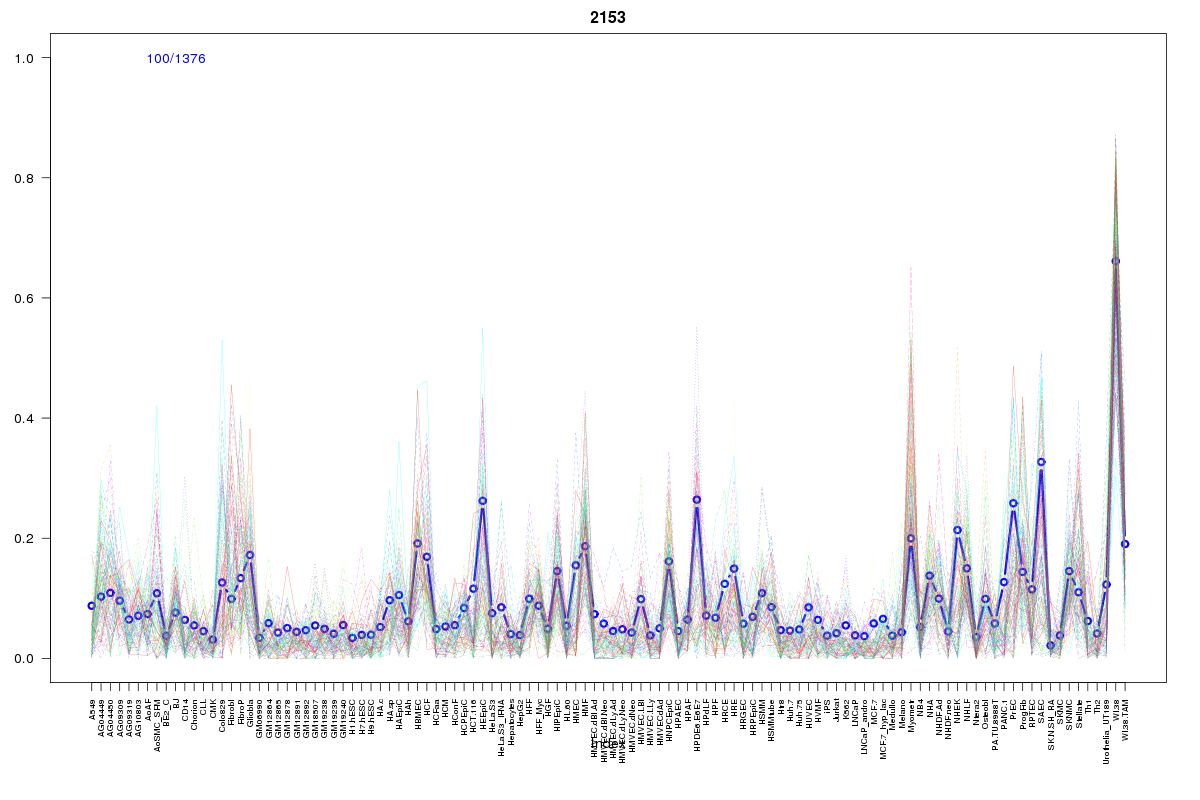 | 2153 | 3 |
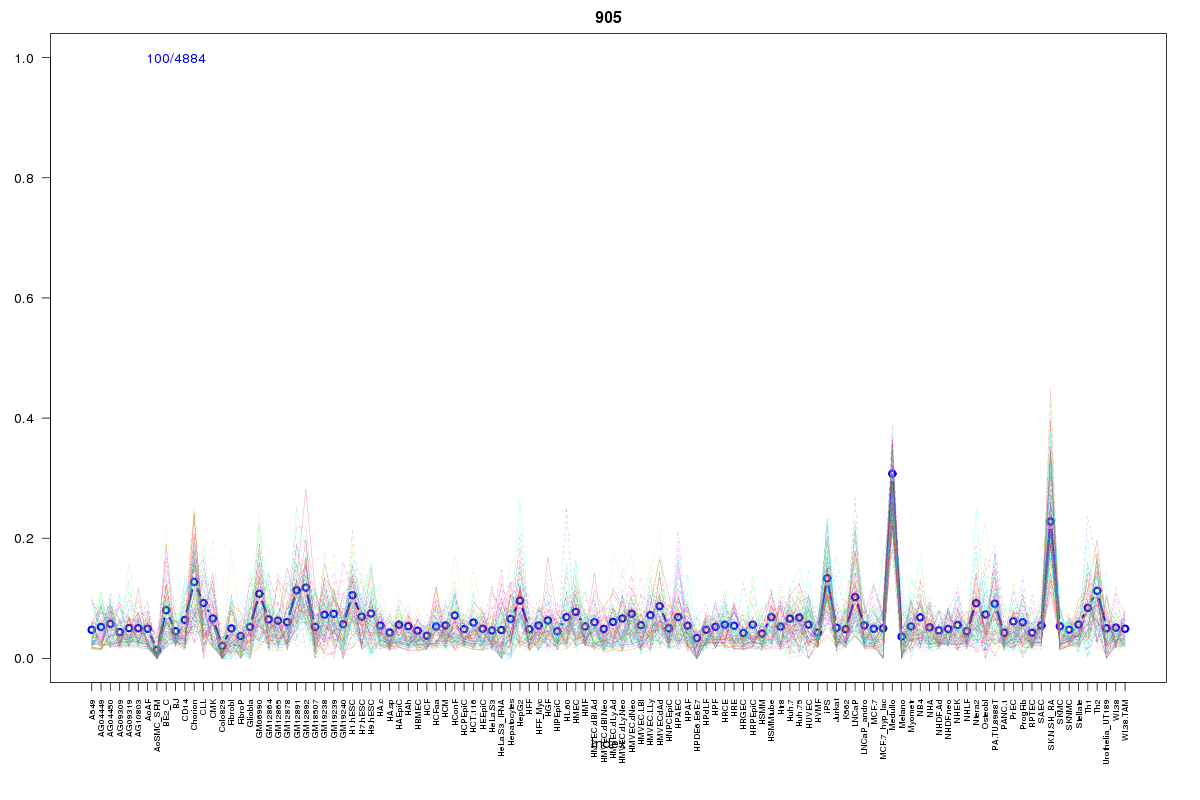 | 905 | 2 |
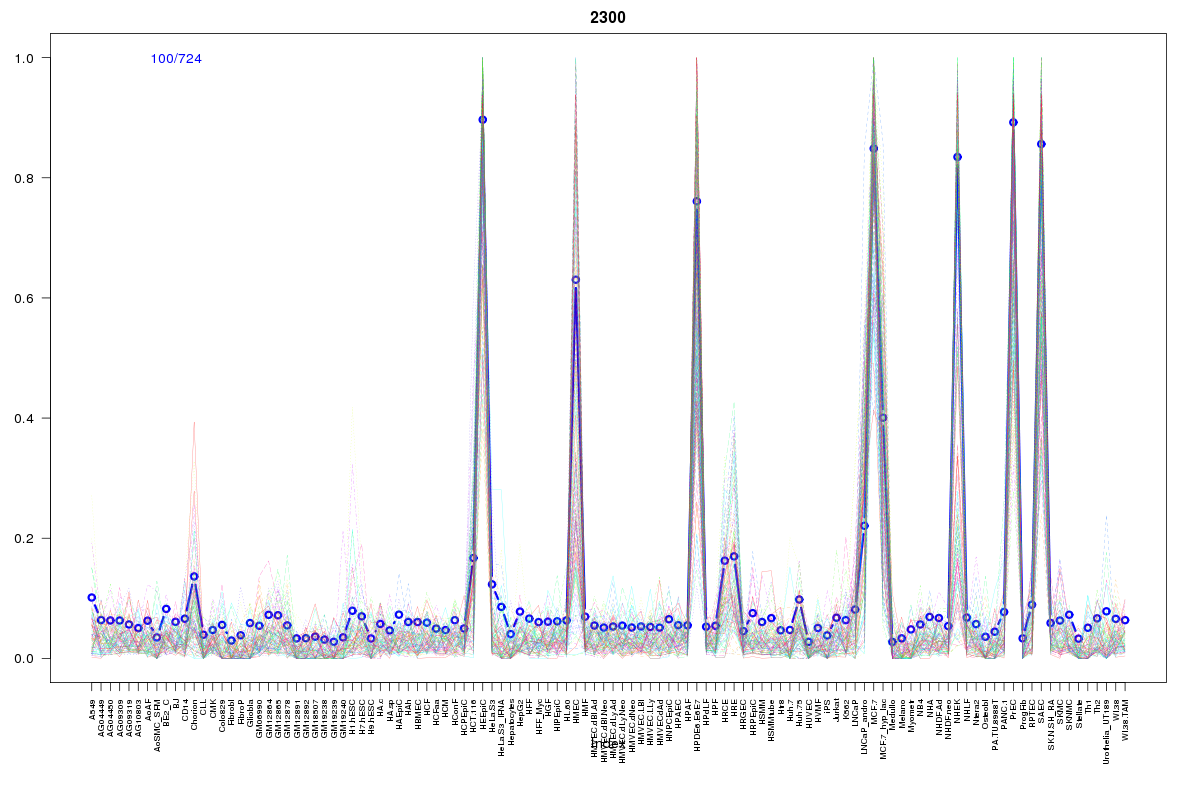 | 2300 | 2 |
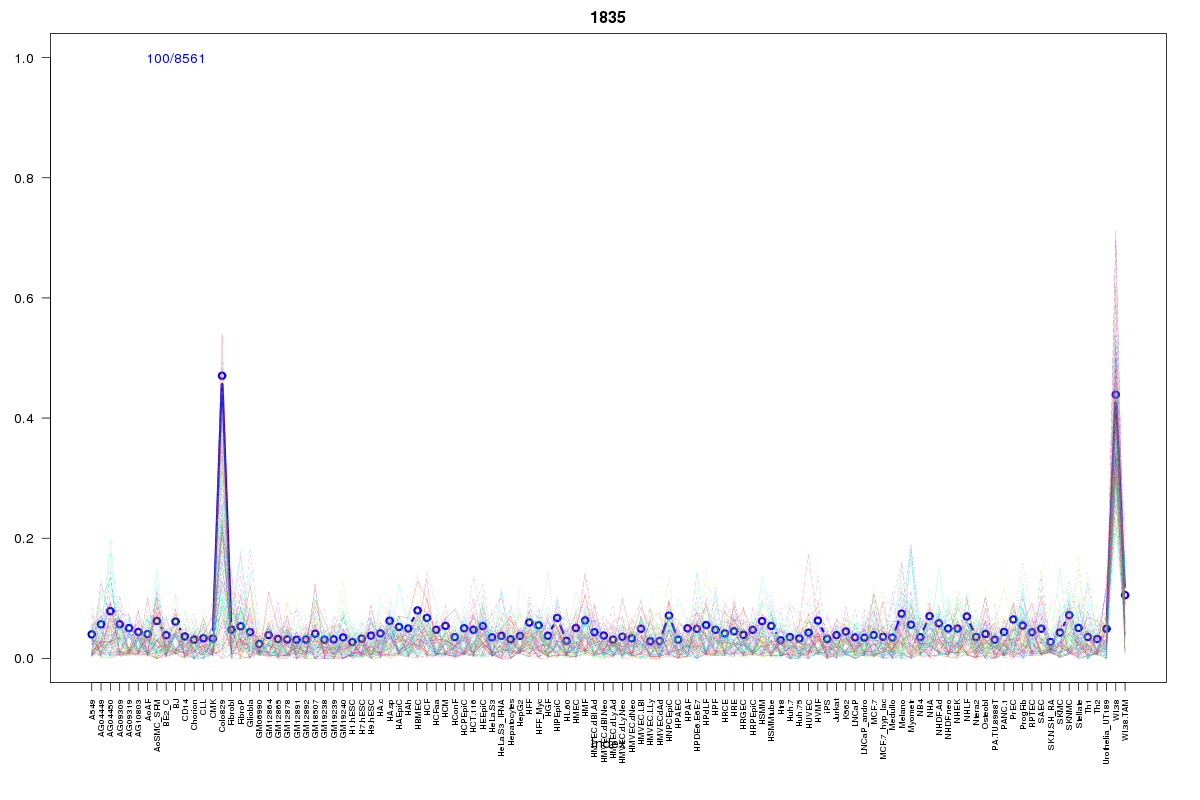 | 1835 | 2 |
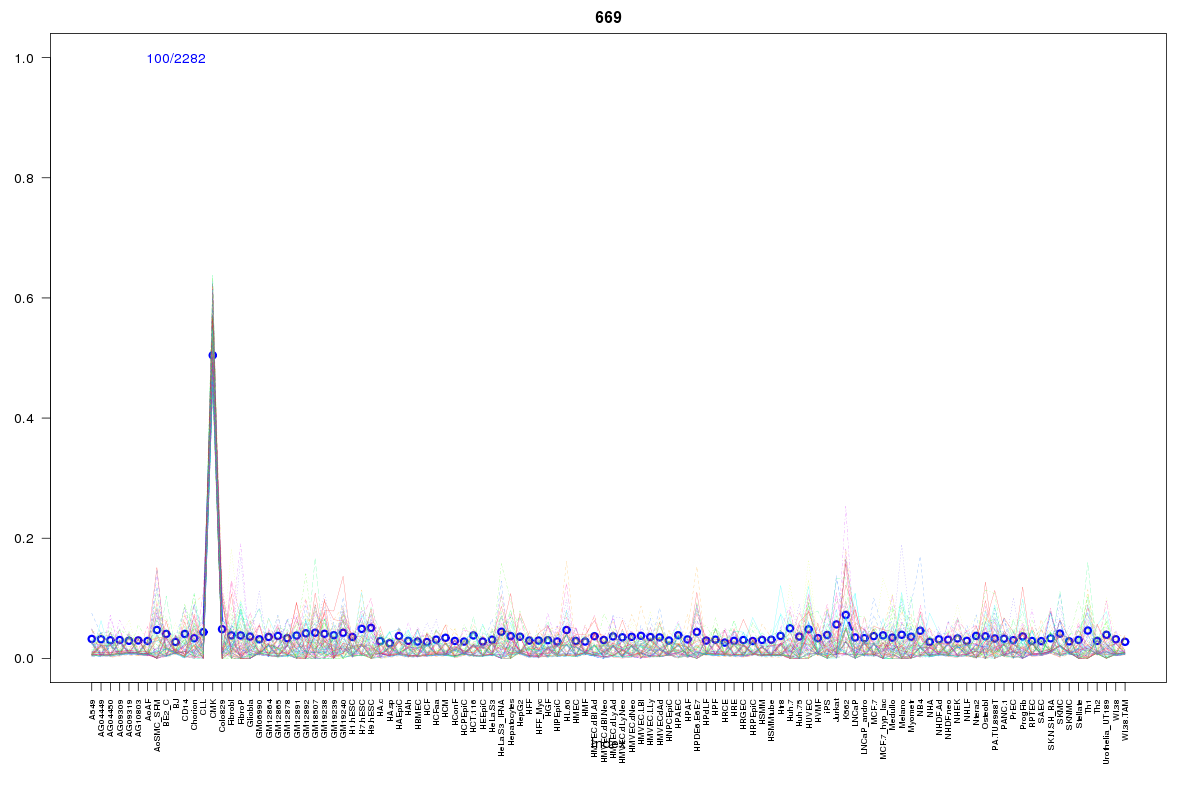 | 669 | 1 |
 | 2017 | 1 |
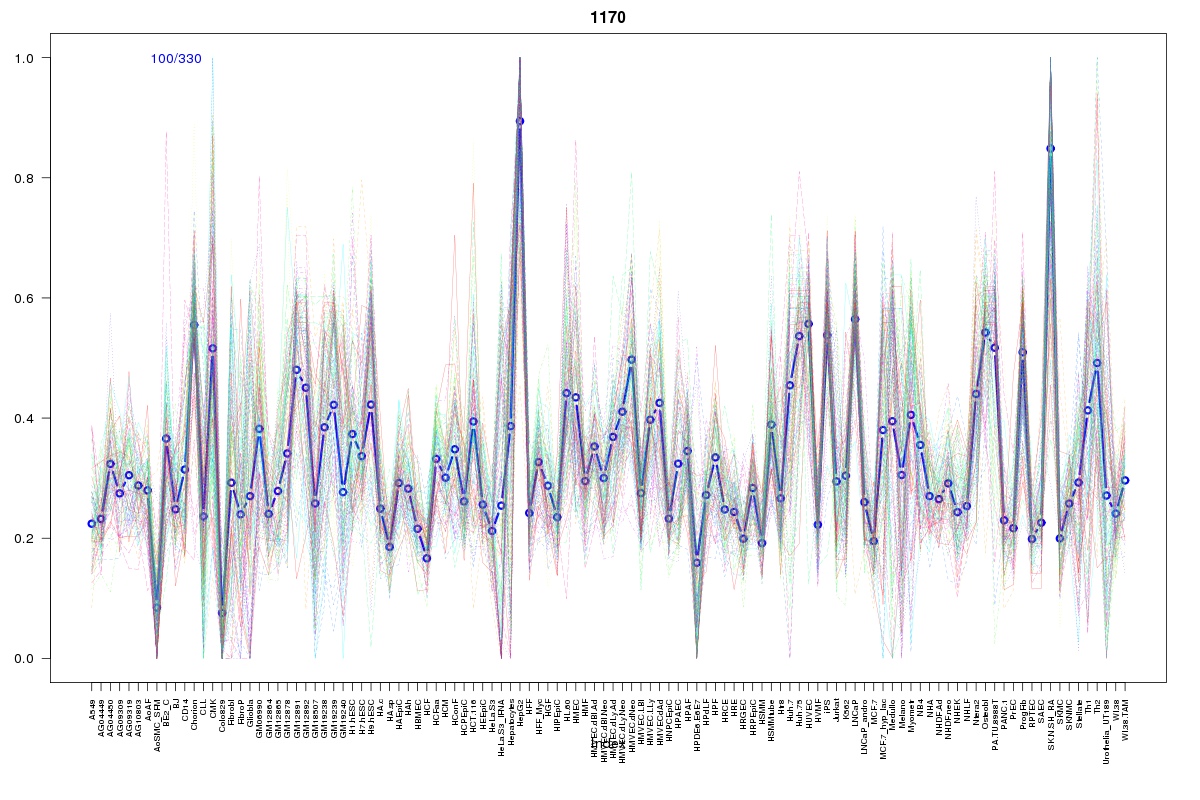 | 1170 | 1 |
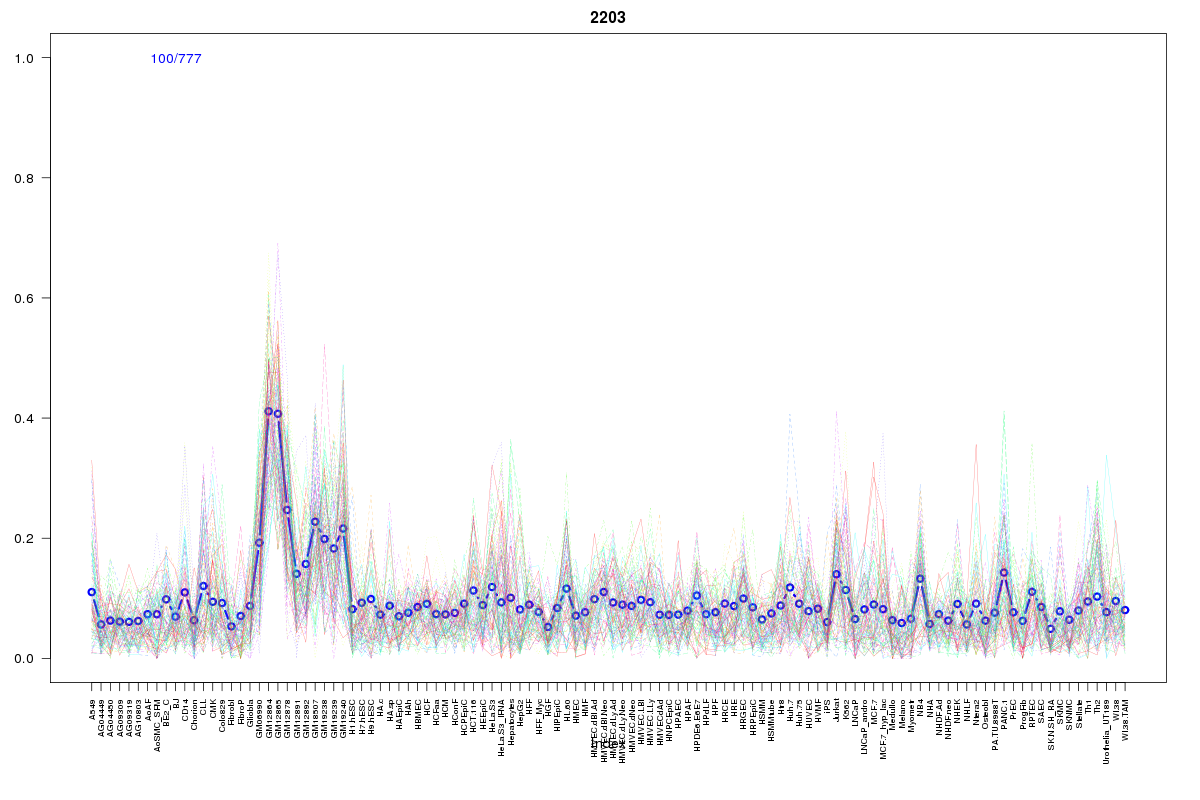 | 2203 | 1 |
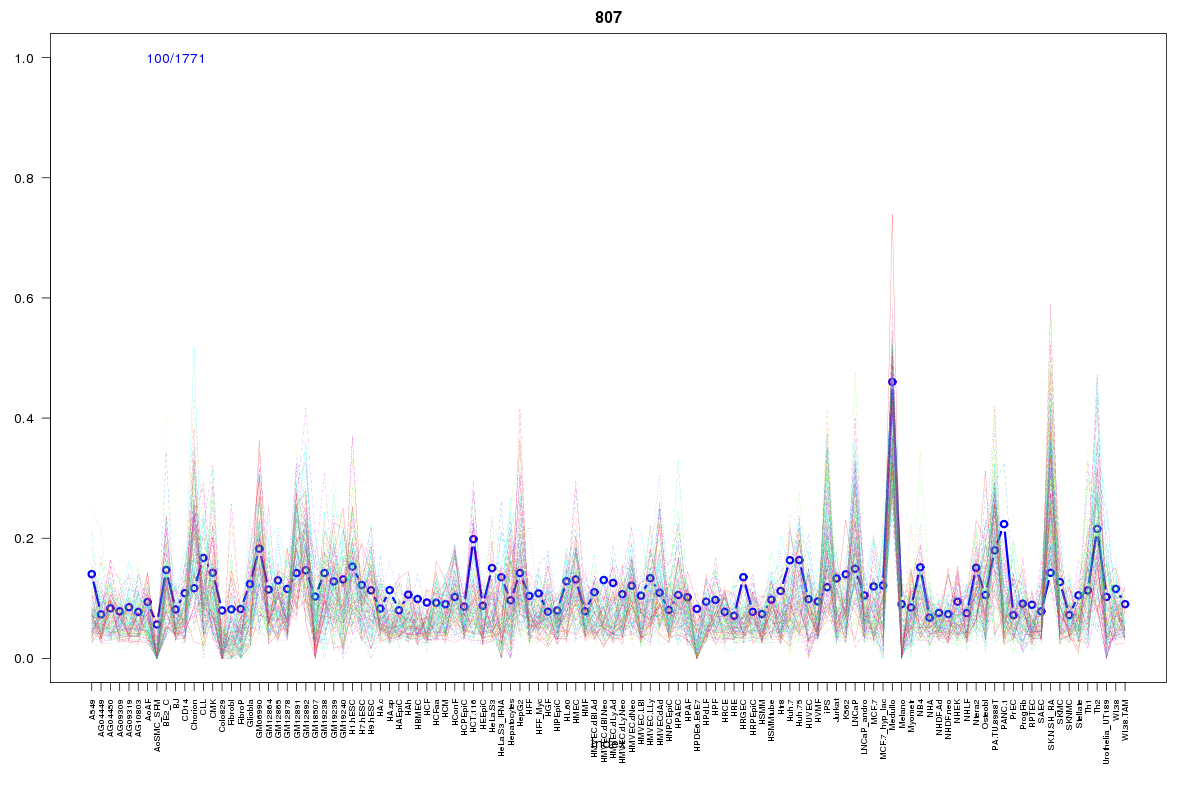 | 807 | 1 |
 | 1724 | 1 |
 | 416 | 1 |
 | 655 | 1 |
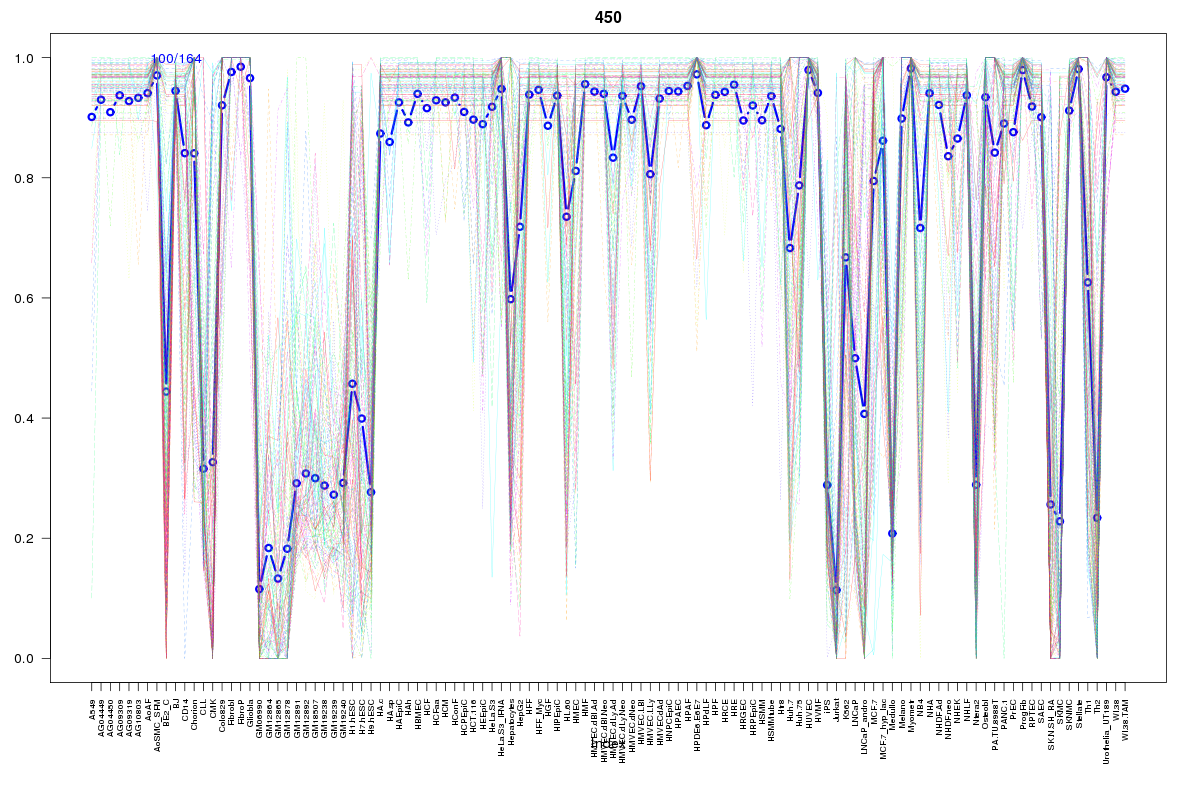 | 450 | 1 |
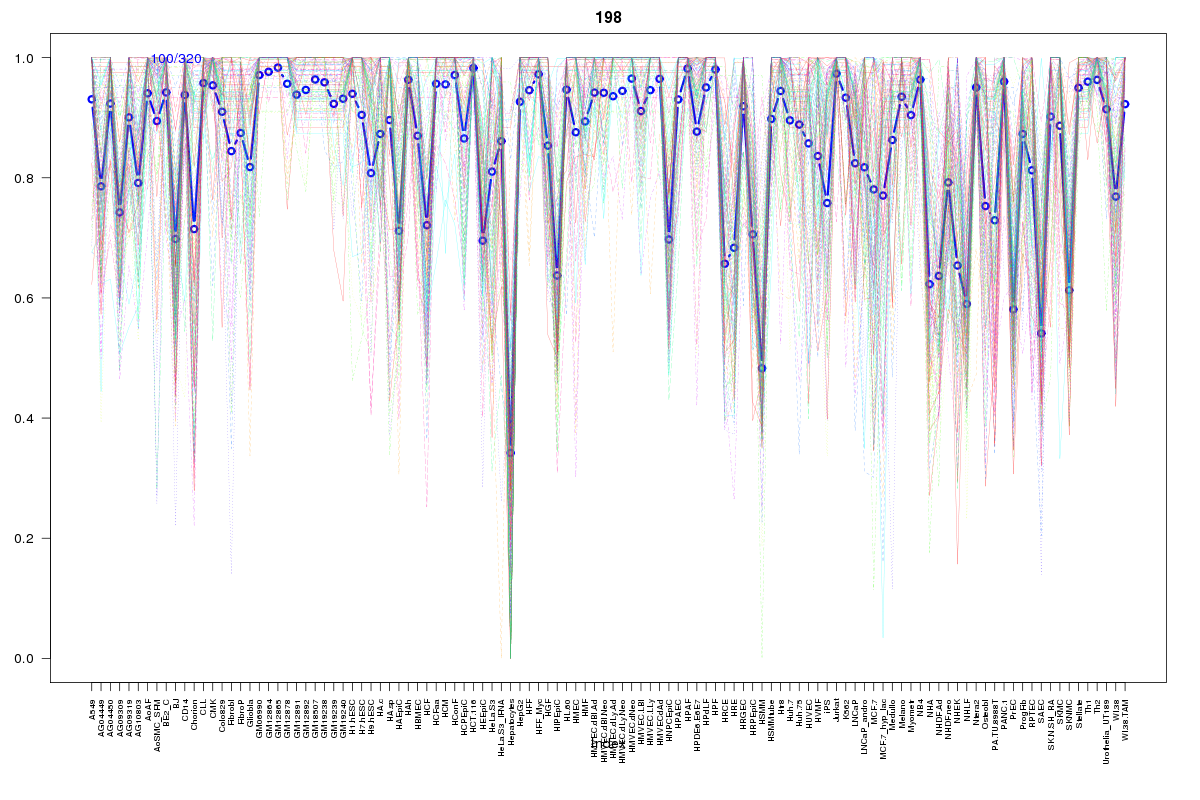 | 198 | 1 |
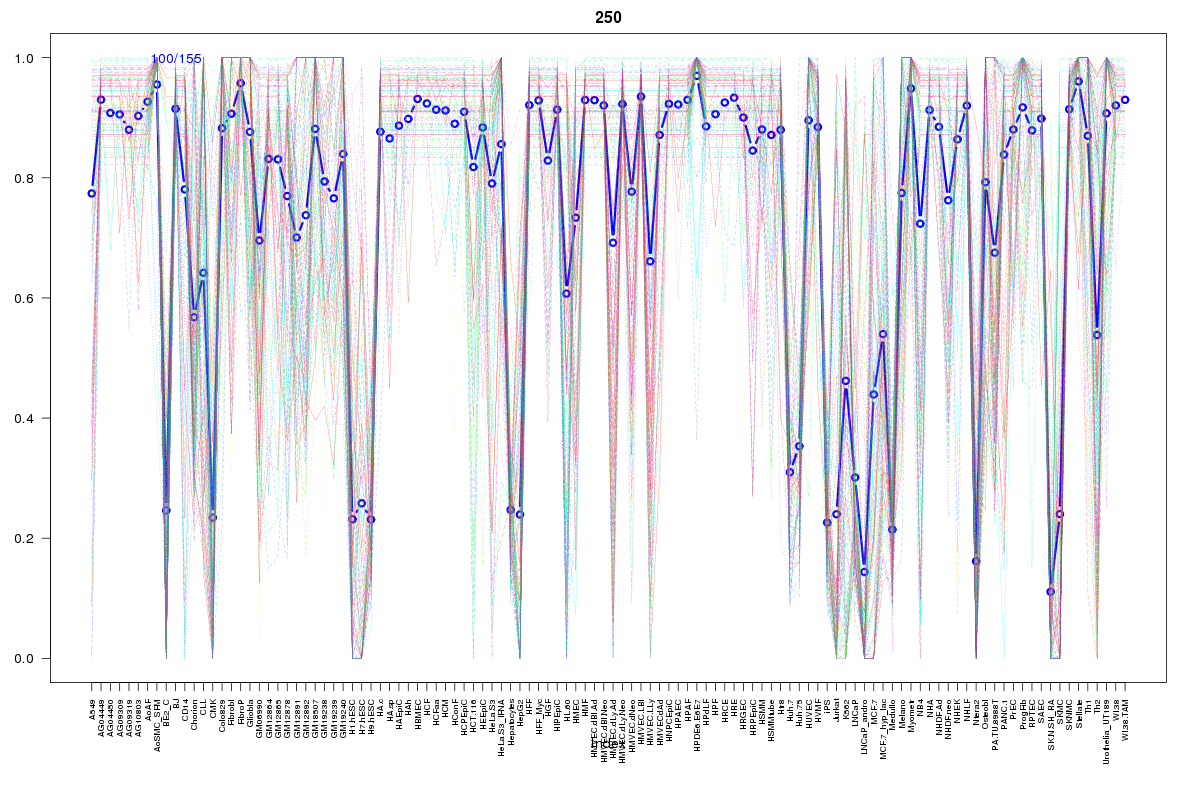 | 250 | 1 |
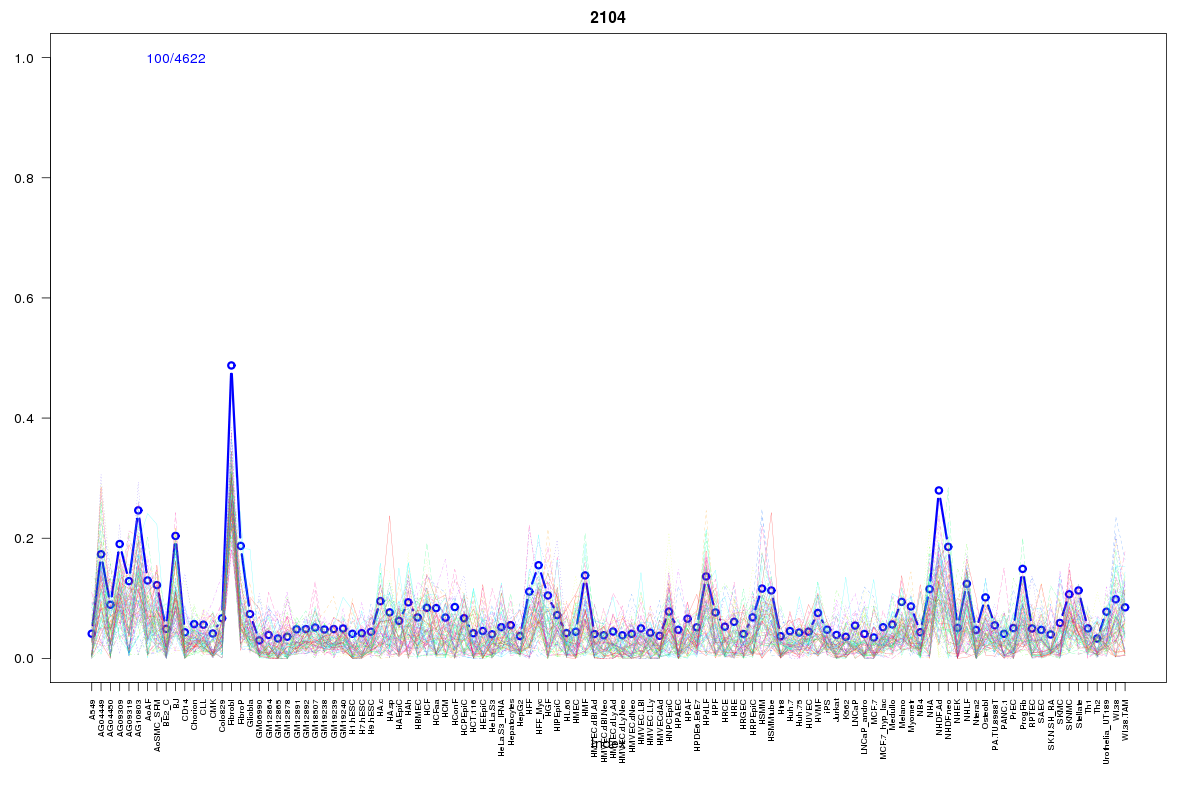 | 2104 | 1 |
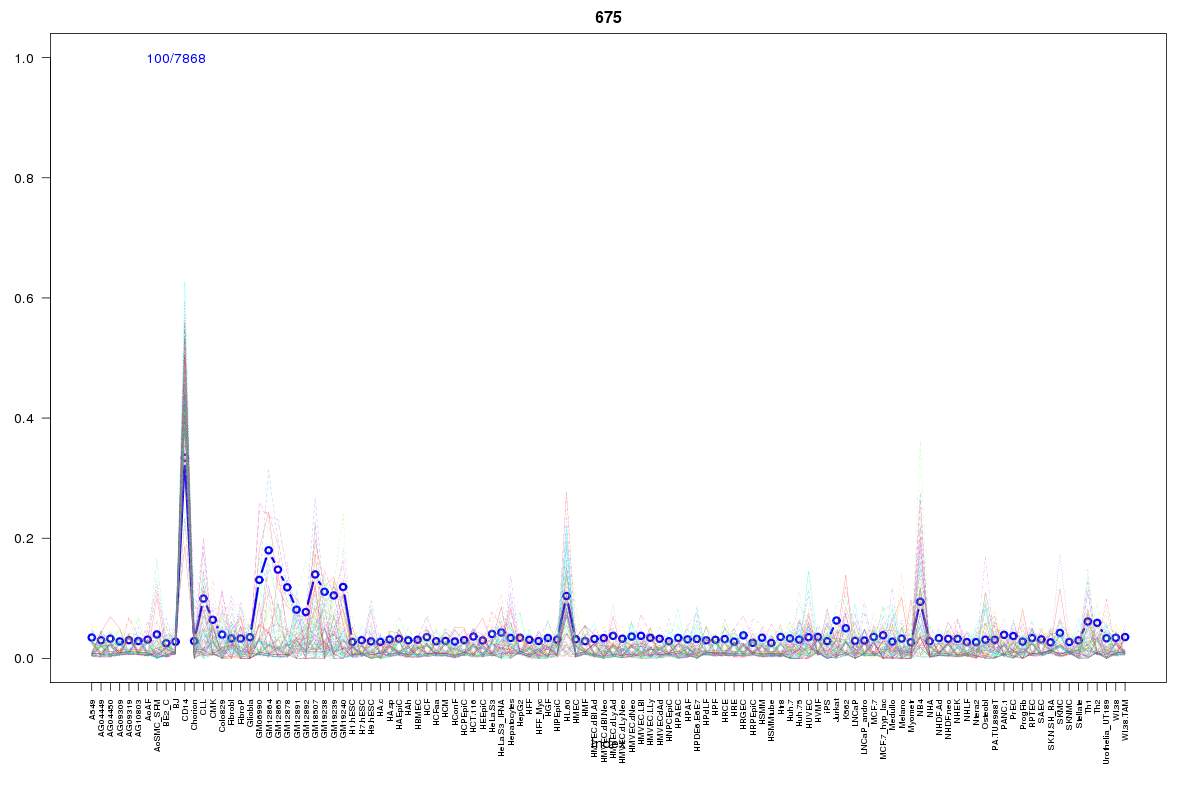 | 675 | 1 |
 | 1923 | 1 |
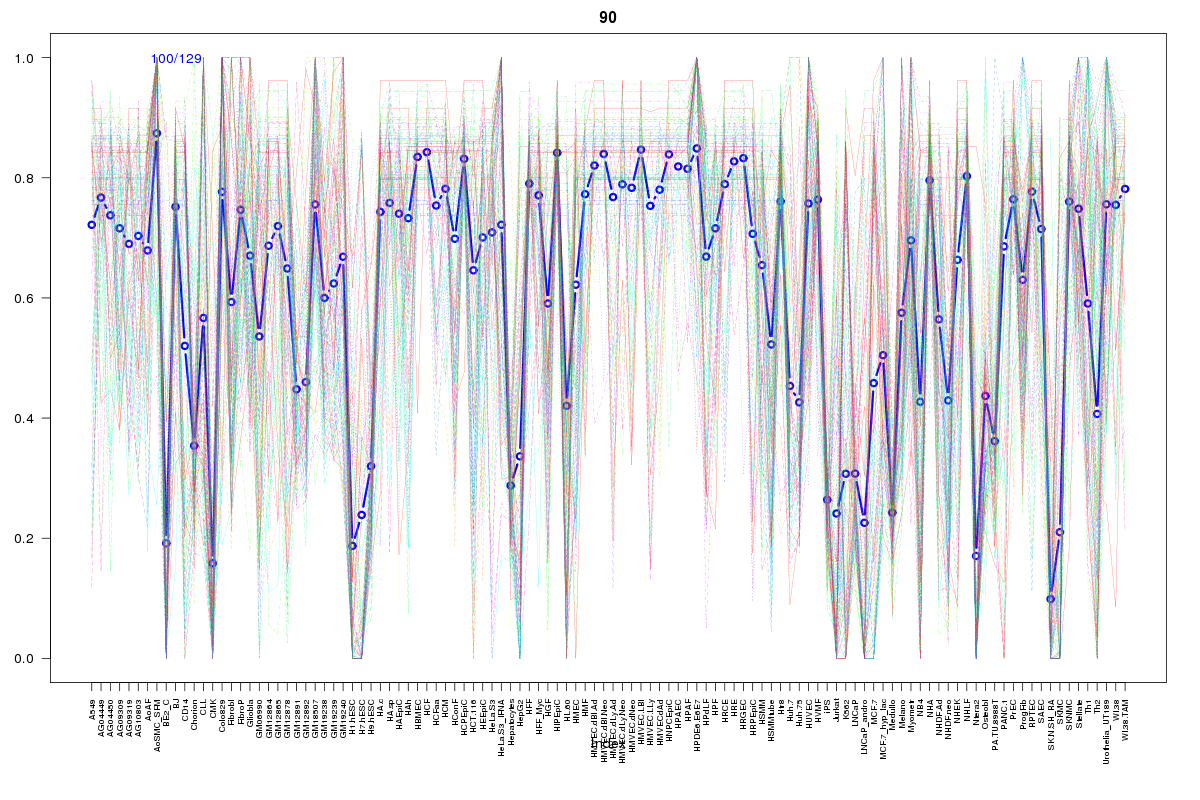 | 90 | 1 |
 | 1858 | 1 |
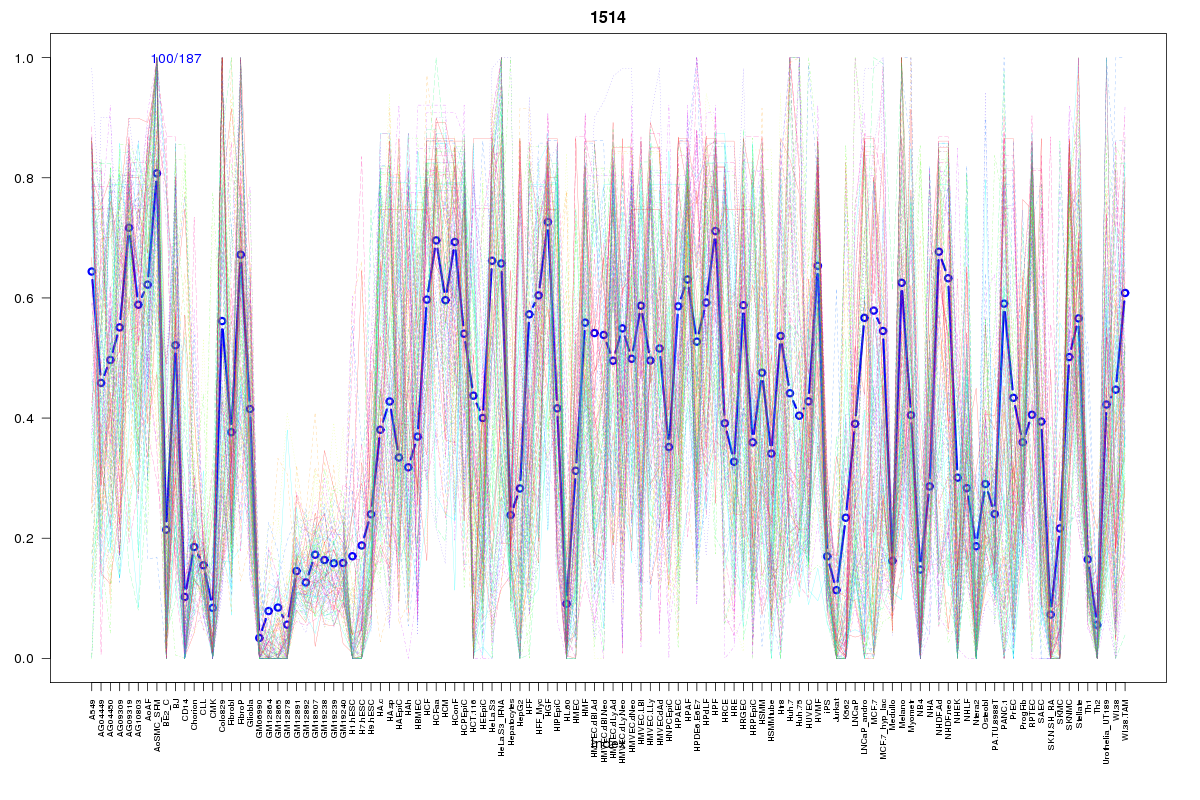 | 1514 | 1 |
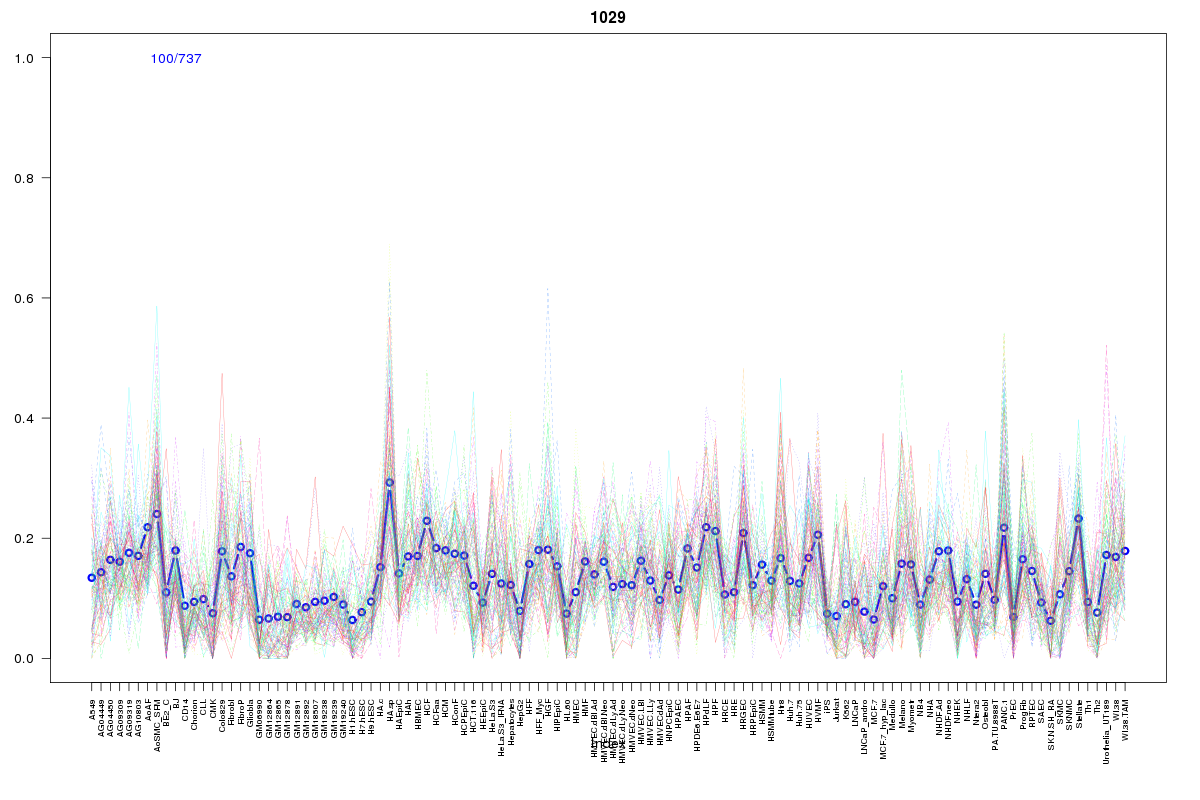 | 1029 | 1 |
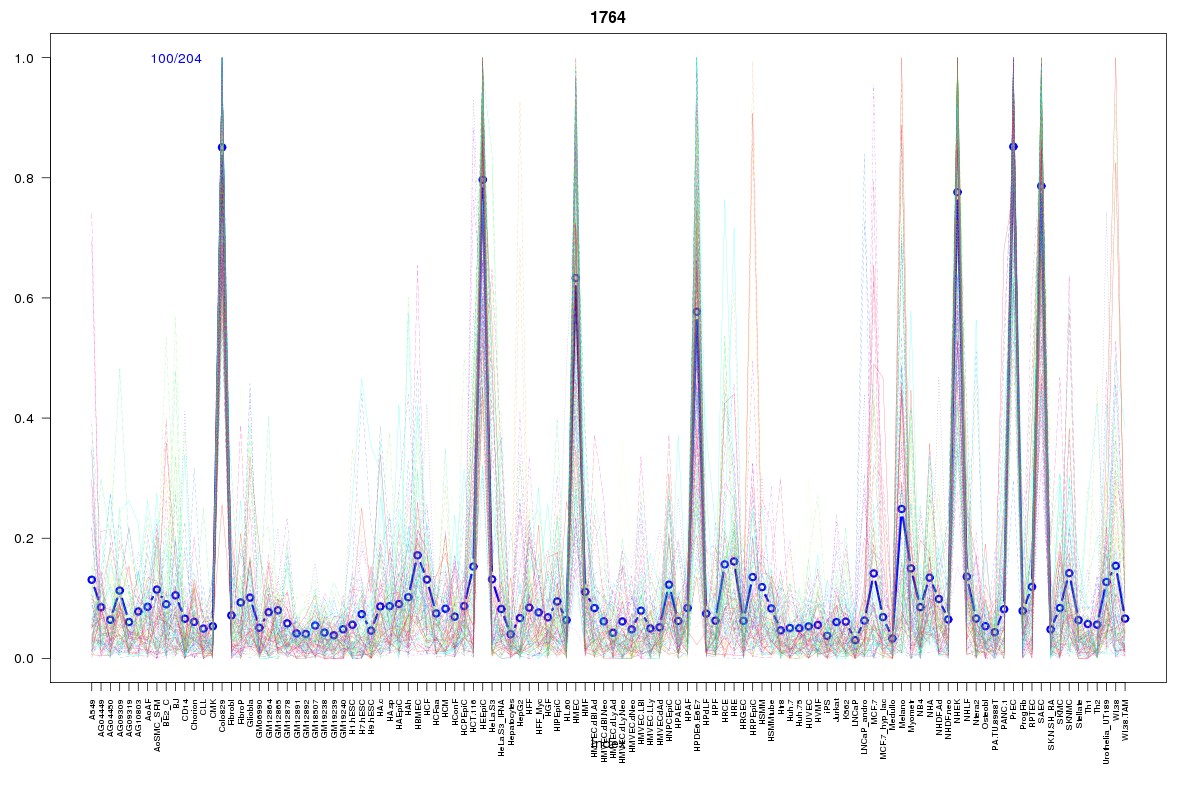 | 1764 | 1 |
 | 2100 | 1 |
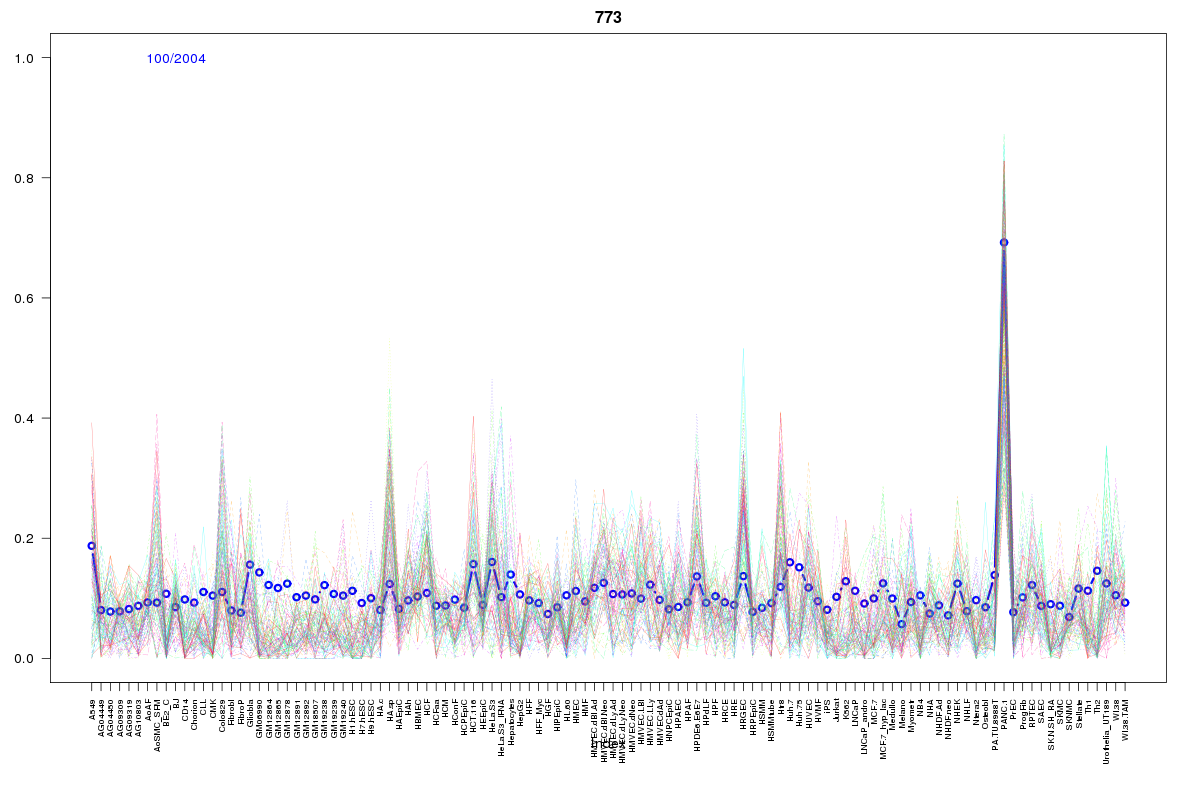 | 773 | 1 |
 | 2195 | 1 |
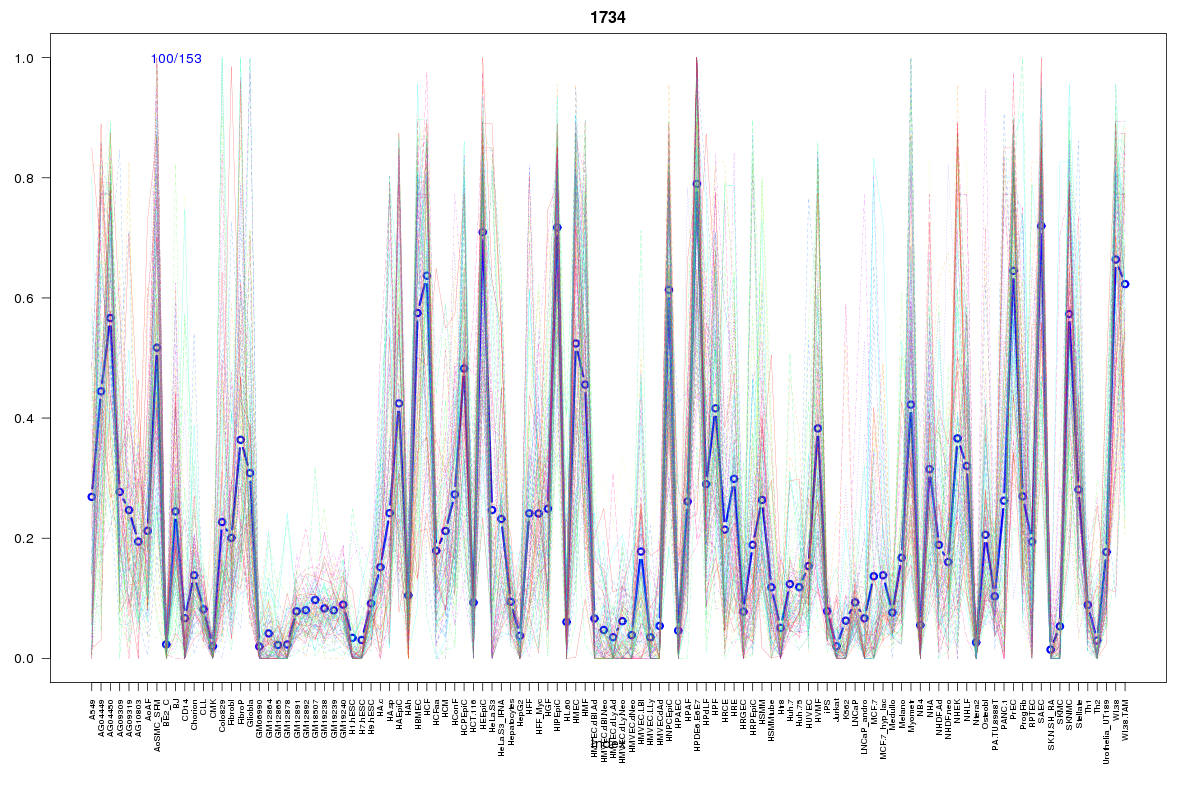 | 1734 | 1 |
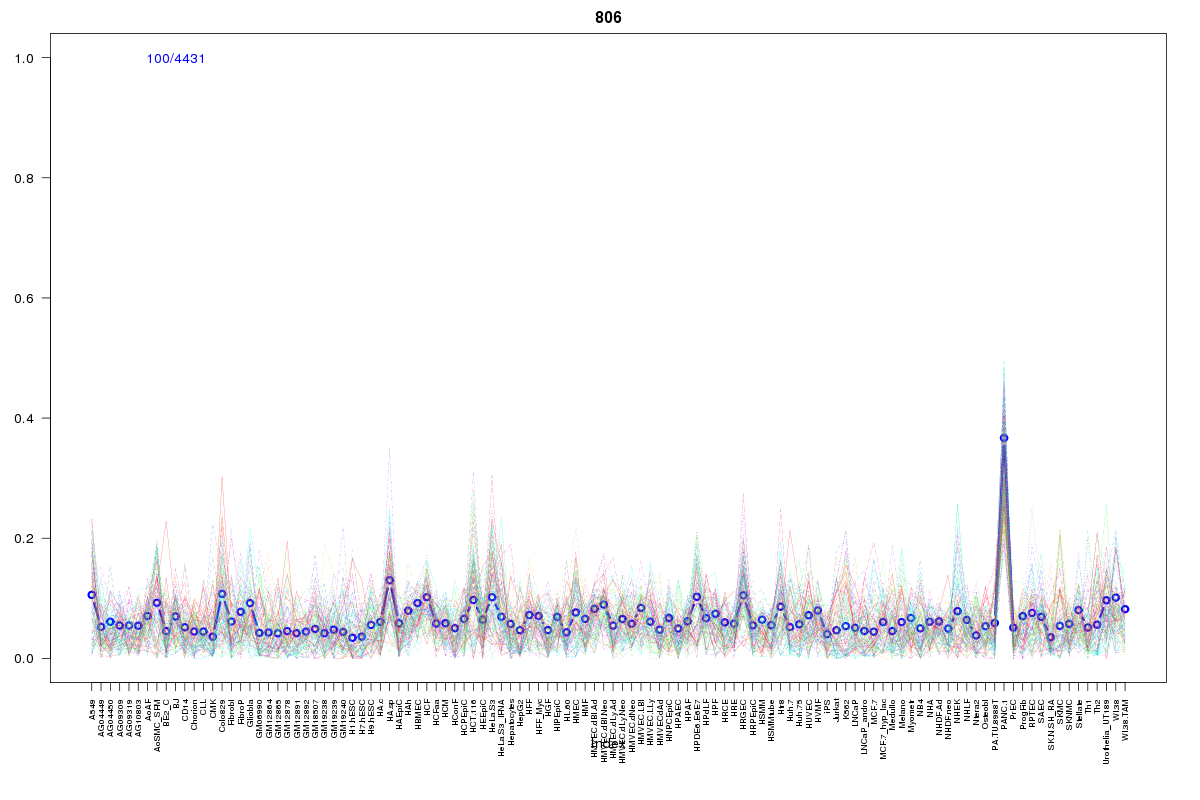 | 806 | 1 |
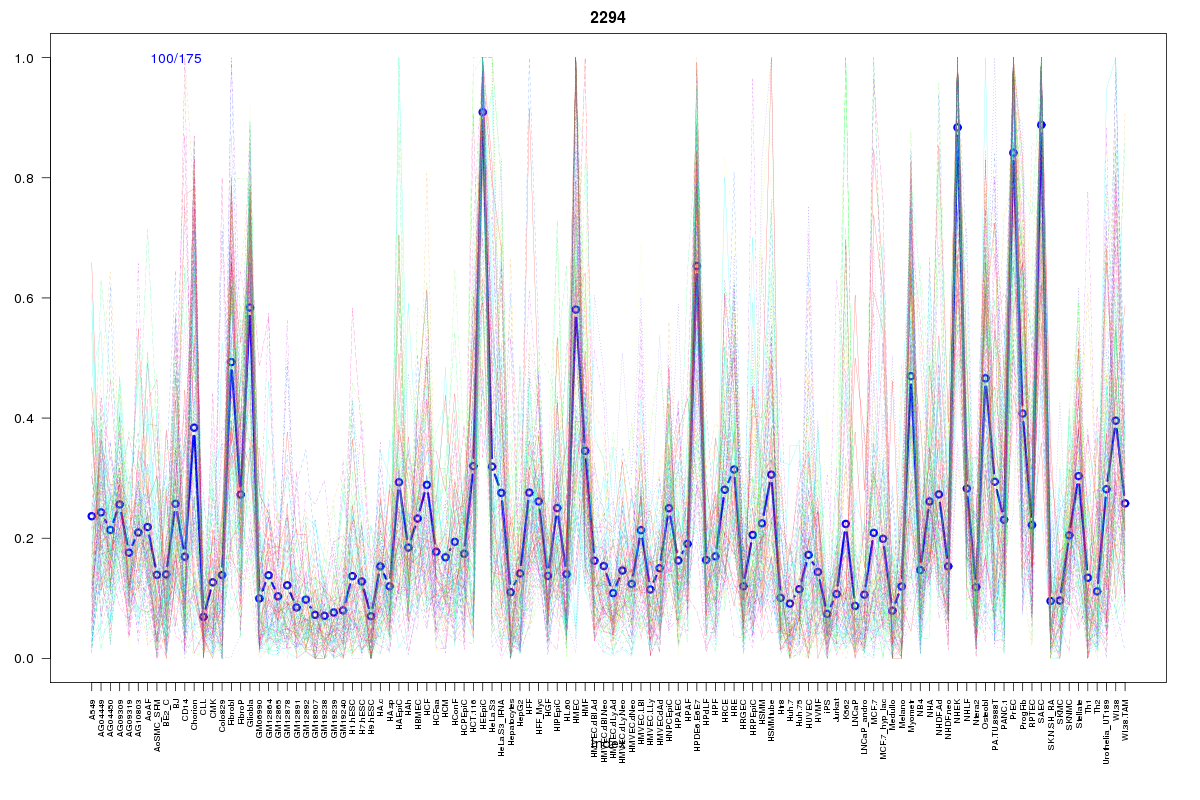 | 2294 | 1 |
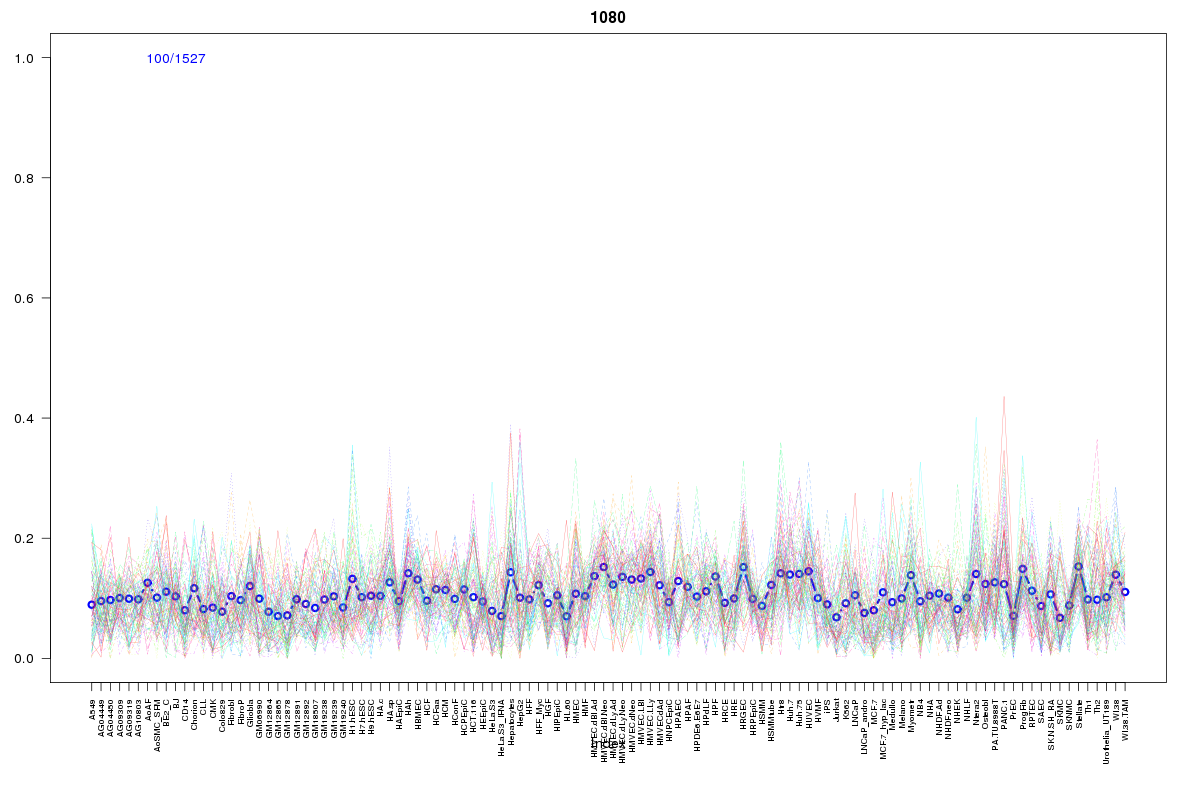 | 1080 | 1 |
 | 615 | 1 |
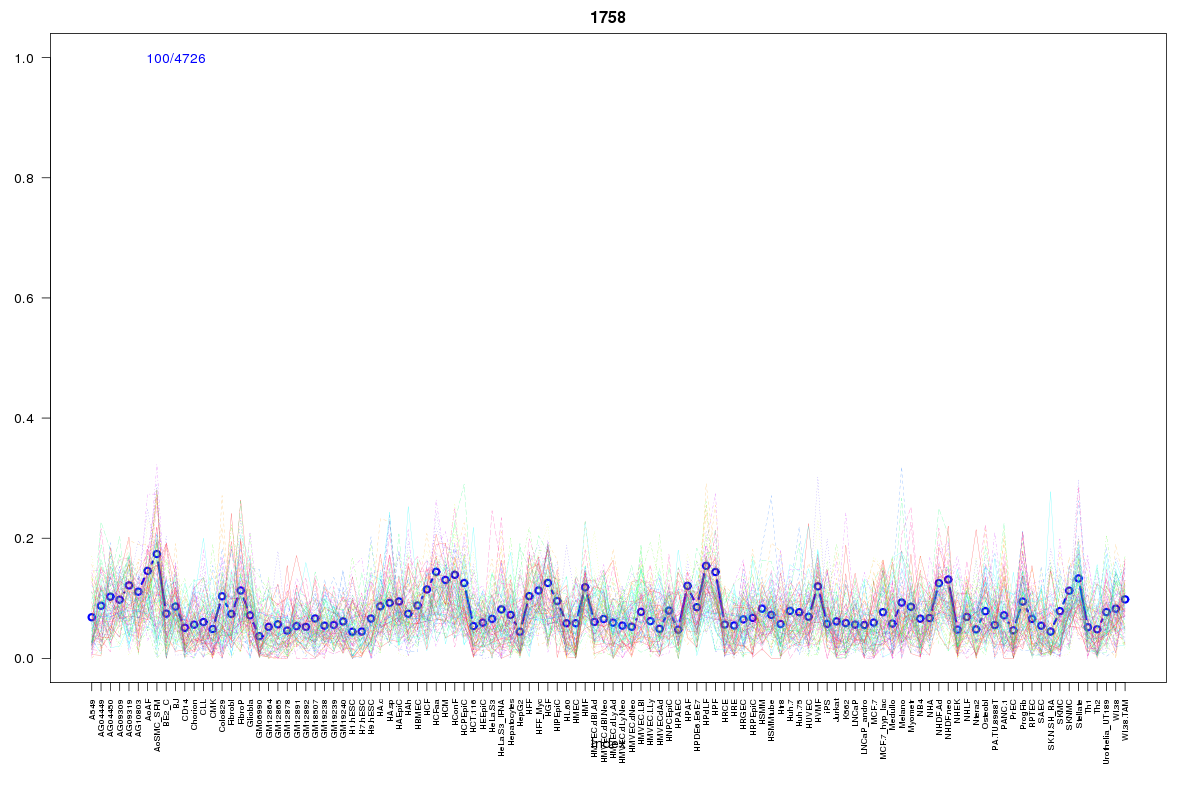 | 1758 | 1 |
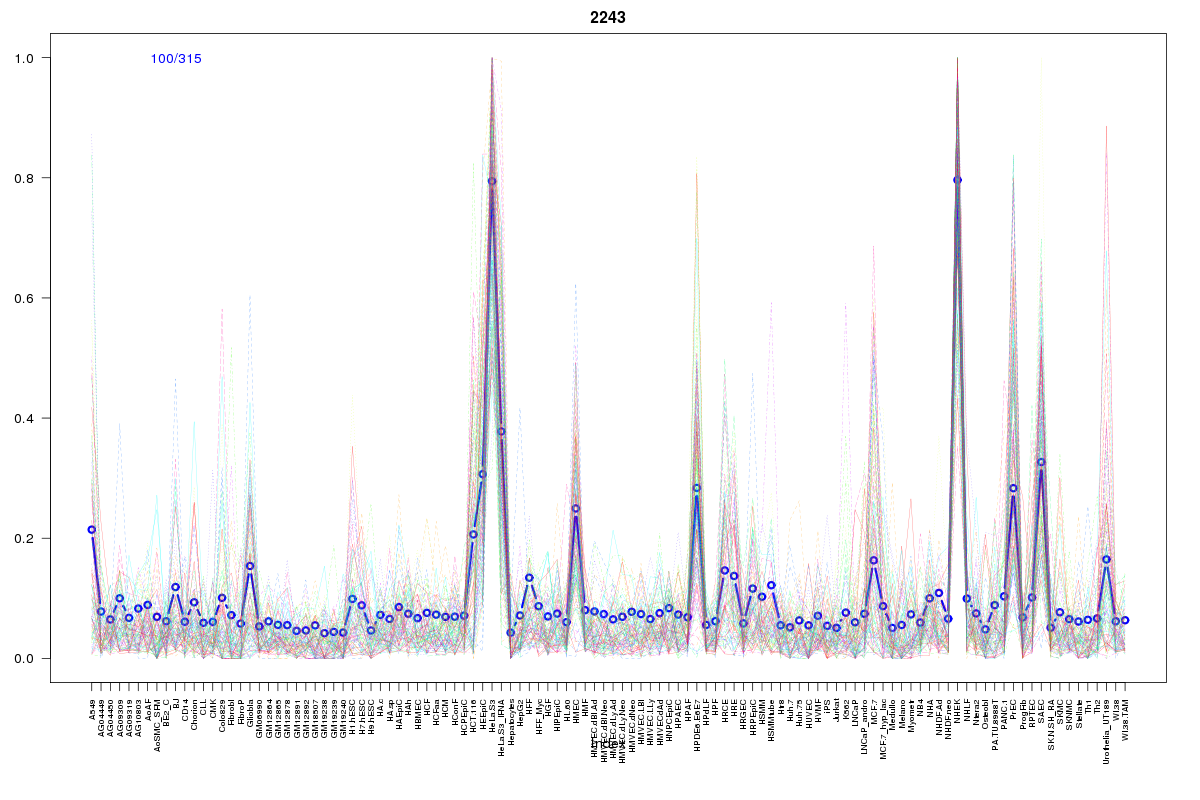 | 2243 | 1 |
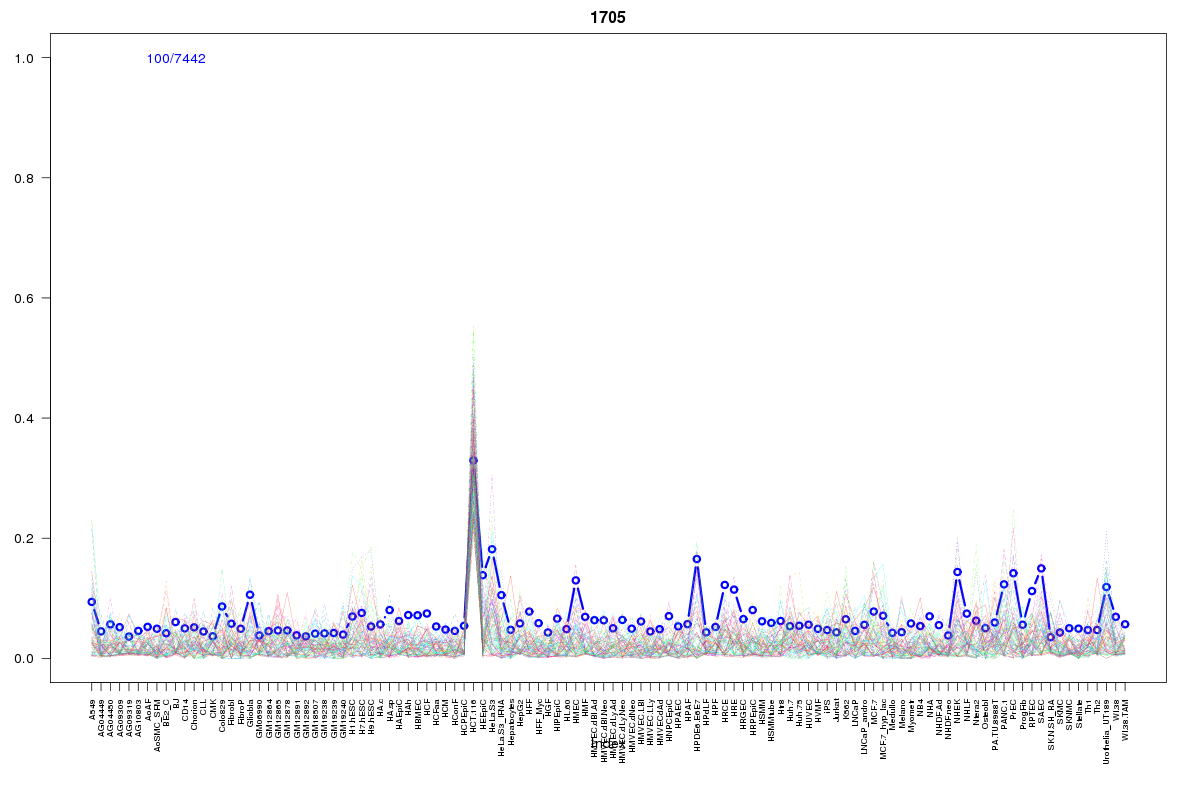 | 1705 | 1 |
Resources
BED file downloads
Connects to 39 DHS sitesTop 10 Correlated DHS Sites
p-values indiciate significant higher or lower correlation| Location | Cluster | P-value |
|---|---|---|
| chr1:150541820-150541970 | 2153 | 0 |
| chr1:150542500-150542650 | 2153 | 0 |
| chr1:150584020-150584170 | 250 | 0.001 |
| chr1:150450320-150450470 | 1734 | 0.001 |
| chr1:150544480-150544630 | 1080 | 0.001 |
| chr1:150586080-150586230 | 90 | 0.002 |
| chr1:150542200-150542350 | 2153 | 0.002 |
| chr1:150577300-150577450 | 450 | 0.003 |
| chr1:150543800-150543950 | 806 | 0.003 |
| chr1:150598800-150598950 | 1764 | 0.004 |
| chr1:150541540-150541690 | 1858 | 0.005 |
External Databases
UCSCEnsembl (ENSG00000143384)